Data wrangling project
•
0 likes•1,223 views

This document summarizes the data wrangling process of a dataset containing information on PhD theses defended in France between 1971-2020. The author scraped the data from an online database, then preprocessed, cleaned, and analyzed the data. Key steps included imputing missing values, identifying issues like default dates, handling outliers, and recoding variables. Preliminary results showed French was the most common language, and English theses increased in recent decades. Statistical analysis and web scraping helped verify findings.

Recommended
More Related Content
What's hot
What's hot (20)
Similar to Data wrangling project
Similar to Data wrangling project (20)
More from Matthieu Cisel
More from Matthieu Cisel (18)
Recently uploaded
Recently uploaded (20)
Data wrangling project
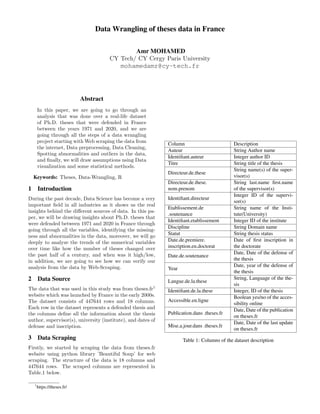
- 1. Data Wrangling of theses data in France Amr MOHAMED CY Tech/ CY Cergy Paris University mohamedamr@cy-tech.fr Abstract In this paper, we are going to go through an analysis that was done over a real-life dataset of Ph.D. theses that were defended in France between the years 1971 and 2020, and we are going through all the steps of a data wrangling project starting with Web scraping the data from the internet, Data preprocessing, Data Cleaning, Spotting abnormalities and outliers in the data, and finally, we will draw assumptions using Data visualization and some statistical methods. Keywords: Theses, Data-Wrangling, R 1 Introduction During the past decade, Data Science has become a very important field in all industries as it shows us the real insights behind the different sources of data. In this pa- per, we will be drawing insights about Ph.D. theses that were defended between 1971 and 2020 in France through going through all the variables, identifying the missing- ness and abnormalities in the data, moreover, we will go deeply to analyze the trends of the numerical variables over time like how the number of theses changed over the past half of a century, and when was it high/low, in addition, we are going to see how we can verify our analysis from the data by Web-Scraping. 2 Data Source The data that was used in this study was from theses.fr1 website which was launched by France in the early 2000s. The dataset consists of 447644 rows and 18 columns. Each row in the dataset represents a defended thesis and the columns define all the information about the thesis author, supervisor(s), university (institute), and dates of defense and inscription. 3 Data Scraping Firstly, we started by scraping the data from theses.fr website using python library ’Beautiful Soup’ for web scraping. The structure of the data is 18 columns and 447644 rows. The scraped columns are represented in Table.1 below. 1 https://theses.fr/ Column Description Auteur String Author name Identifiant.auteur Integer author ID Titre String title of the thesis Directeur.de.these String name(s) of the super- visor(s) Directeur.de.these. nom.prenom String last.name first.name of the supervisor(s) Identifiant.directeur Integer ID of the supervi- sor(s) Etablissement.de .soutenance String name of the Insti- tute(University) Identifiant.etablissement Integer ID of the institute Discipline String Domain name Statut String thesis status Date.de.premiere. inscription.en.doctorat Date of first inscription in the doctorate Date.de.soutenance Date, Date of the defense of the thesis Year Date, year of the defense of the thesis Langue.de.la.these String, Language of the the- sis Identifiant.de.la.these Integer, ID of the thesis Accessible.en.ligne Boolean yes/no of the acces- sibility online Publication.dans .theses.fr Date, Date of the publication on theses.fr Mise.a.jour.dans .theses.fr Date, Date of the last update on theses.fr Table 1: Columns of the dataset description
- 2. 4 Dealing with Missing Data Afterward, we started inspecting the missingness in the dataset. Firstly, the function vis miss() from naniar li- brary to visualize the missing data in each column and get its percentages. Figure 1: Missing data percentage per column Column missing % Date.de.premiere .inscription.en.doctorat 383668.00 86.00 Identifiant.auteur 129989.00 29.00 Langue.de.la.these 63765.00 14.00 Date.de.soutenance 56746.00 13.00 Year 56746.00 13.00 Identifiant.directeur 49172.00 11.00 Identifiant.etablissement 17085.00 4.00 Mise.a.jour.dans.theses.fr 177.00 0.00 Directeur.de.these 15.00 0.00 Directeur.de .these.nom.prenom. 15.00 0.00 Titre 9.00 0.00 Discipline 5.00 0.00 Etablissement .de.soutenance 4.00 0.00 Auteur 0.00 0.00 Statut 0.00 0.00 Identifiant.de.la.these 0.00 0.00 Accessible.en.ligne 0.00 0.00 Publication.dans.theses.fr 0.00 0.00 Table 2: Missing data count and percentage per column From Figure.1 and Table.2, we can see that the col- umn ’Date.de.premiere.inscription.en.doctorat’ has the biggest proportion of missing values with a percentage of 86% followed by 29% of missing data in the ’Iden- tifiant.auteur’ column, and then the missing values de- crease for 14-13% for the columns ’Langue.de.la.these’, ’Date.de.soutenance’, ’Year’, ’Identifiant.directeur’, and 4% for the column ’Identifiant.etablissement’ and the rest of the columns approximately have 0% of missing values. We can notice from the graph along with the table above that the columns ’Date.de.soutenance’ and ’Date.de.premiere.inscription.en.doctorat’ are highly dependent, where they complement each other in the sense that the rows which have miss- ing values in ’Date.de.soutenance’ aren’t missing in ’Date.de.premiere.inscription.en.doctorat’ and vice versa, and this can be explained by the fact that the thesis is officially considered as a Ph.D. thesis by the french education system on the day on which it was defended. Moreover, a new variable was created using rnorm() function to simulate the number of pages per thesis, with a mean number of pages of 200 pages and a standard deviation of 50 pages, where 20% of data in the cre- ated column is missing. To treat this missingness in the number of pages column, we used imputation with the mean number of pages as the data is centered around the mean, and the missingness is limited, so that the im- putation will not affect the mean of the data, and won’t cause many effects on the standard deviation. Figure 2: Missing data per column percentages before the number of pages imputation
- 3. Figure 3: Missing data per column percentages after n.pages imputation As we can see from Figure 2 and Figure 3, the number of pages imputation was made successfully and reduced the total missingness of data by 1.1%. 5 Common Issues In this section, we are going to go through the common issues that were discovered during the data wrangling process and what can be the causes of such issues. Firstly, during the processing of the ’Date.de.soutenance’ column of the dataset, it was found that 71.8% of the theses in the dataset were recorded to be defended on the first of January over the years. These insights were found using the function filter() and group by() from the library dyplyr in R, where all the dates were split into 3 columns of the day, month, and year then grouped and counted the theses that were defended on the first day of the first month of each year. From a primary point of view, it is clear that the theses which were found to be defended on the first of January were recorded on a default date which is the first of January and that is why we can see the majority of the theses are defended on that date, while in fact, this day is a public holiday in France, and no theses can be defended on that day. Figure 4: Percentage of theses on the first of January over years As we can see in Figure 4, the percentage on the the- ses recorded to be defended on the first of January over the years decreased over time from being approximately equal to 100% in 1971 till it became approximately equal to 0% in 2020. Moreover, in the ’Auteur’ column of authors’ names, we have found multiple theses that were defended by the same name, so we had to investigate the reason why those names appeared multiple times in the dataset. We picked the name ’Cécile Martin’ from the dataset which had 7 theses defended in total. We applied group by() and filter() methods along with count on the author name and the author ID. Author ID Frequency Cecile Martin 179423568 1 Cecile Martin 182118703 1 Cecile Martin 203208145 1 Cecile Martin 81323557 4 Table 3: Theses associated with author name Cécile Martin From Table.3 above, it was found that the 7 theses as- sociated with the name Cécile Martin were defended by 4 different authors, and Cécile Martins with ID (81323557) has defended 4 theses and it was verified from the dataset that the 4 theses are all in fields associated with Biology. Moreover, it was verified through theses.fr that Cécile Martins with ID (81323557) defended the 4 theses 2 . For further verification, we built a scraper function from scratch to access any author’s profile on theses.fr website, and scrap the number of theses defended by the author, and so we can verify whether the author has defended the number of theses given in the dataset or it is a mistake. In Cécile Martin’s case, the scraper returned that Cécile Martin has defended 4 theses, so the result we found through the dataset is correct. Afterward, we proceeded to check for any issues in the ’Identifiant.directeur’ column which represents the ID of the supervisor(s) who supervised the theses. Firstly, we found 3 main issues in the supervisor id columns which are: - 35163 supervisors’ IDs end with the character ’X’. - 59108 supervisors’ IDs have commas in the IDs. - 4724 supervisors’ IDs consist of 1 or 2 digit numbers. 2 https://theses.fr/081323557
- 4. After further investigation, it was found that the su- pervisors’ IDs that end with the character ’X’ can be treated by removing the character ’X’ from the end of the IDs. Then we investigated the IDs containing commas in them, and it was found that those IDs are incorrectly recorded as a reason that those theses were supervised by multiple supervisors. In addition, we observed a severe recession in the num- ber of theses defended in the years 2019 and 2020. Figure 5: Number of theses defended over the years As we can see in Figure 5, there is a severe recession in the number of theses defended per year. From a prelimi- nary point of view, we suppose to be caused by COVID- 19 which forced most of the academic institutions to be closed for approximately 1 year and a half. 6 Outliers After spotting the common issues in the main columns of the dataset, we went further to check whether the data has outliers or not and if it has if these outliers recorded y mistake. We started by investigating the supervisors by check- ing the number of theses that they have mentored. We used group by() method along with filter(), count(), and arrange() to get the most frequent supervisors in the dataset. Supervisor Supervisor ID Frequency 1 Jean-Michel Scherrmann 59375140 208 2 Francois-Paul Blanc 26730774 205 3 Pierre Brunel 26756625 193 4 Philippe Delebecque 29561248 178 5 Guy Pujolle 27084868 177 6 Michel Bertucat 98531891 173 7 Bernard Teyssie 27158578 146 8 Bruno Foucart 26870177 132 9 Henry de Lumley 26997894 132 10 Jean-Claude Chaumeil 58552499 131 Table 4: Supervisors with the highest numbers of these super- visions From Table 4. above, we can see that the supervi- sors above have mentored a very large number of theses. To verify that the supervisors in the table have men- tored these numbers of theses, we used group by() with the supervisors’ names and IDs to make sure that they weren’t recorded incorrectly. Unexpectedly, those num- bers were correct, and the supervisors mentored these large numbers of theses. To verify the number of theses supervised by each su- pervisor from Table 4, we built a scraper function, sim- ilar to the one which was built for Authors’ number of theses defended verification, for supervisors, to be able to verify the number of theses mentored by each super- visor. By running the scrapper we got an accuracy of 72% of the outliers to have correct values, and the rest are even mistakes or have supervised more theses after the collection of the data. To verify our findings statistically, we used the quan- tile() function to get the extreme values below and above which the number of supervised theses by the supervisor is considered as an outlier. For the 97.5 and 2.5 per- centiles, we got that the values of 13 and 1 respectively, which means that any number of these supervised less than 1 or greater than 13 is an outlier. Moreover, we calculated the z-score for the number of supervised the- ses with a 95% confidence interval, we got approximately the same result where it showed that if the number of theses is greater than or equal to 12 or less than 1, it is considered as an outlier. Moreover, we used the same techniques used earlier in identifying the outliers in supervisors on the column of authors. After grouping the data by the authors’ names and IDs, we used the quantiles method to detect the range in which below or above it the author’s number of theses defended is considered as an outlier. Surpris- ingly, specifying the 2.5 and 97.5 percentiles, it was found that any author who has several theses defended different than 1 thesis, is considered as having an outlier number of theses defended. And for further verification, we used the scraper built earlier to verify the number of theses defended by Cecile Martin to verify the outliers in the authors. When the scraper was run on the first 15 authors with the highest number of these defenses, it gave an accuracy of 76 To verify the findings of the number of theses defended by the authors, we calculated the z-score to find that with more than 99% confidence interval, any author who defended different than 1 thesis, is considered as having an outlier number of theses defended. 7 Preliminary Results Afterward, we moved forward to process the languages. We started by recoding the languages data using the dplyr library into four categories which are: French, En- glish, Bilingual, and Other, where a thesis is considered bilingual if it is written in English and French, and the Other category is for any other condition which is not in the first 3. We started by recoding the languages using the mutate() function from dyplyr package in R, then we used filter(), group by(), and count() to get the count of theses written in each language category. From table 5 above we can see the frequency of each language category in the dataset, and it’s clear through
- 5. Language category Frequency 1 Bilingual 10576 2 English 30942 3 French 334404 4 Other 71722 Table 5: Language categories frequencies the frequencies that Franch is the most used language in writing the theses in France, which is very reasonable since these theses were written in France. Figure 6: Number of theses per language category To have a better look at the frequencies of the lan- guage categories in the dataset, we plotted the bar graph above, and it enhances our observation of the French lan- guage is the most used in writing the theses in France. In addition, we were interested in investigating how the choice of the language of the manuscript evolved over the past decades. So, we used the library dplyr to filter, group, and count the theses that were defended on the same period, so that we can see the trend. Figure 7: Number of theses per language category over the years As we can see in Figure 7 surprisingly, the trend of the English category started to increase significantly over the past two decades. In addition, we were interested in knowing in which month do the authors tend to defend their theses. As we did previously, we used dplyr to group, filter, and count the data. Figure 8: Average percentages of theses defended per month As we can see in Figure 8, approximately 27% of the authors tend to defend their theses in December, while approximately 0% tend to defend their theses in August. Finally, we were interested in knowing the gender of authors that defended their theses over the past decades. To get this information, we processed the author names column in python and ran it through a library that de- tects the gender from the name. Then imported the generated data in R, and performed the previous steps of filtering, grouping, and counting. Figure 9: Number of theses defended over the years by gen- der of authors From Fig 9, we can see the trend where male and female authors have almost the same distribution of the number of theses over the years, but with fewer numbers for the males with approximately 25% less. Moreover, we were interested to see the same trend of the number of theses supervised by gender over the year for the supervisors, so repeated the same steps which were made to produce the Previous figure.
- 6. Figure 10: Number of theses supervised over the years by gender of supervisors As seen before in Figure 10, In Figure 11 we can see the same trend over the years for female and male su- pervisors for the supervised theses, but this time with almost an equal number of theses supervised by both genders. 8 Appendix Figure 11: Number of theses per language category over the years References Theses website: https://theses.fr/ Plotly area Plots: https://plotly.com/r/filled-area-plots/ STHD ggplot area plot:http://www.sthda.com/english/wiki/ggplot2- area-plot-quick-start-guide-r-software-and-data- visualization Visualizing missing data with Naniar :https://cran.r- project.org/web/packages/naniar/vignettes/getting- started-w-naniar.html