Download as PDF, PPTX

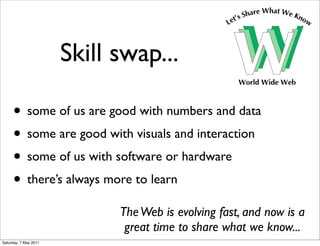


This document summarizes the goals and agenda for a data visualization barcamp on May 7th 2011 in Amsterdam. The event aims to foster skill sharing and collaboration between participants with different backgrounds in data, visuals, software and hardware. Recent trends that enable new possibilities for interactive and connected data visualizations on the web using open data sources and modern browser capabilities will be discussed. The agenda includes lightning talks, demonstrations, breakout groups and hacking sessions to explore visualization tools and collaborate on projects.