Download as PDF, PPTX


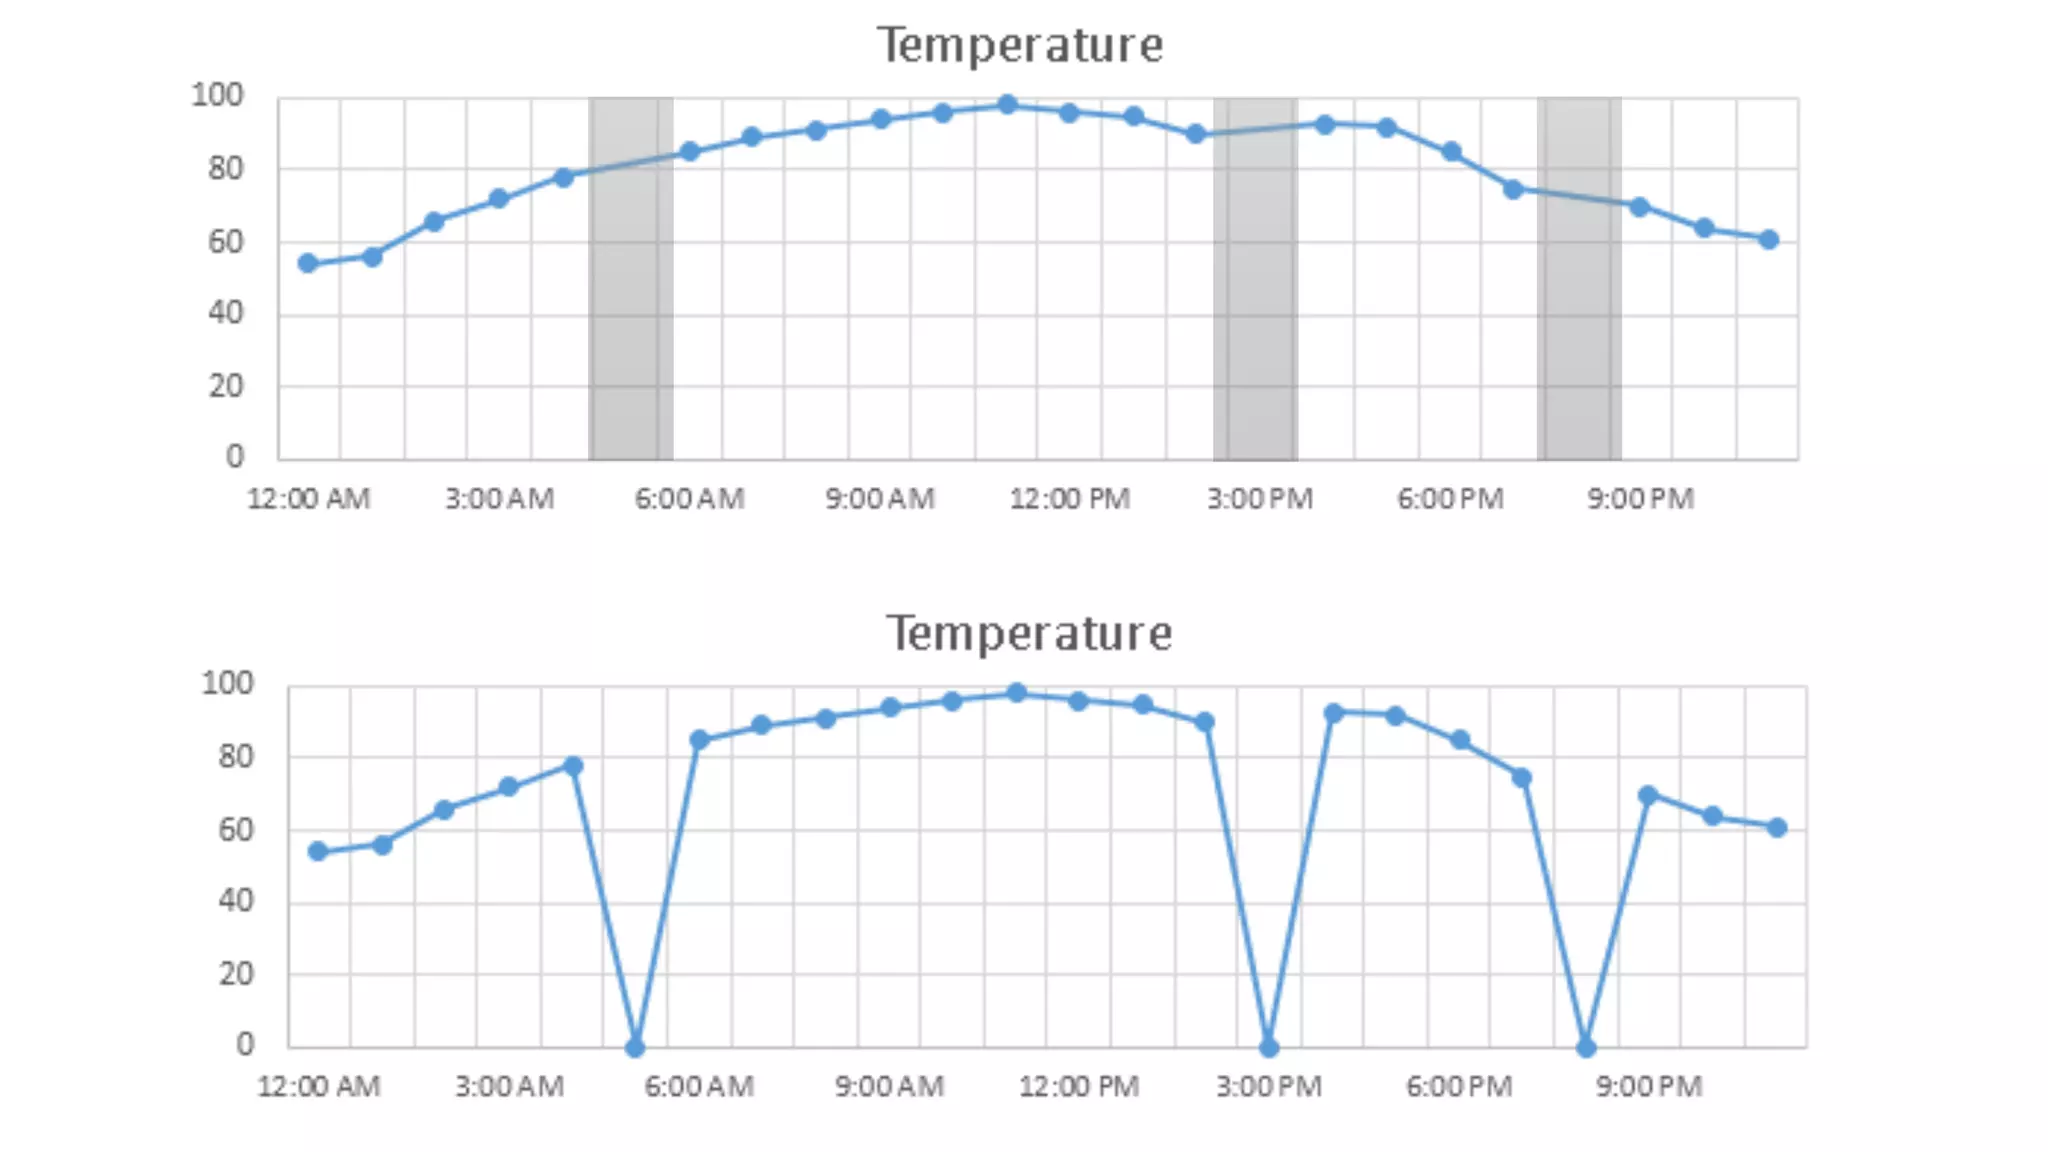


![4 . C O M M U N I C AT E S I M P LY
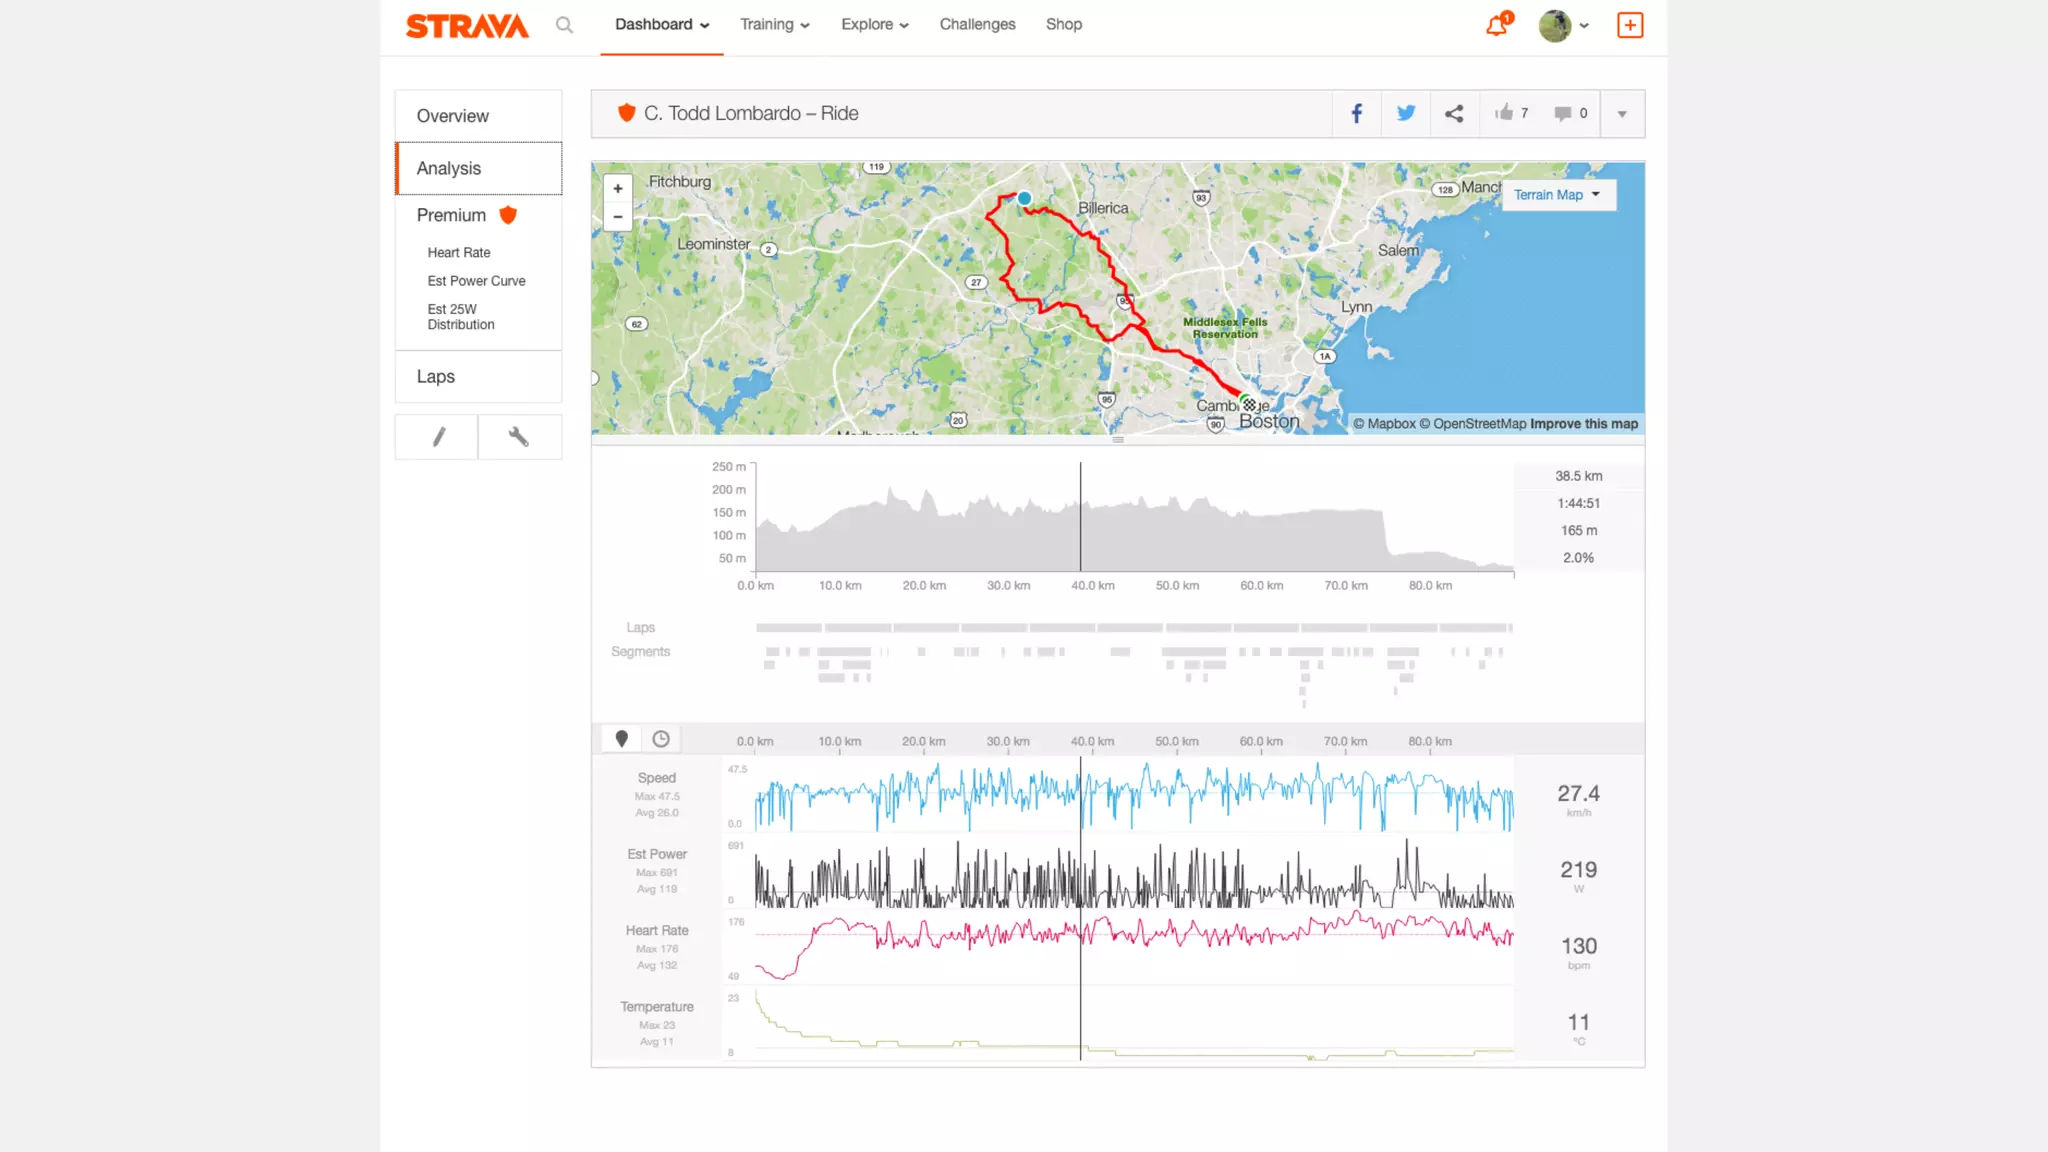
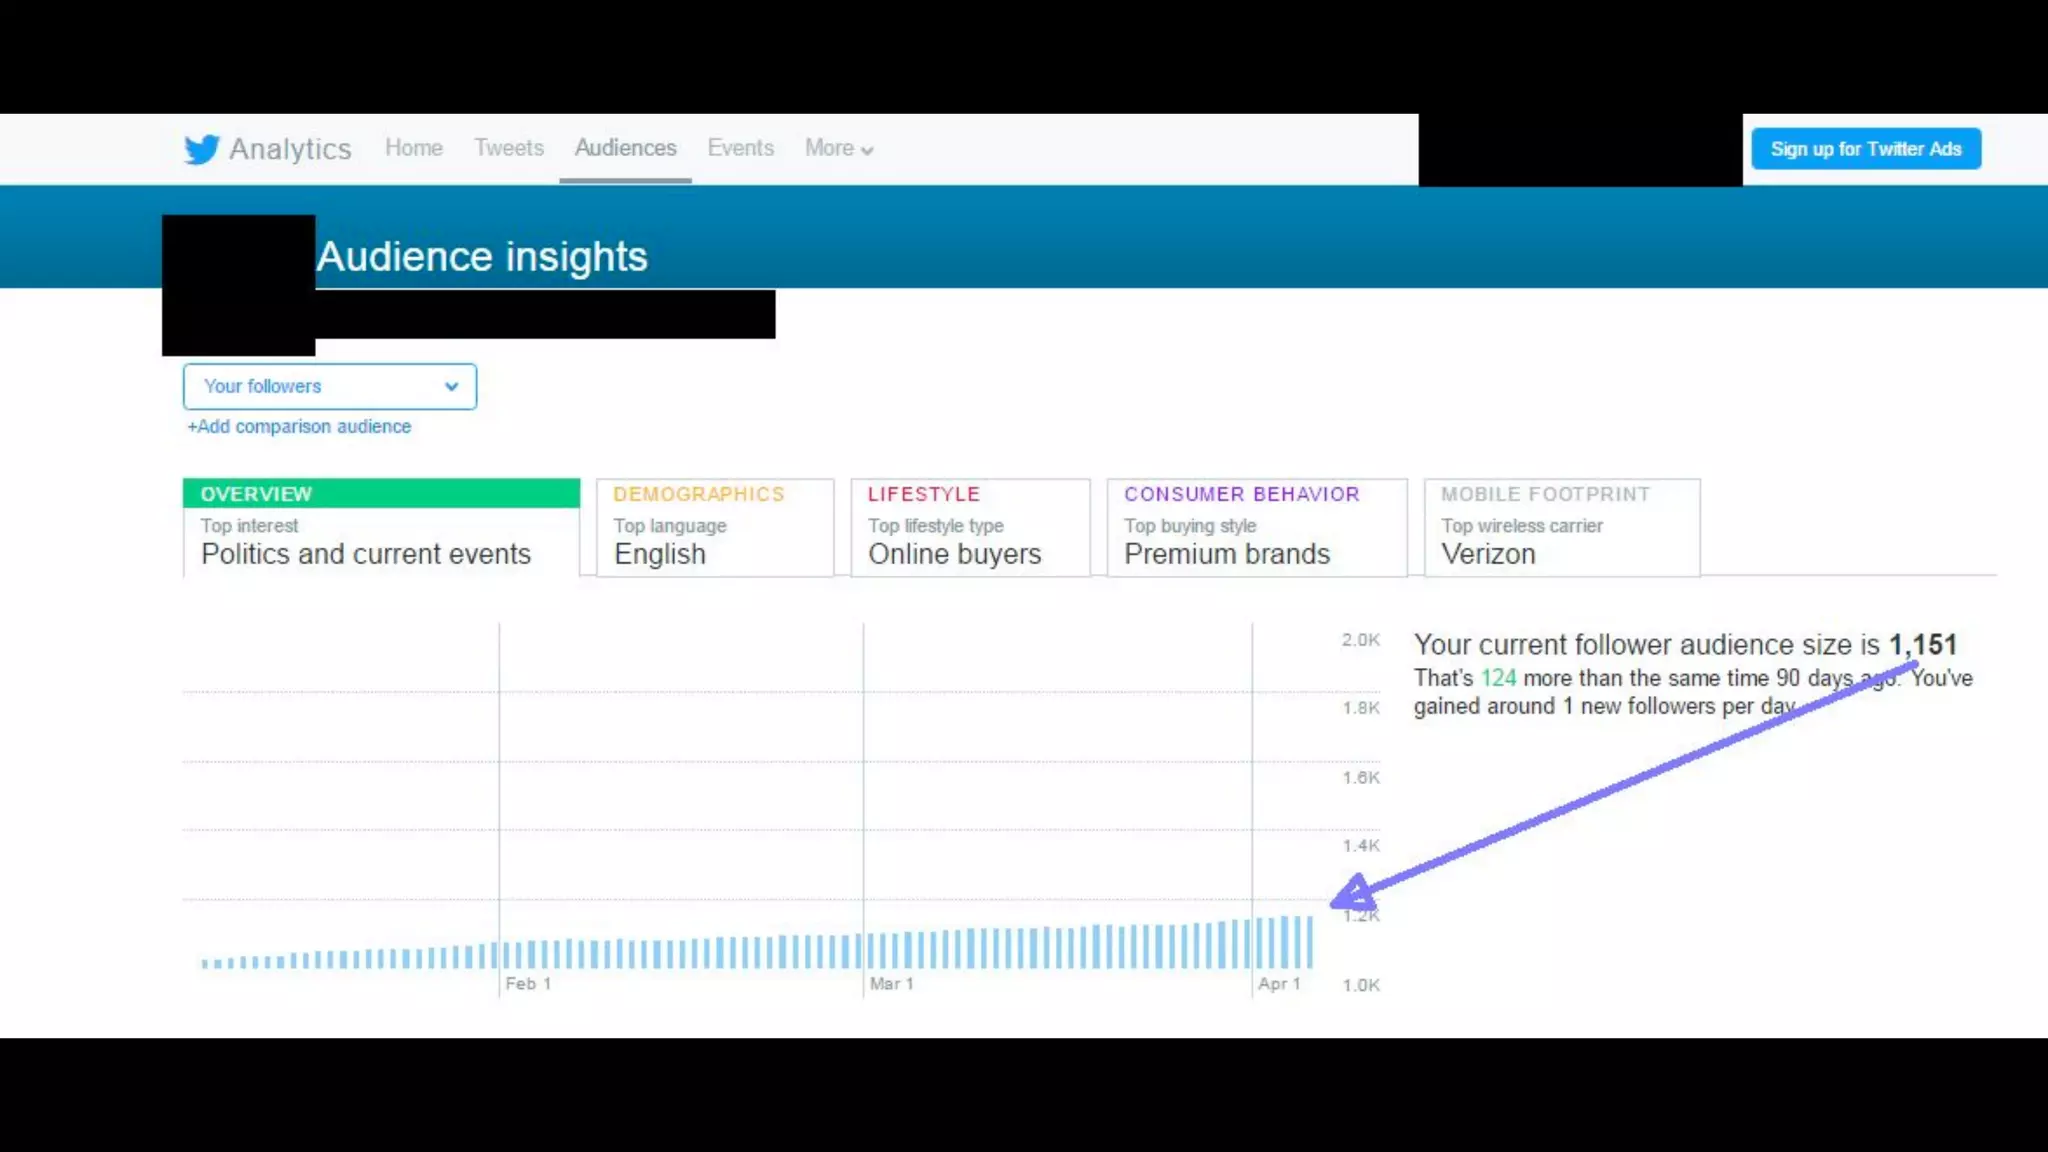
• How long does it take for your audience to arrive at your conclusion?
• Is the message delivered accurately & consistently?
• [Interactive] How many clicks to find the answer to their question?](https://image.slidesharecdn.com/xbt0kdbxqcuufxmxvojb-signature-93eb61c1365aa971a39342929613c8391713e554370492cc88eb063cf40320df-poli-160418010042/75/Data-Visualizations-in-Digital-Products-ProductCamp-Boston-2016-75-2048.jpg)
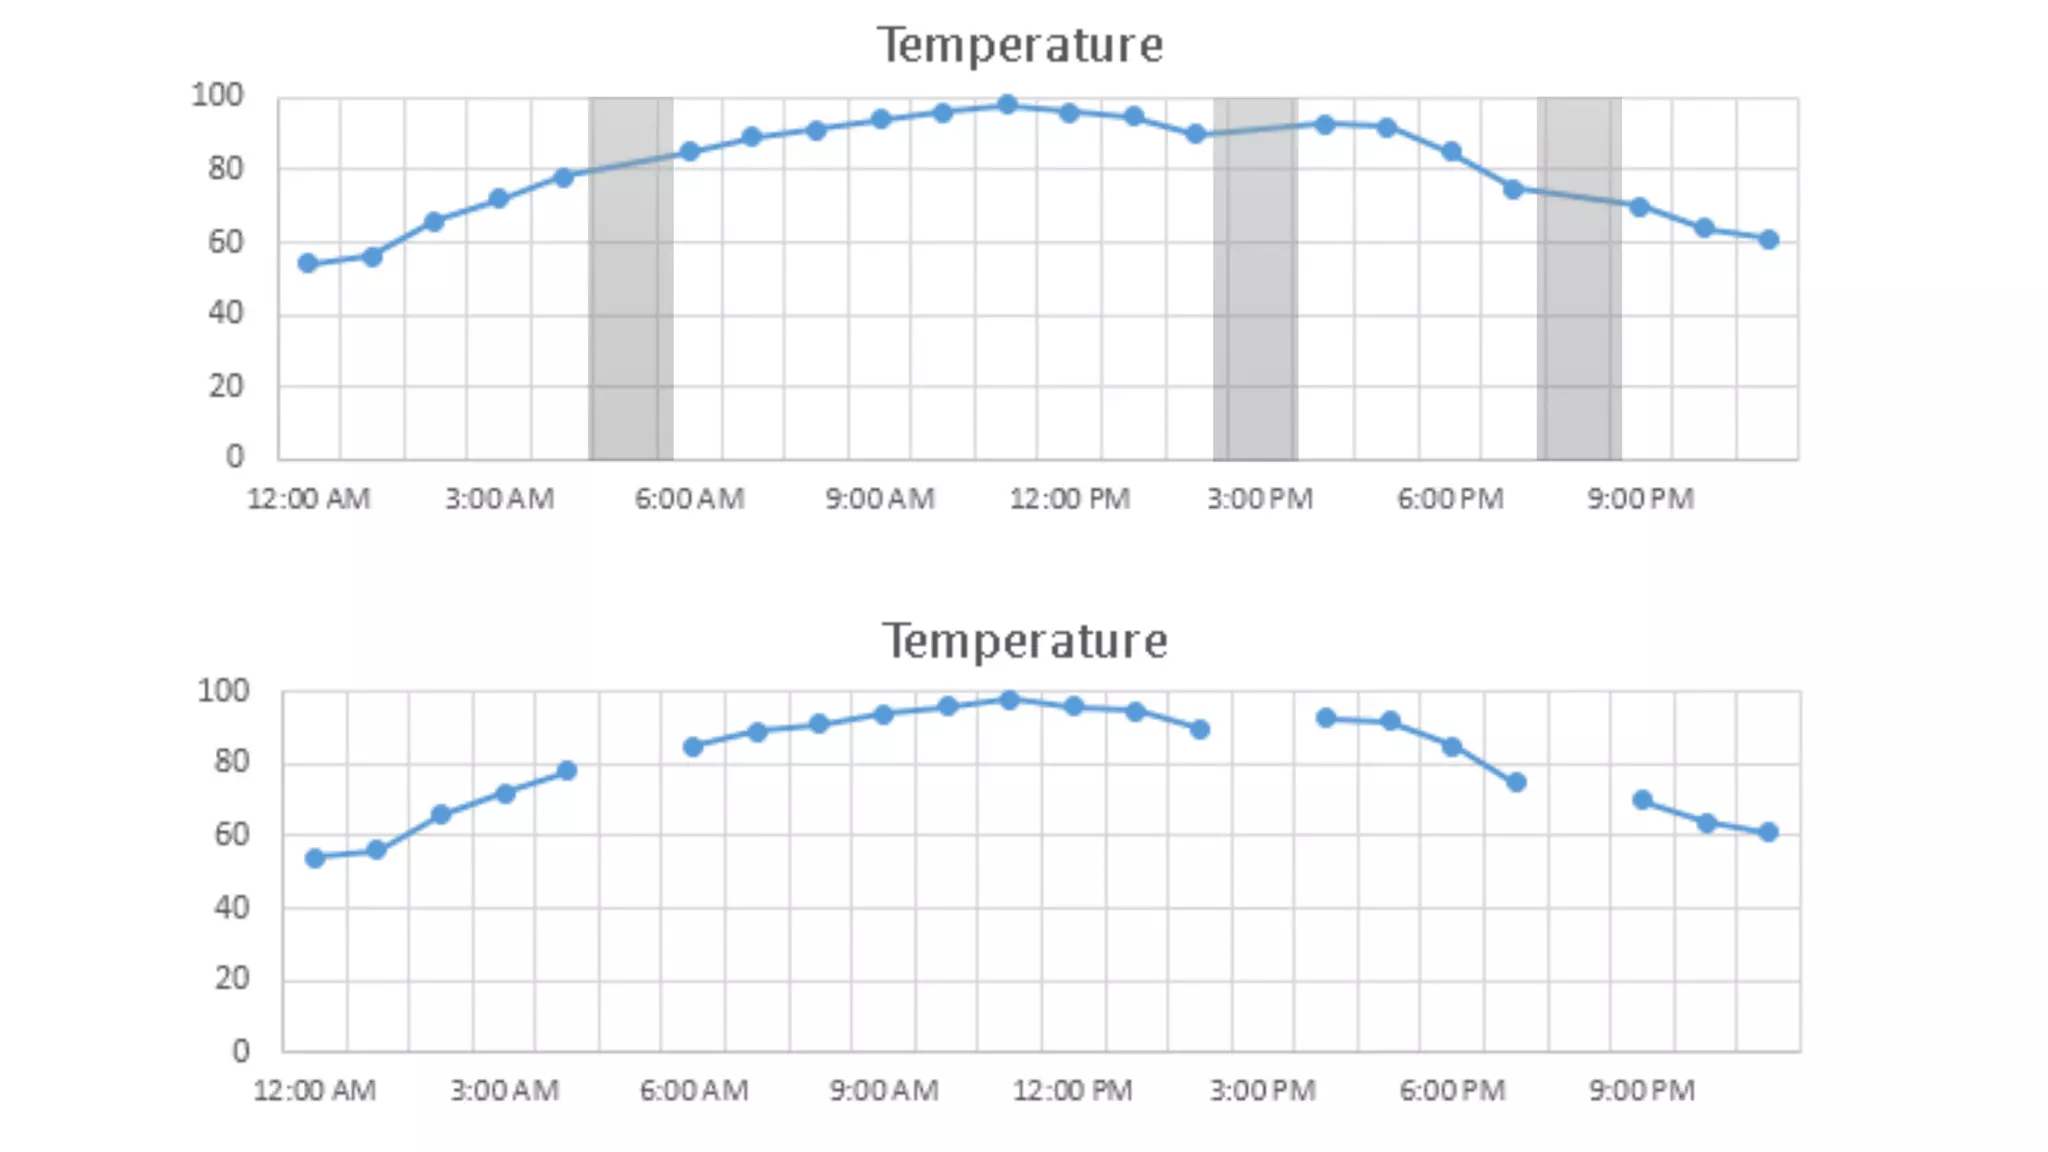
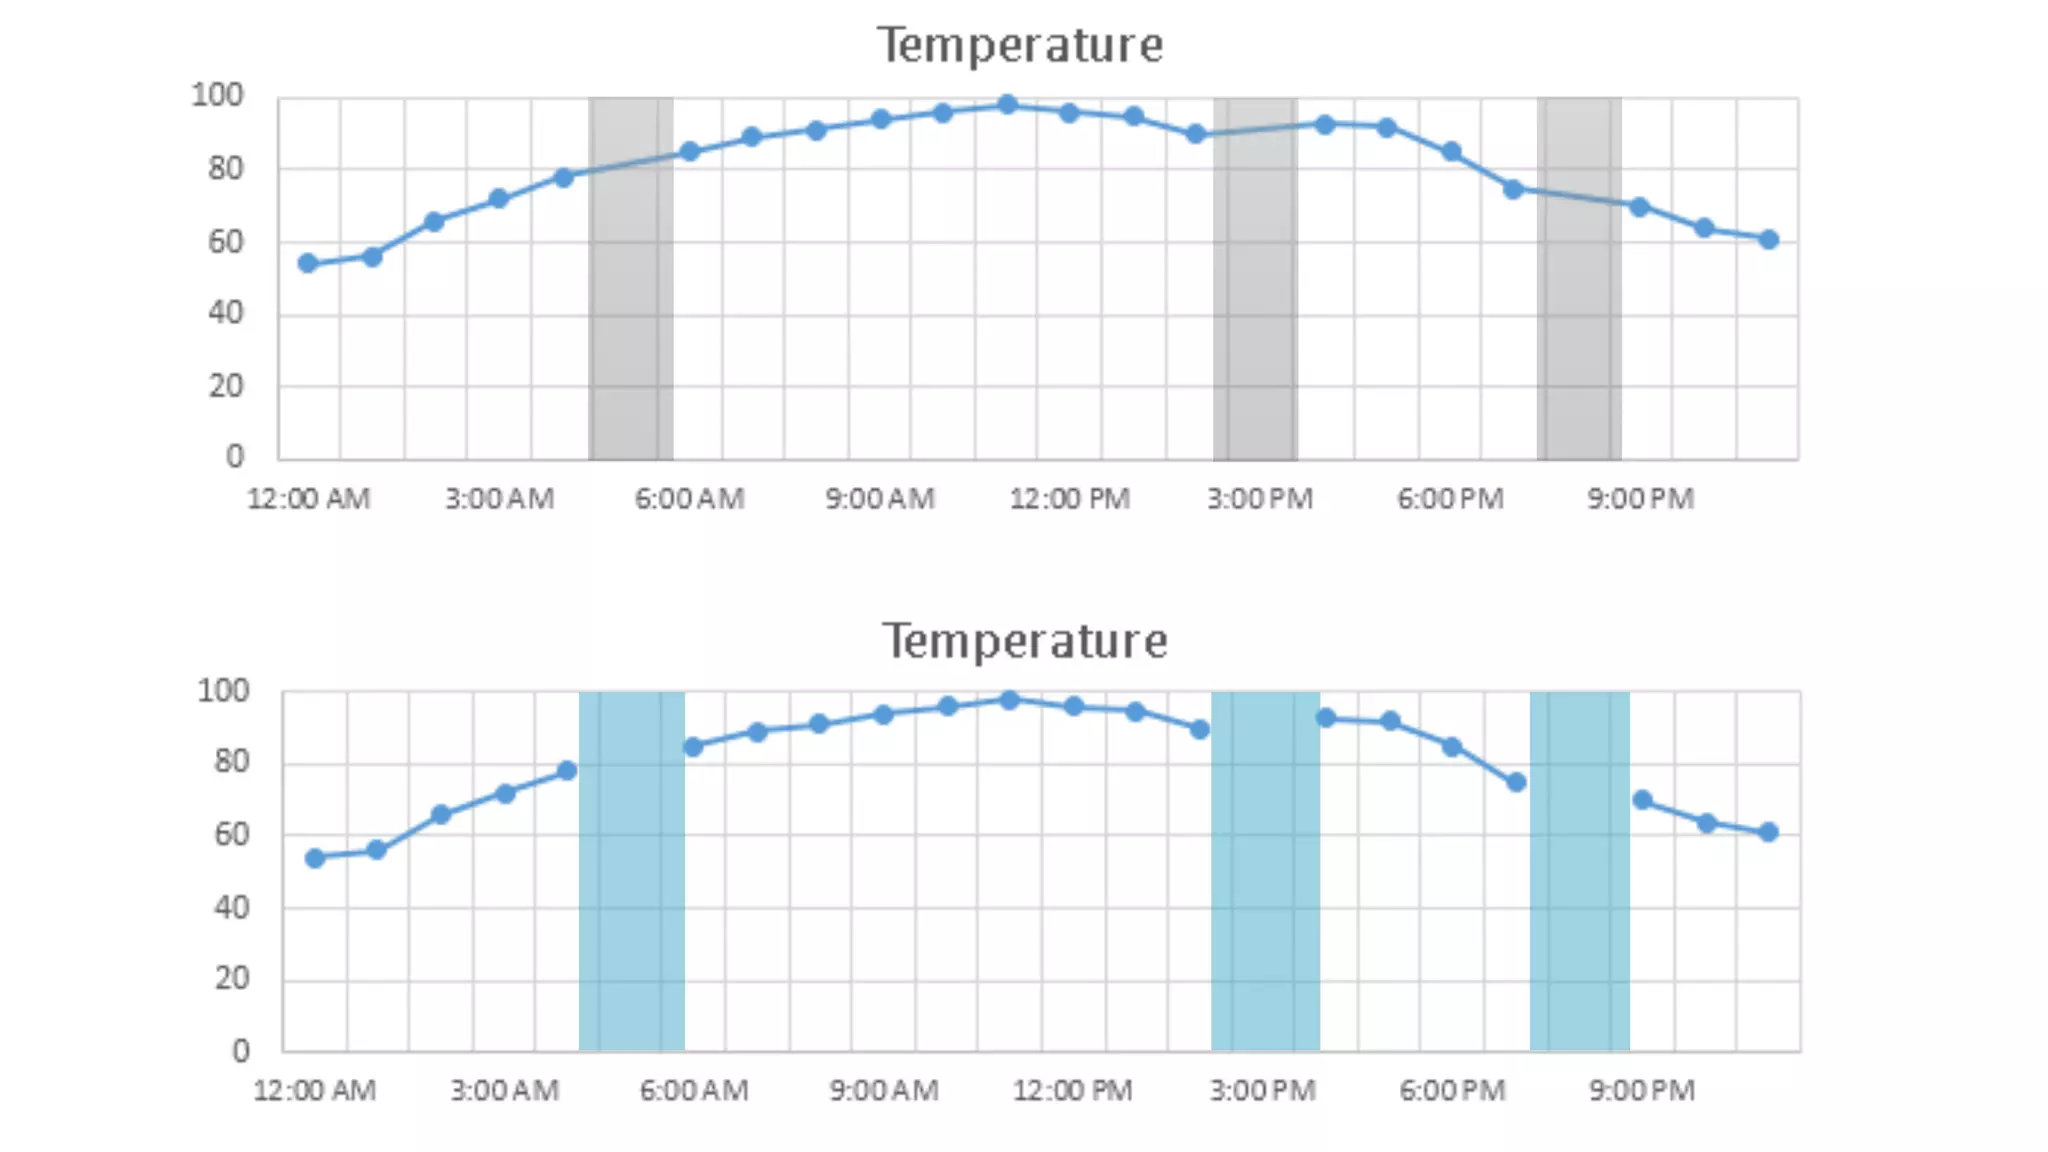
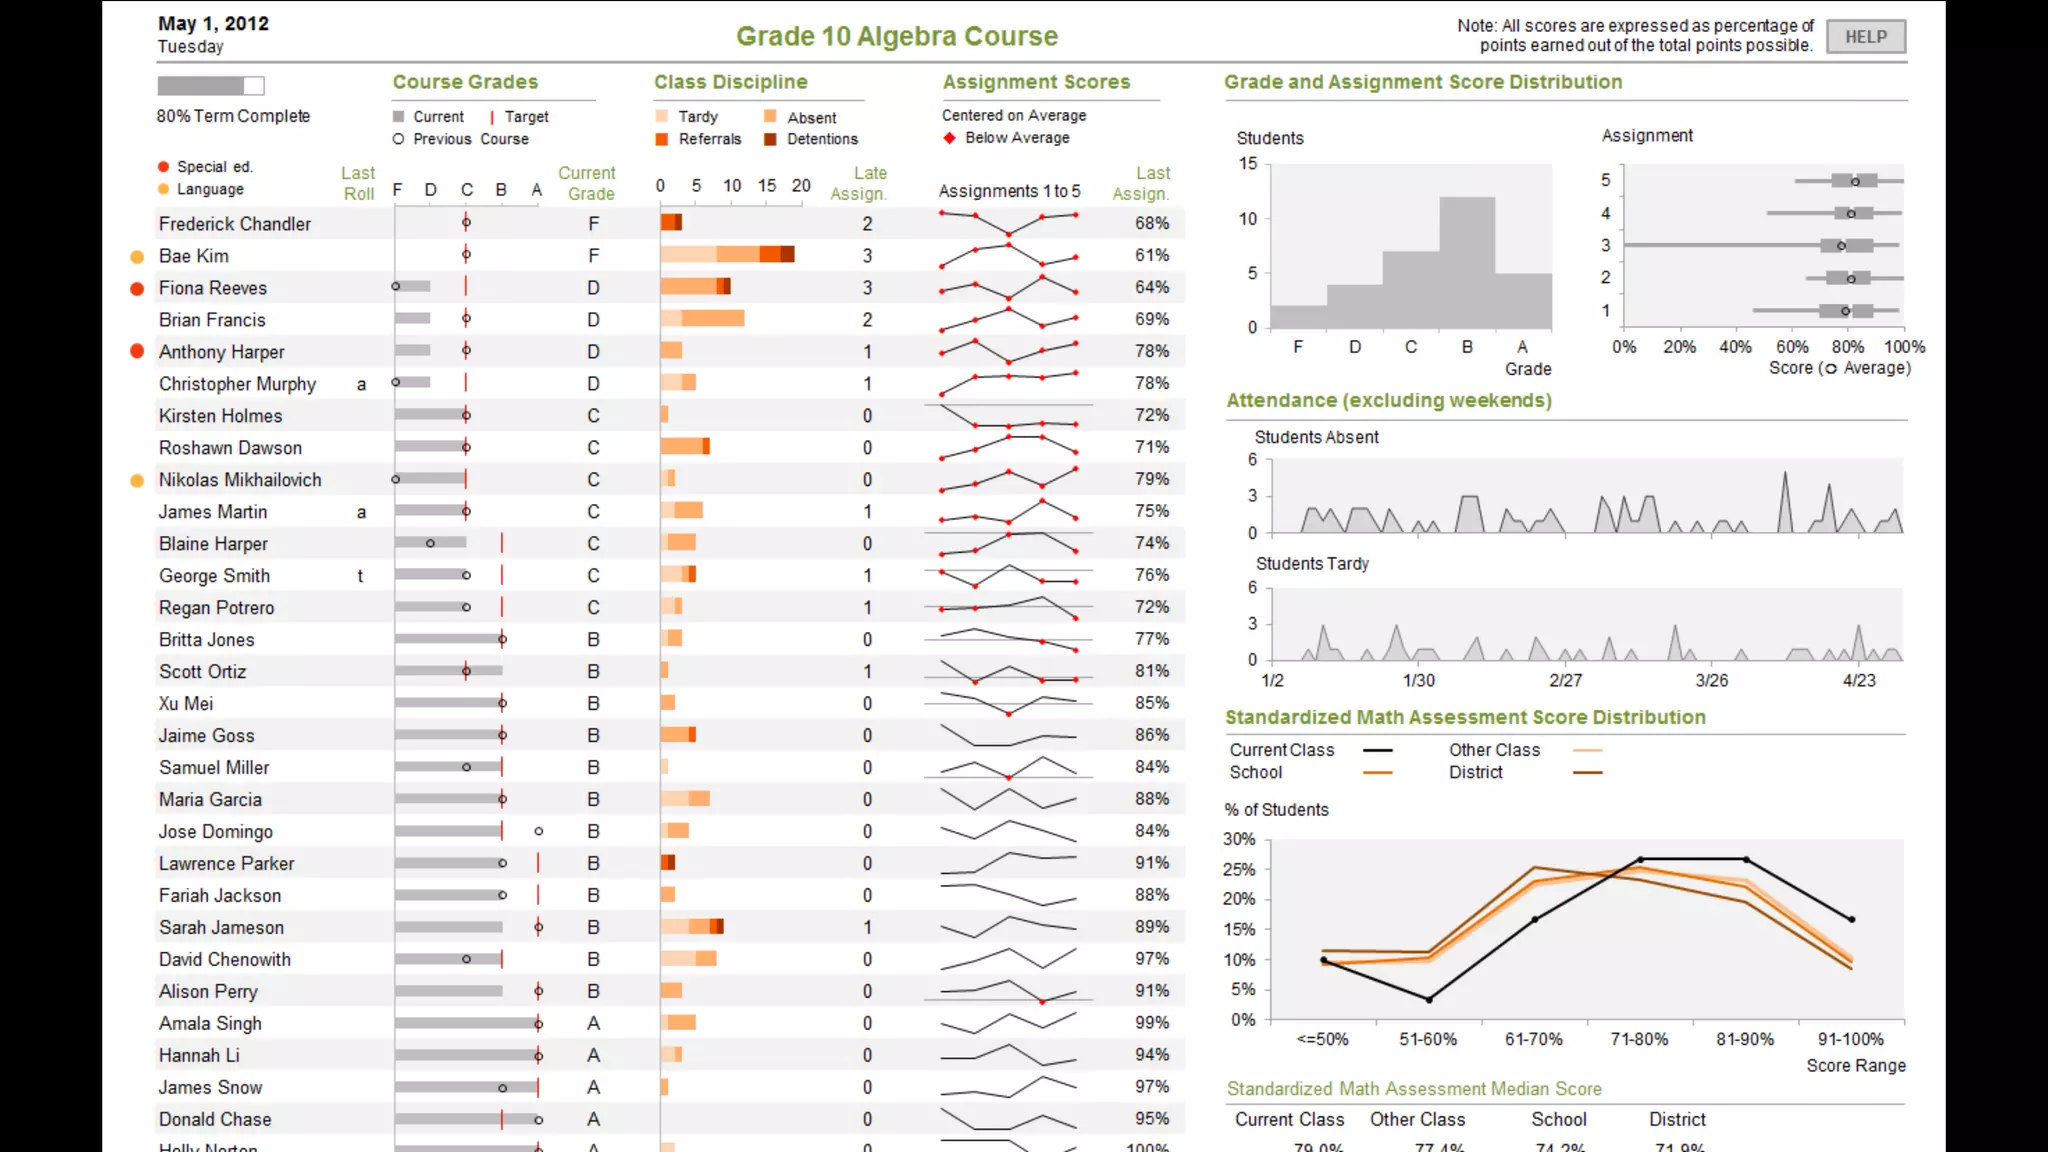
![4 . C O M M U N I C AT E S I M P LY
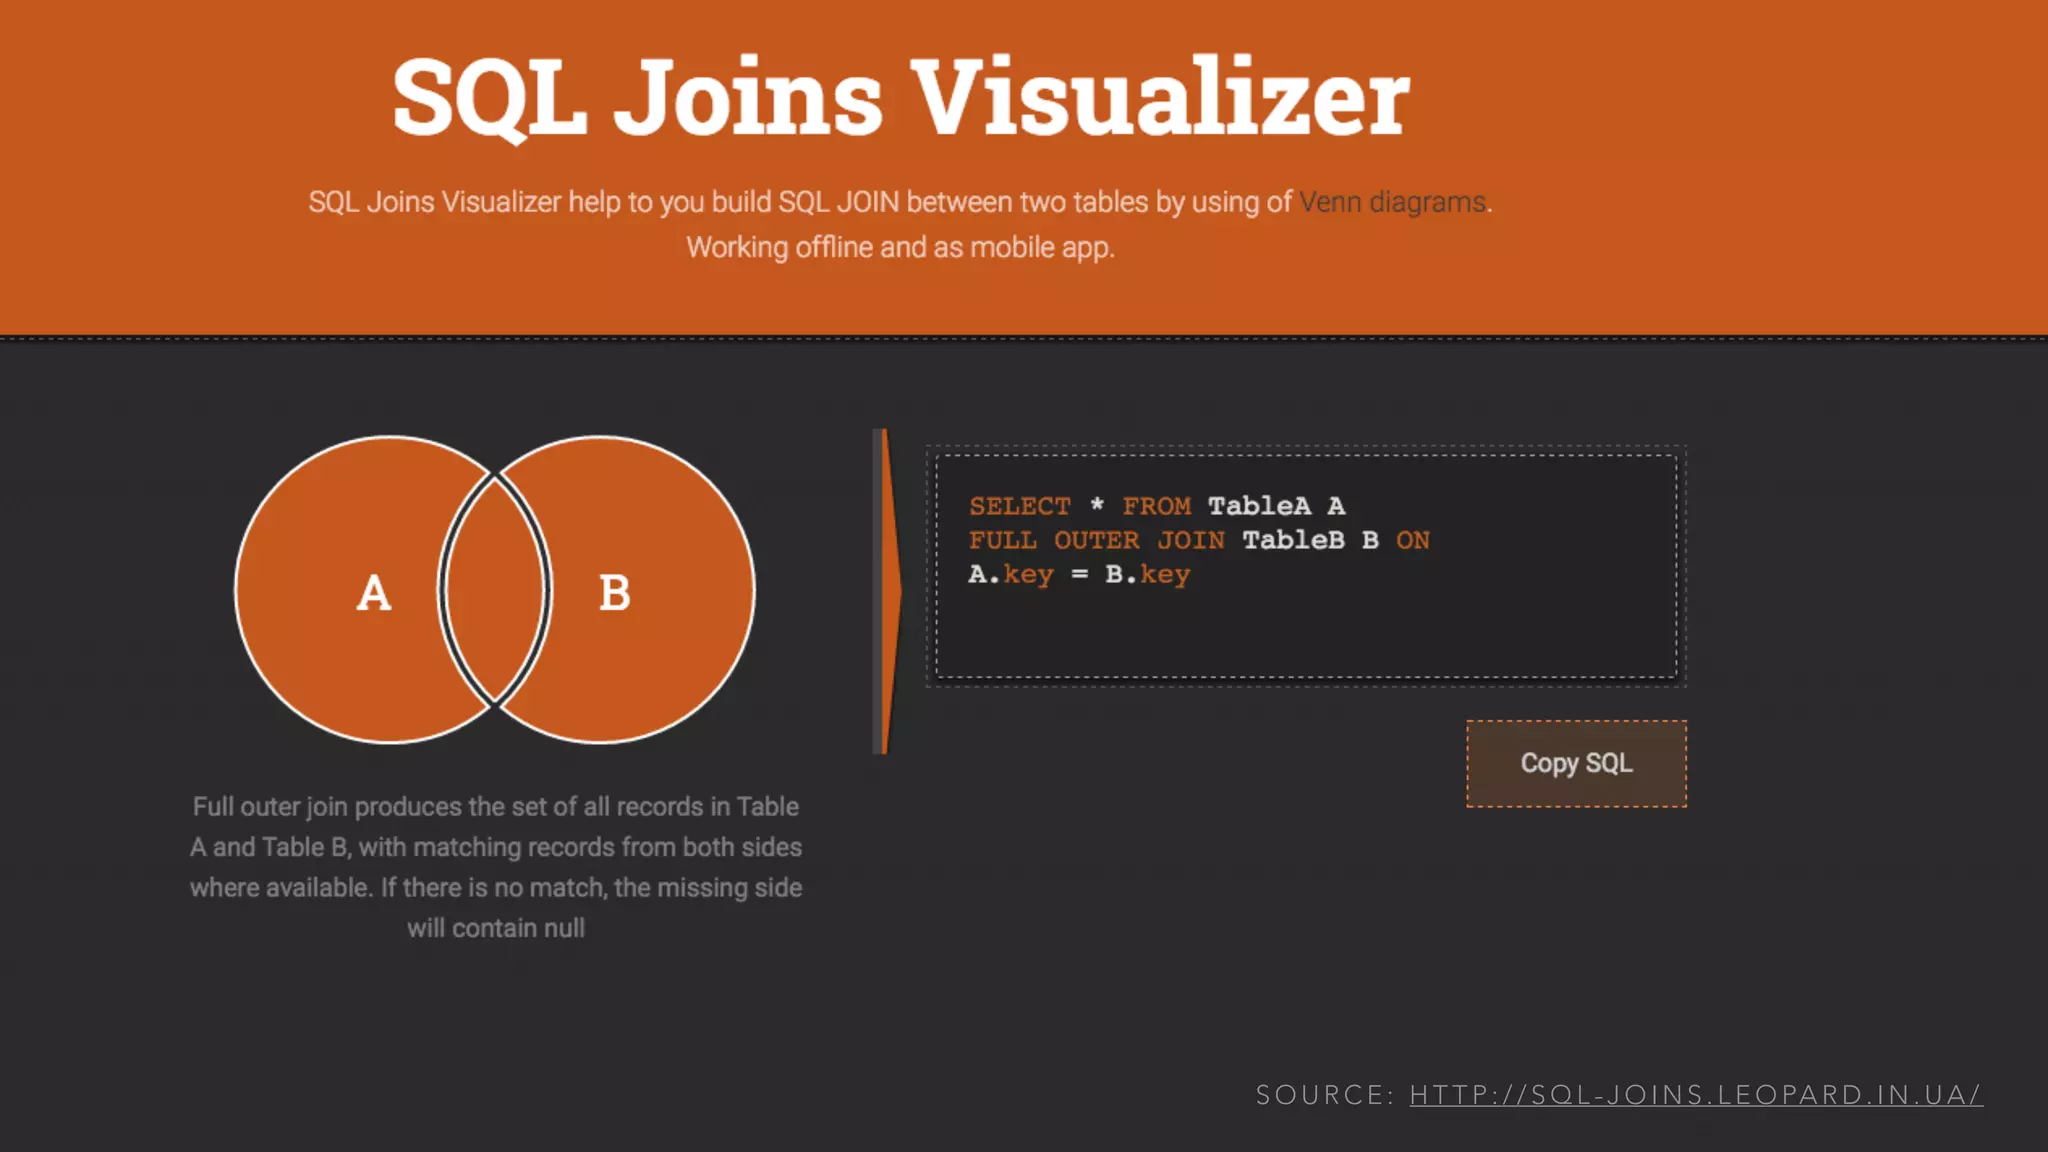
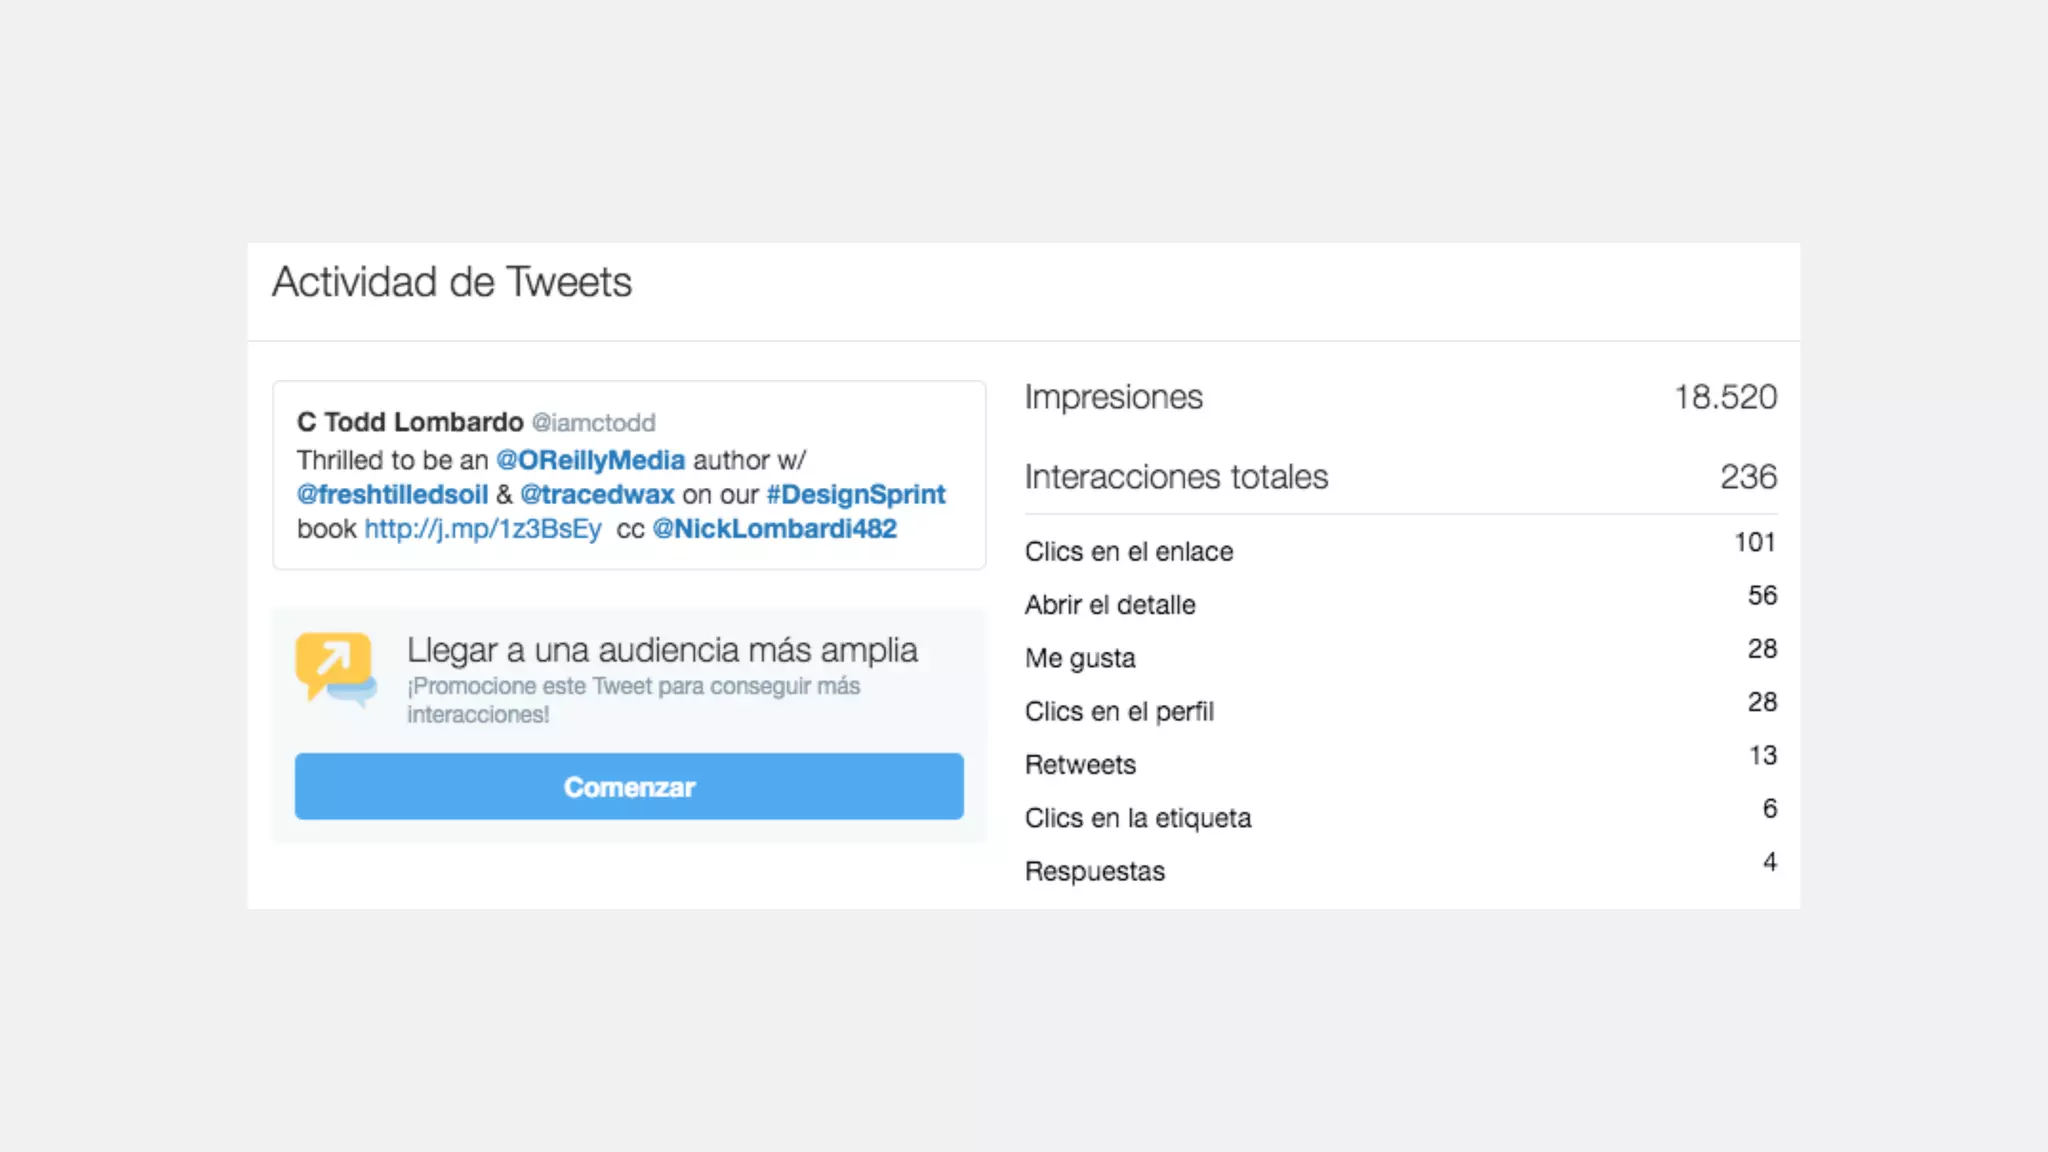
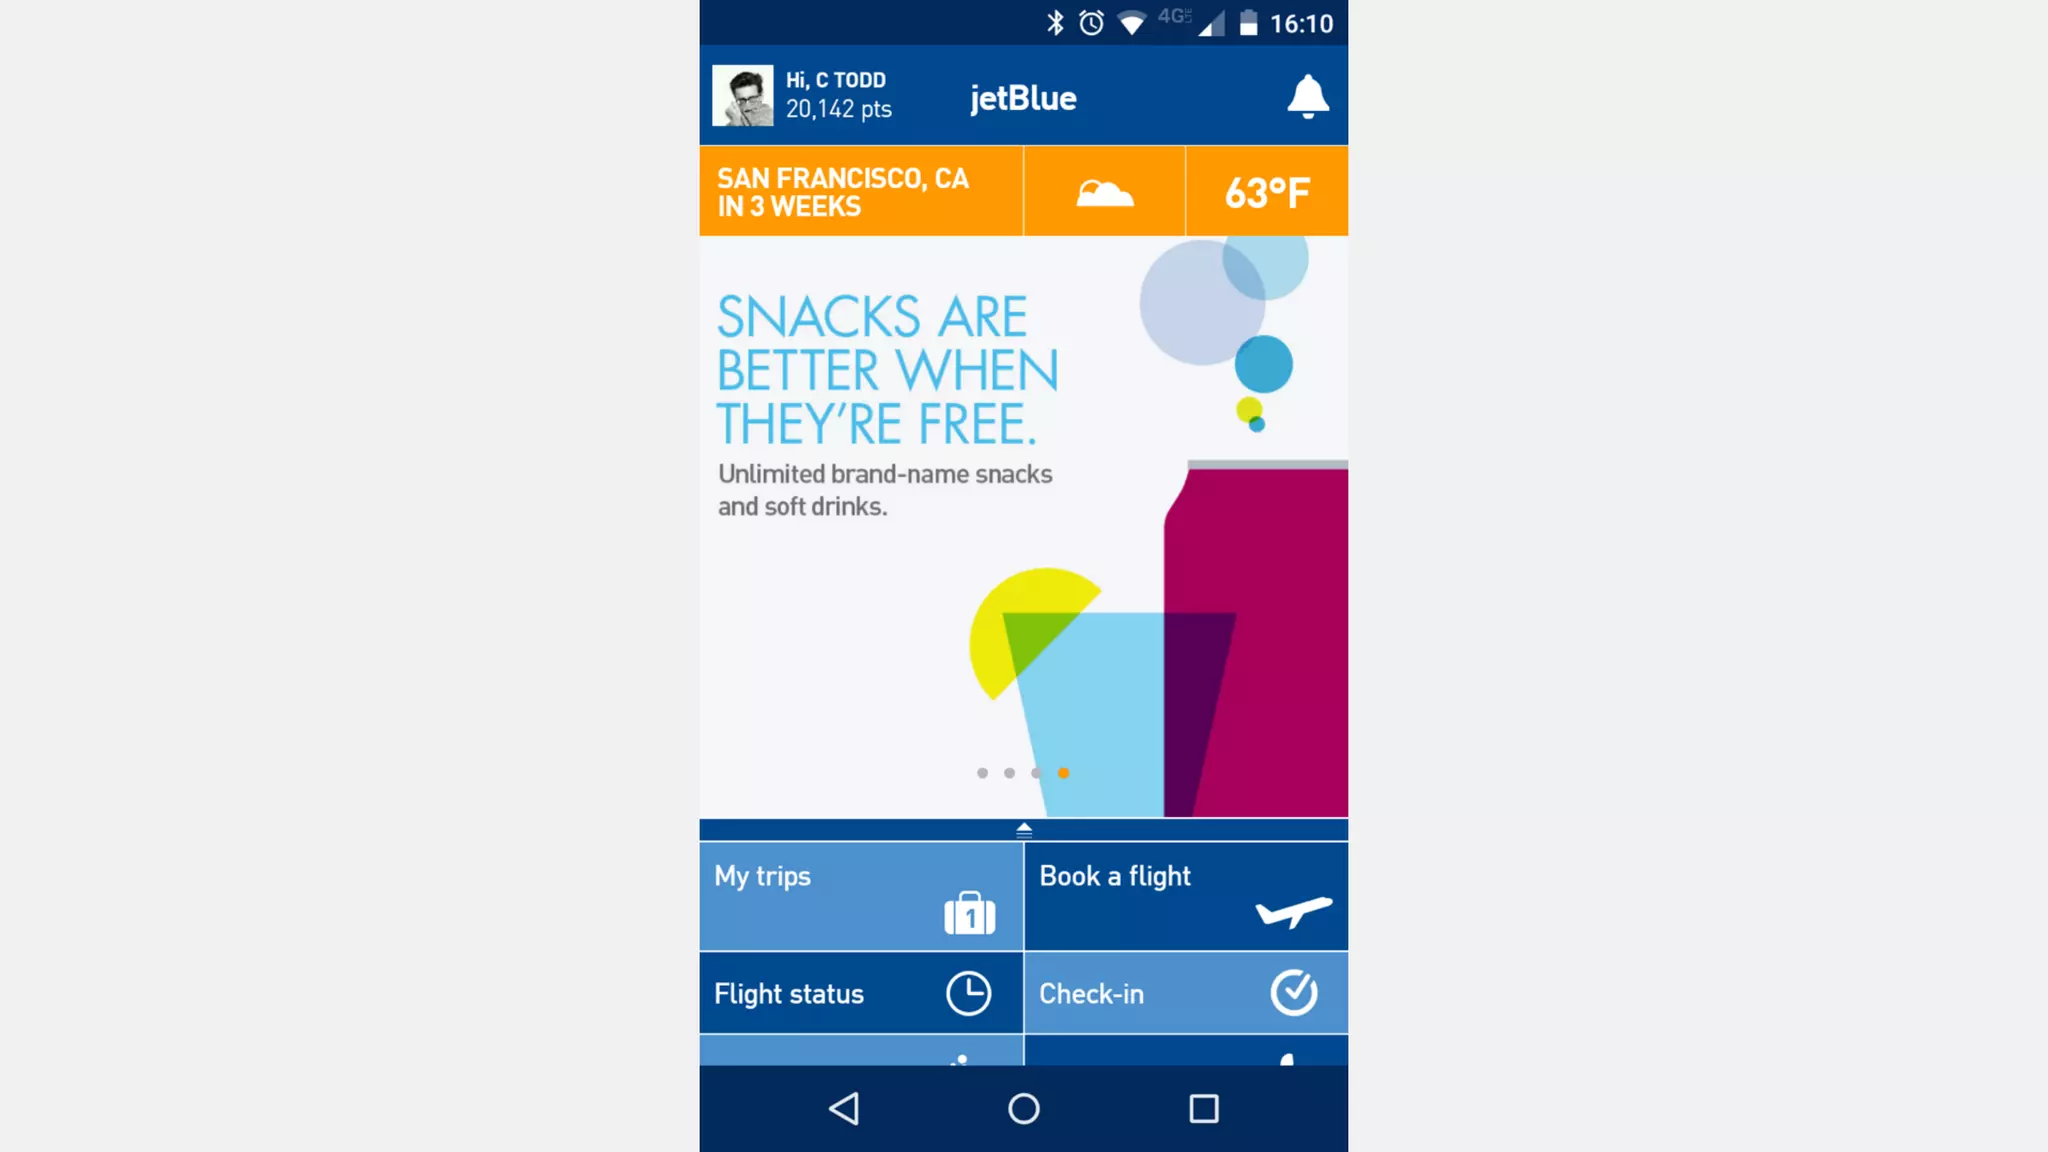
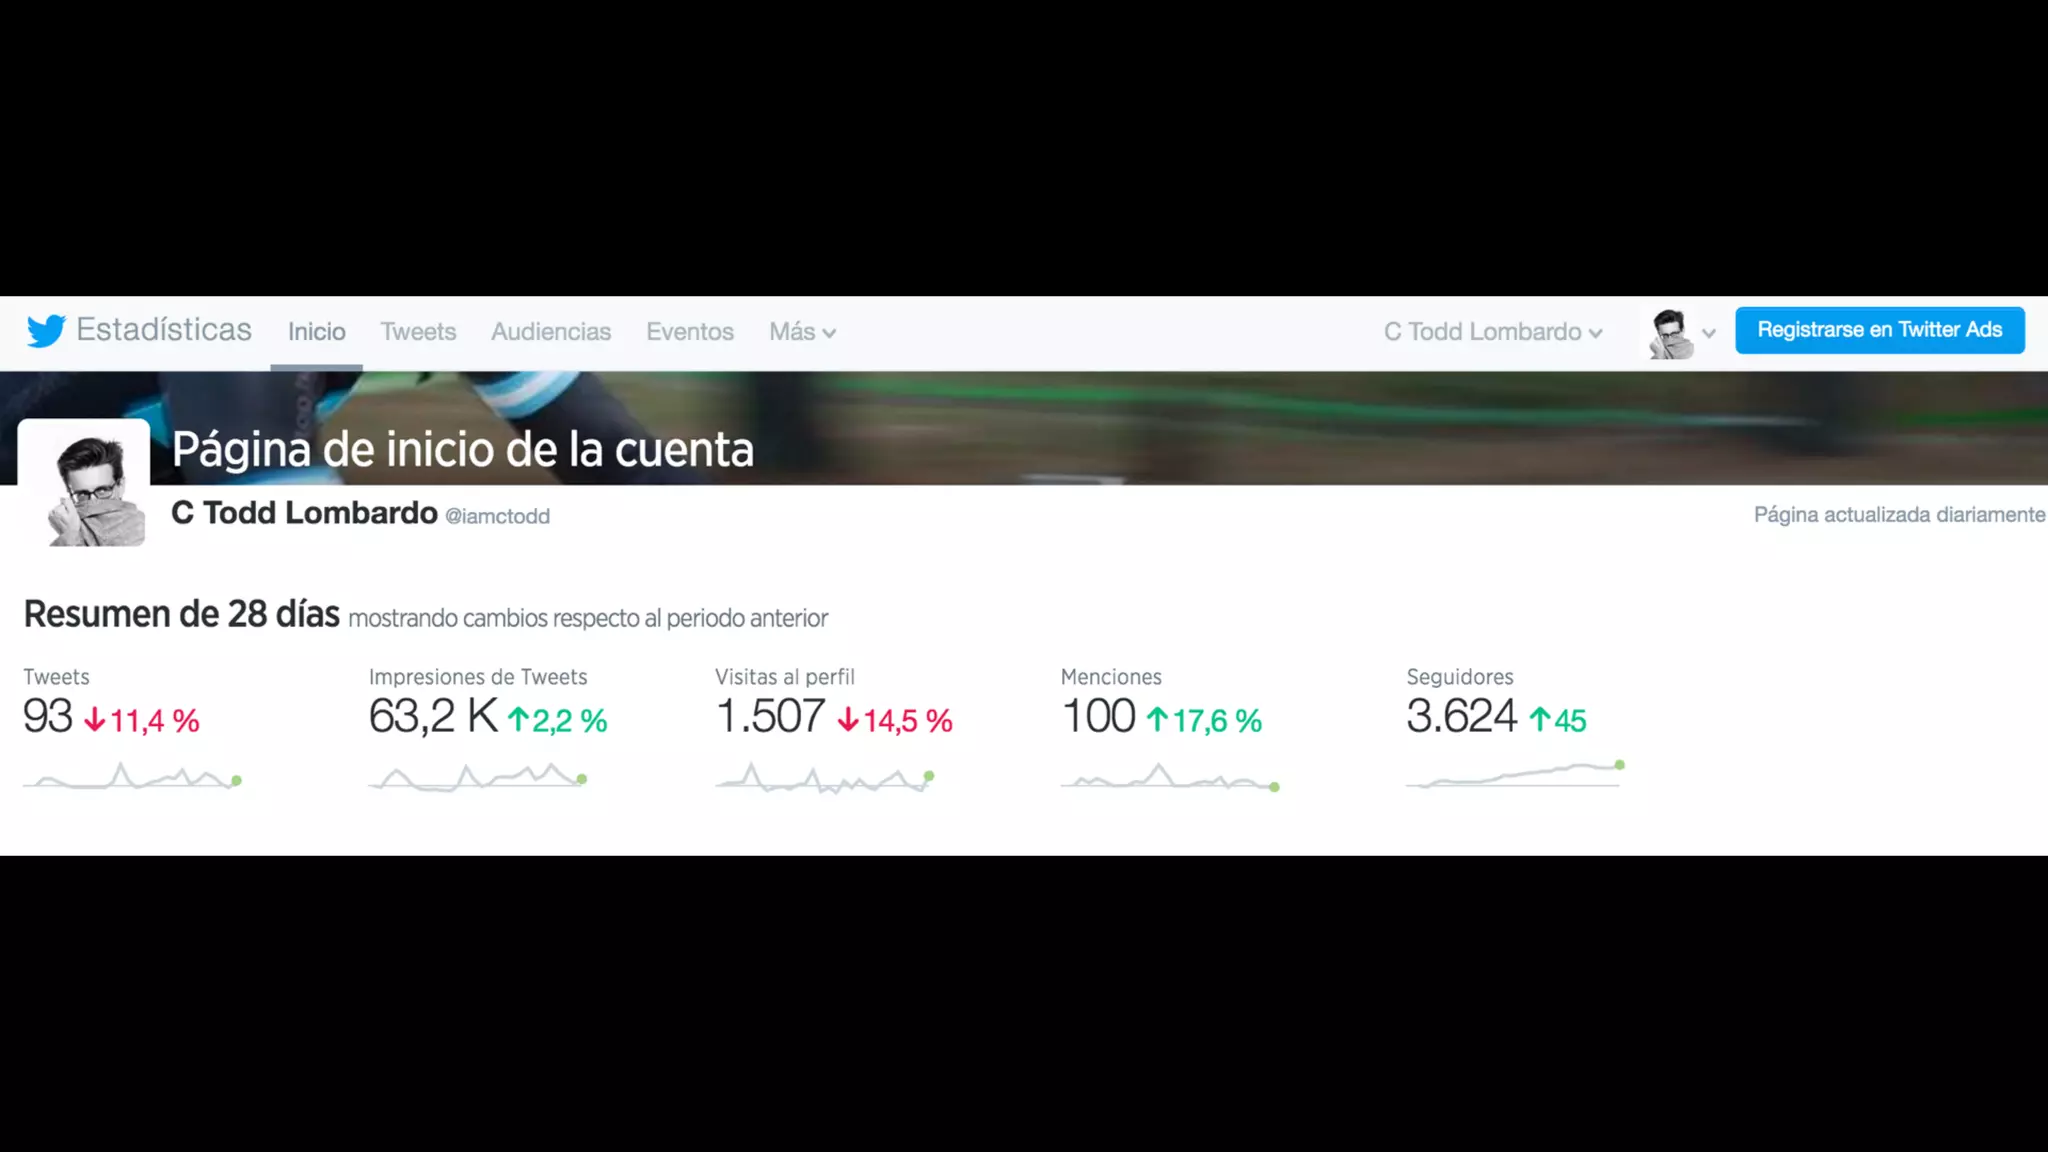
• How long does it take for your audience to arrive at your conclusion?
• Is the message delivered accurately & consistently?
• [Interactive] How many clicks to find the answer to their question?
• Where do they go in your app next?](https://image.slidesharecdn.com/xbt0kdbxqcuufxmxvojb-signature-93eb61c1365aa971a39342929613c8391713e554370492cc88eb063cf40320df-poli-160418010042/75/Data-Visualizations-in-Digital-Products-ProductCamp-Boston-2016-76-2048.jpg)


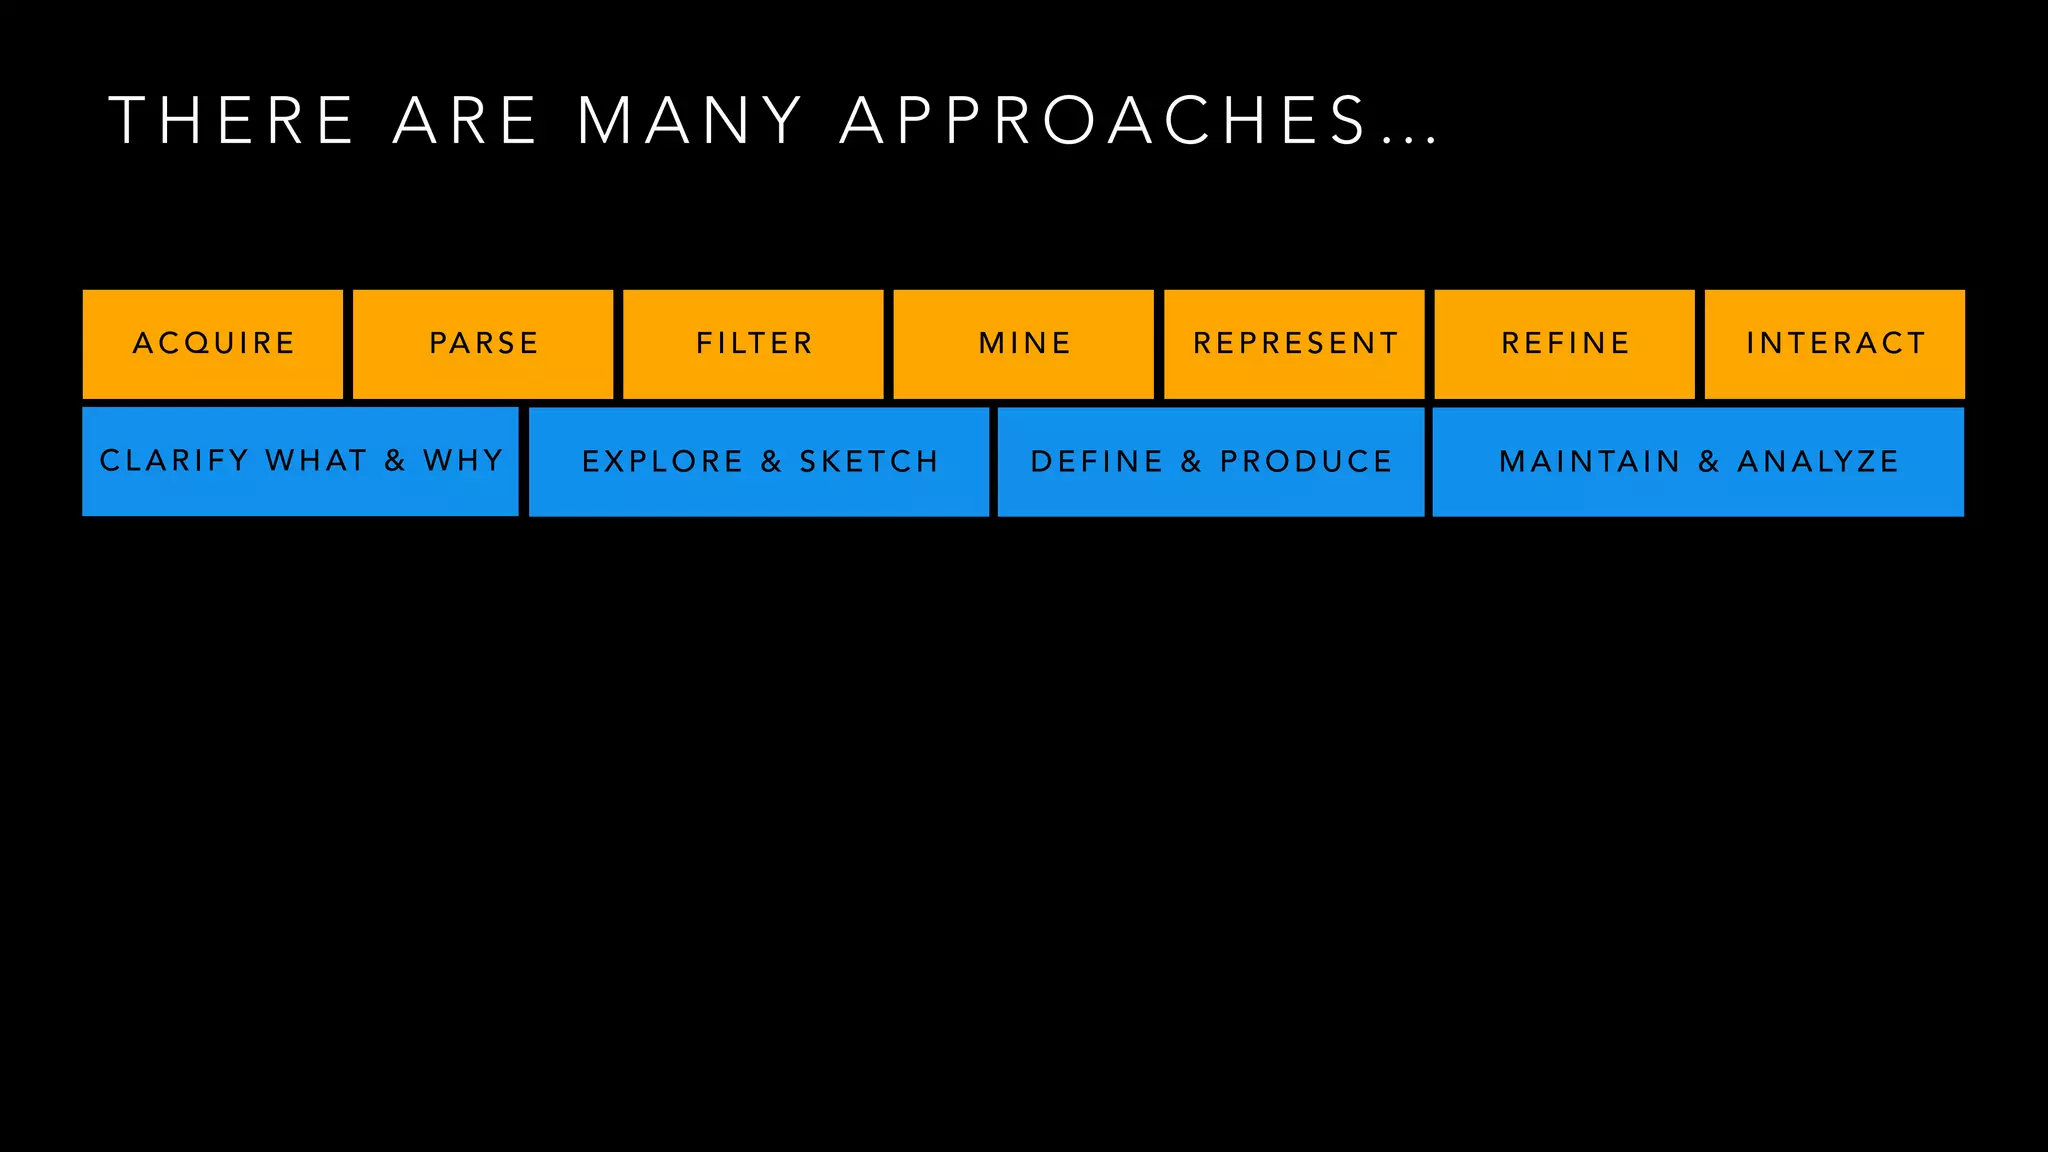
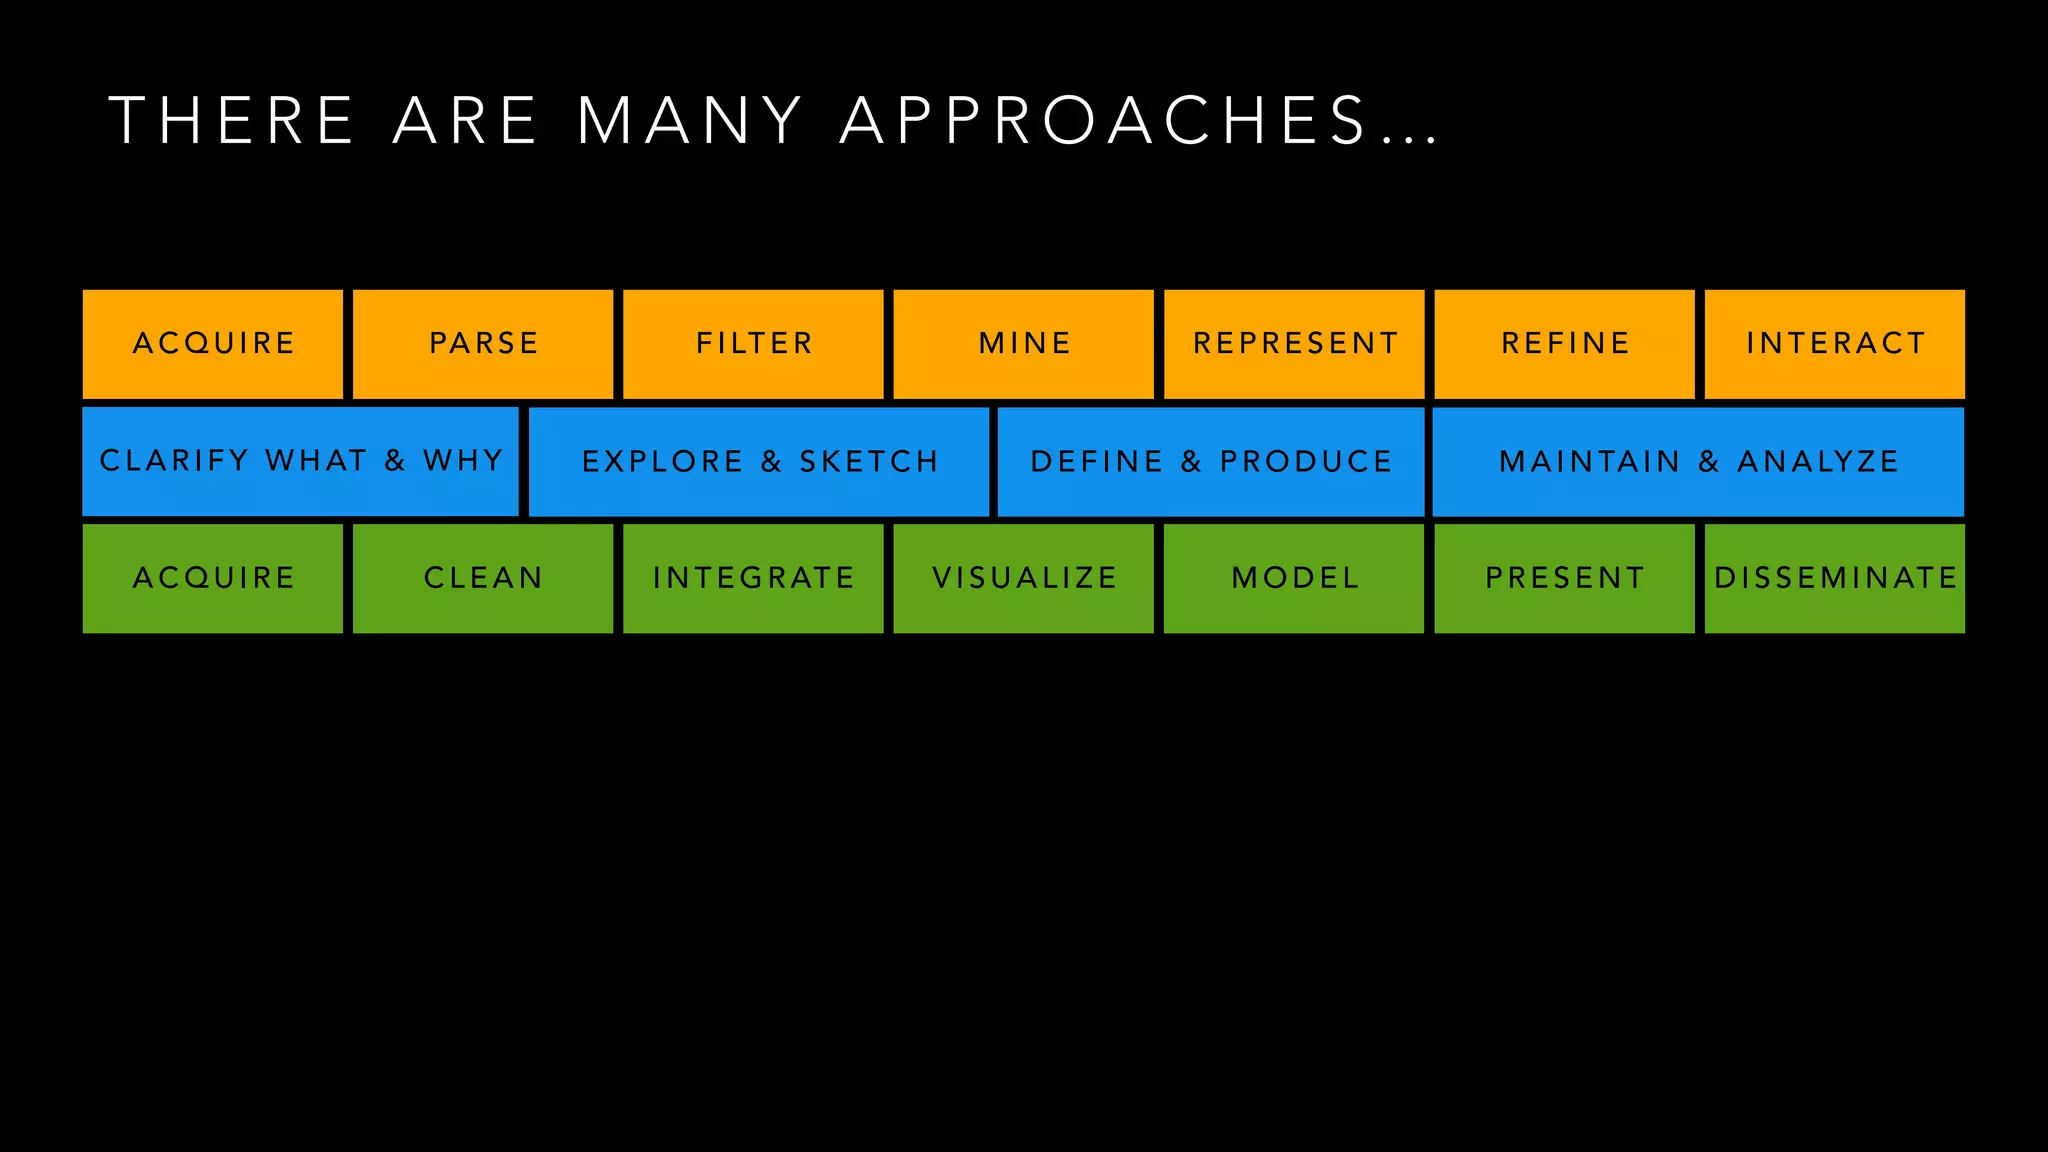
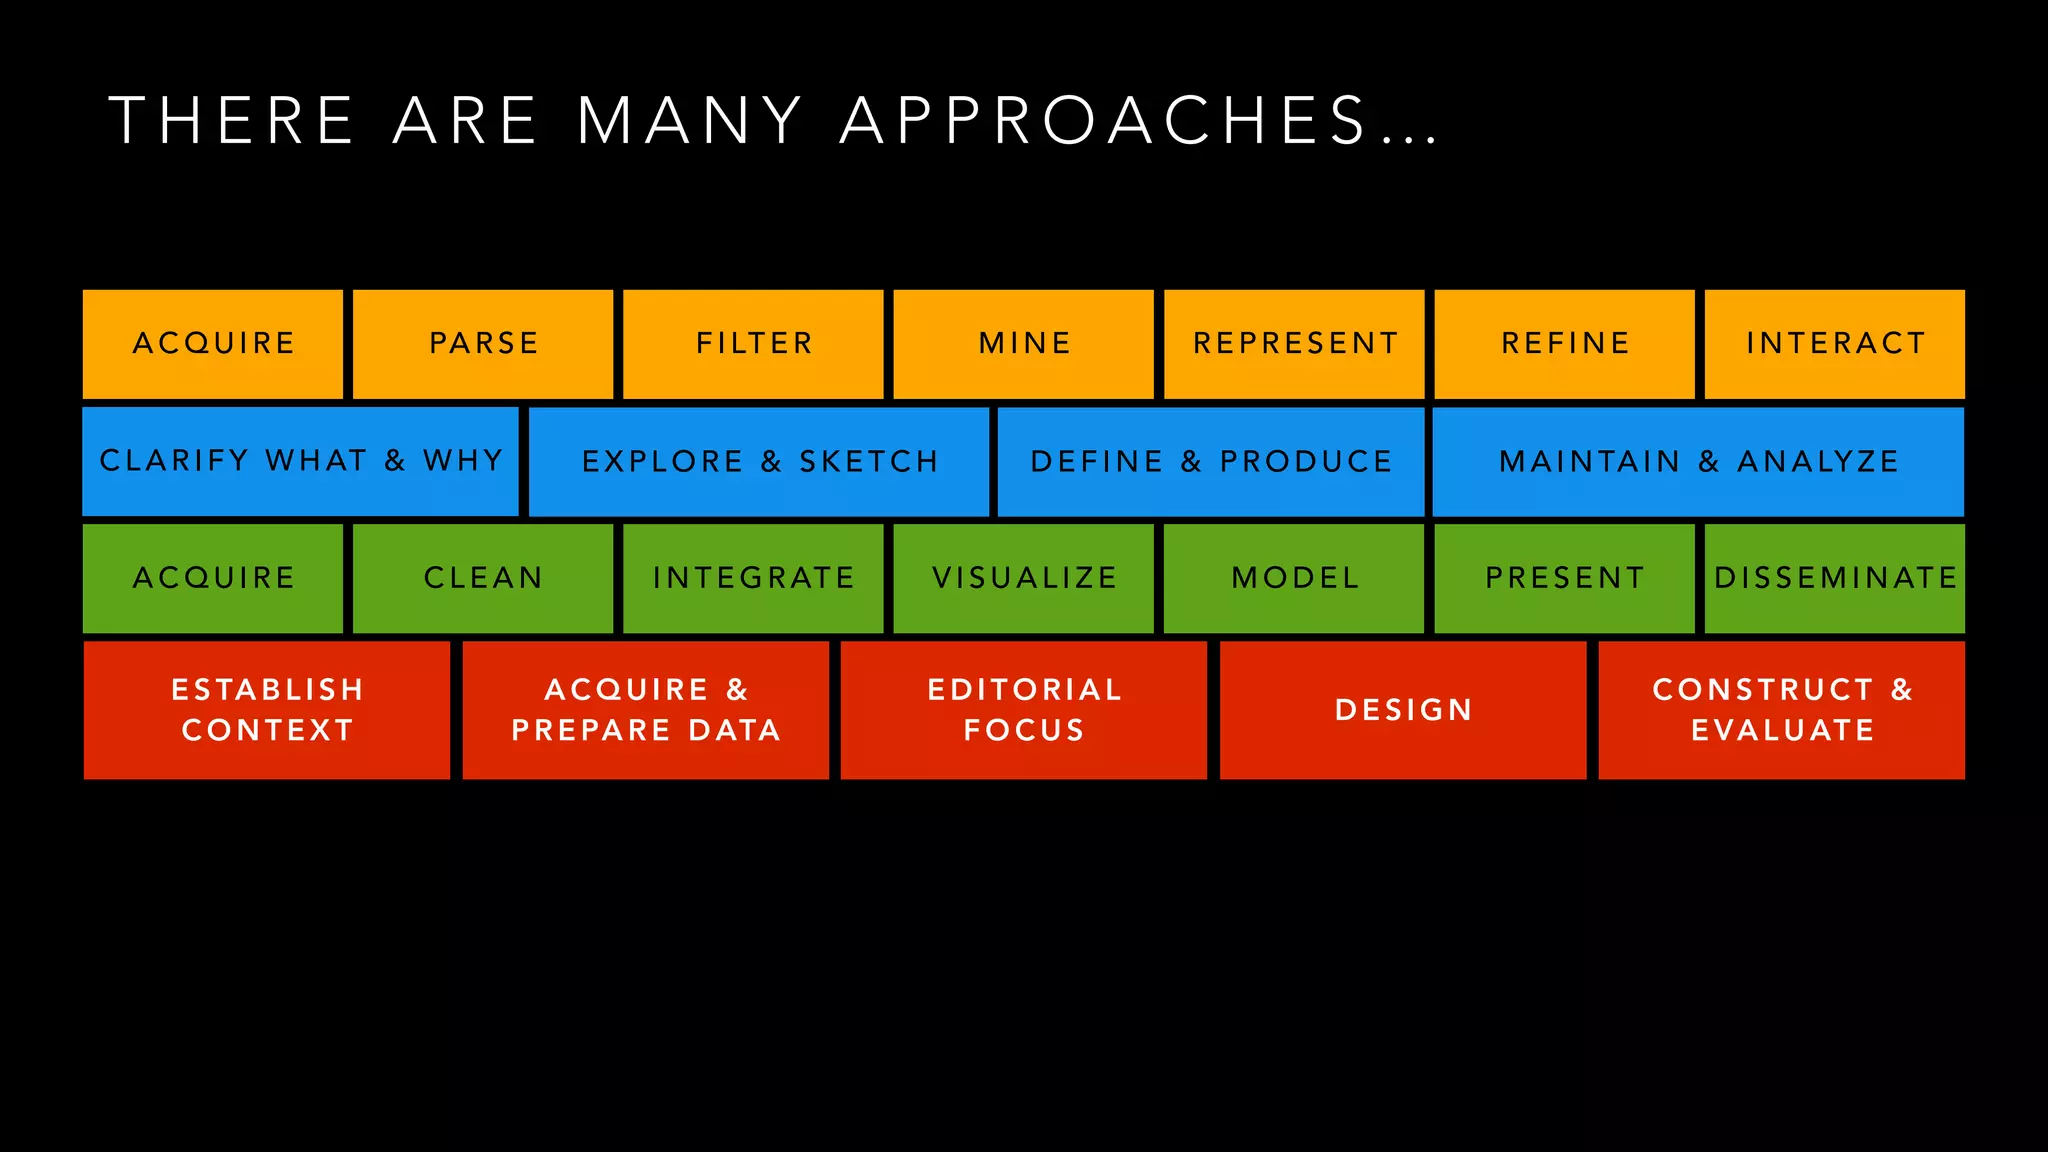
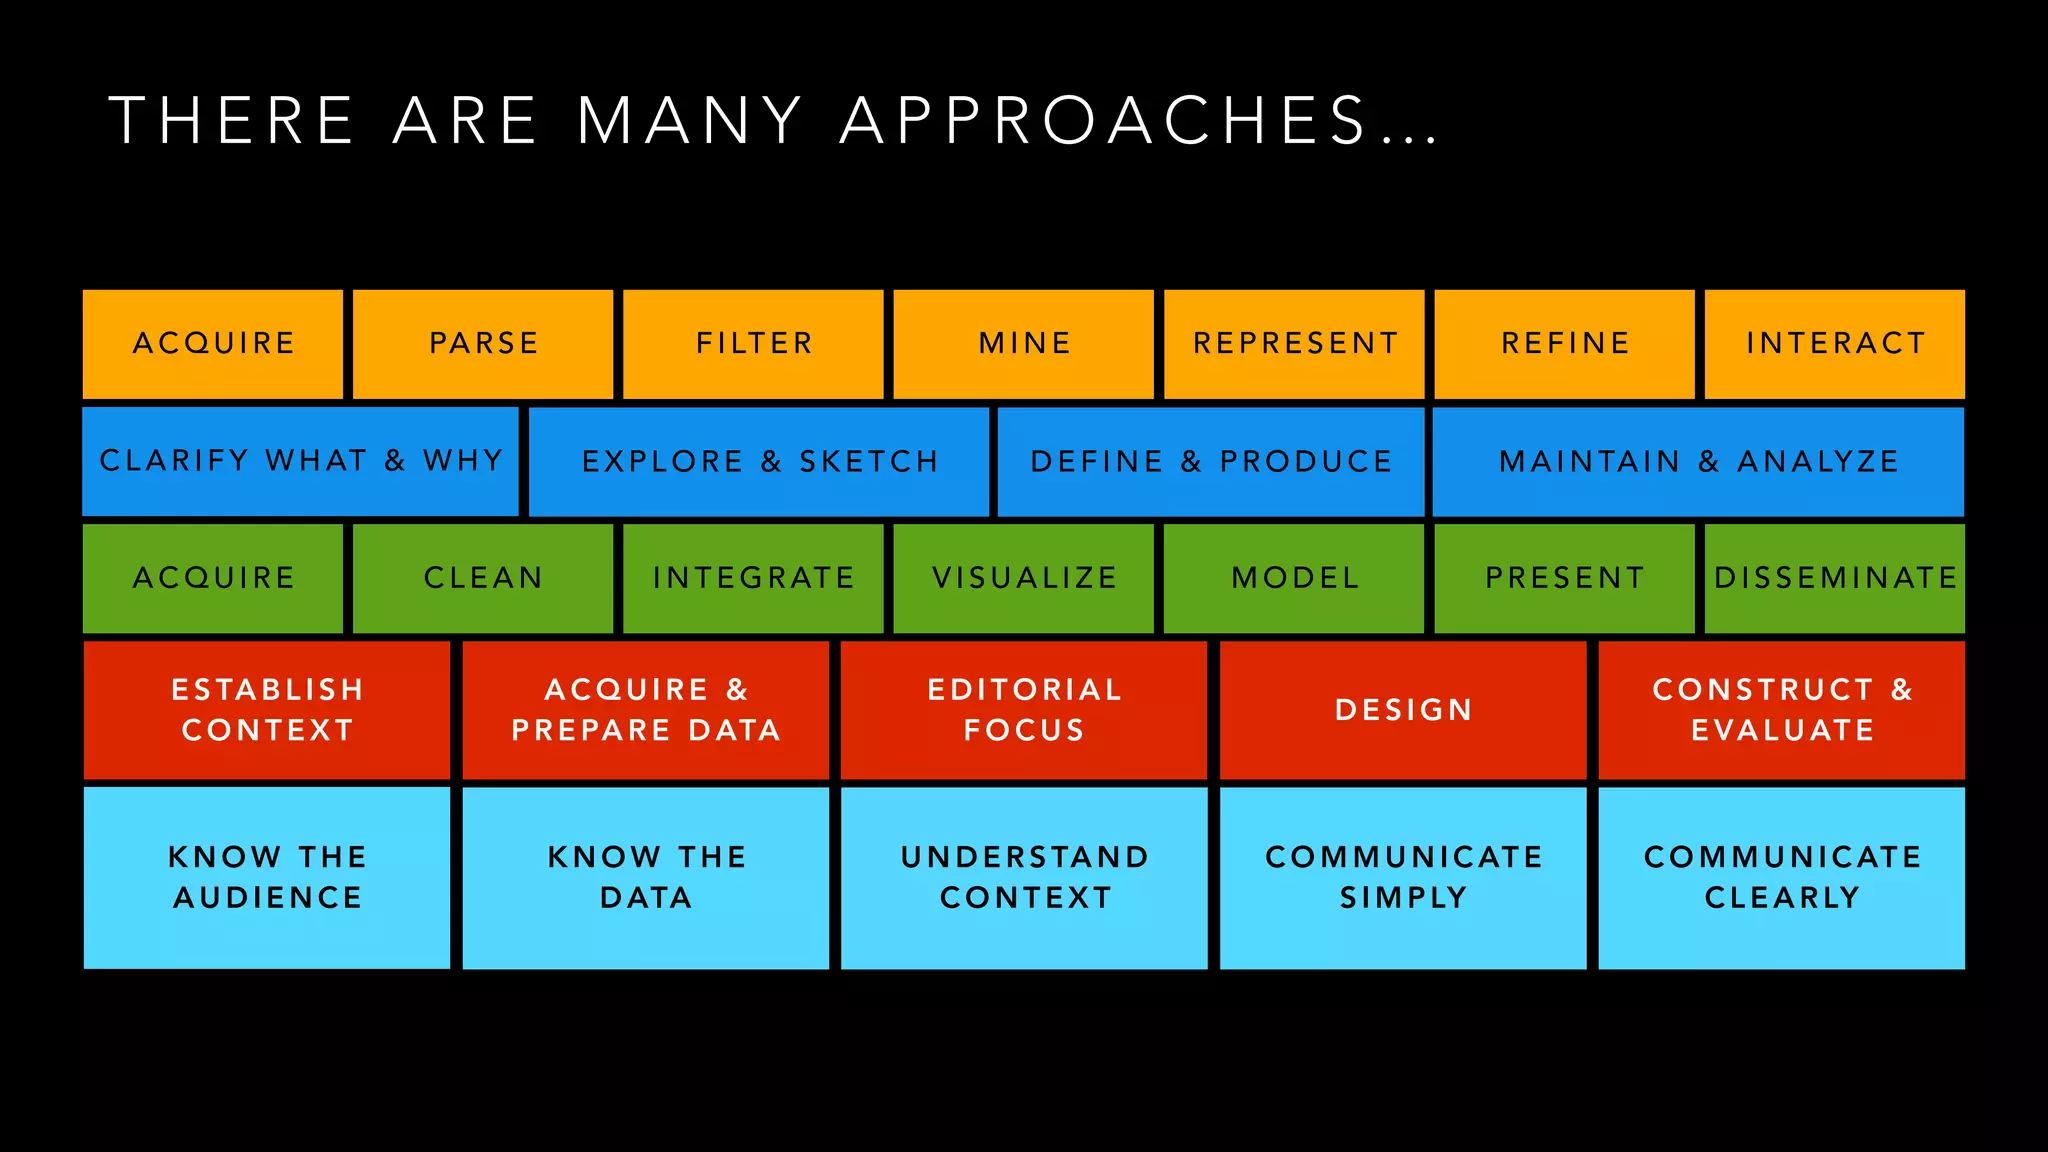
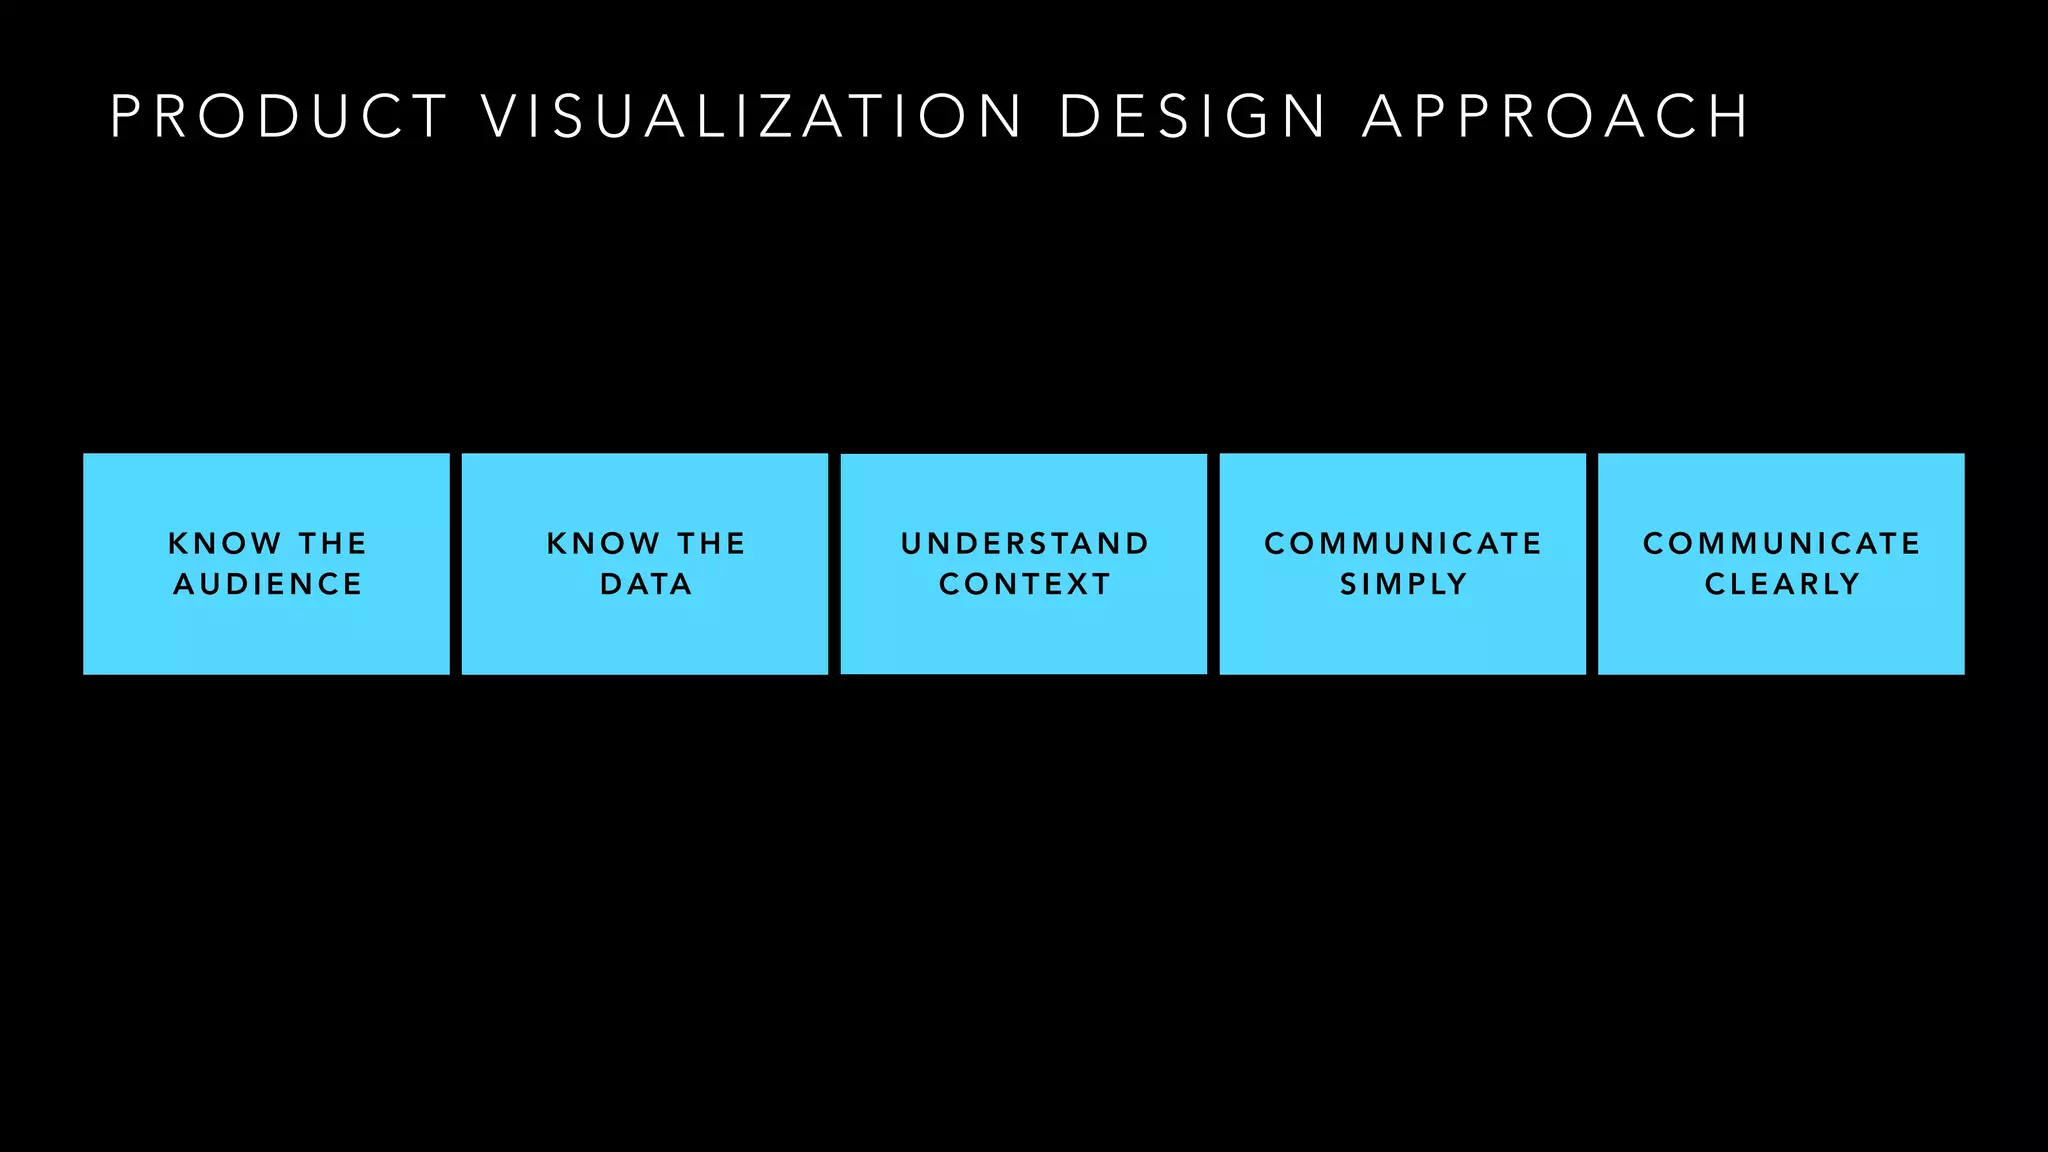
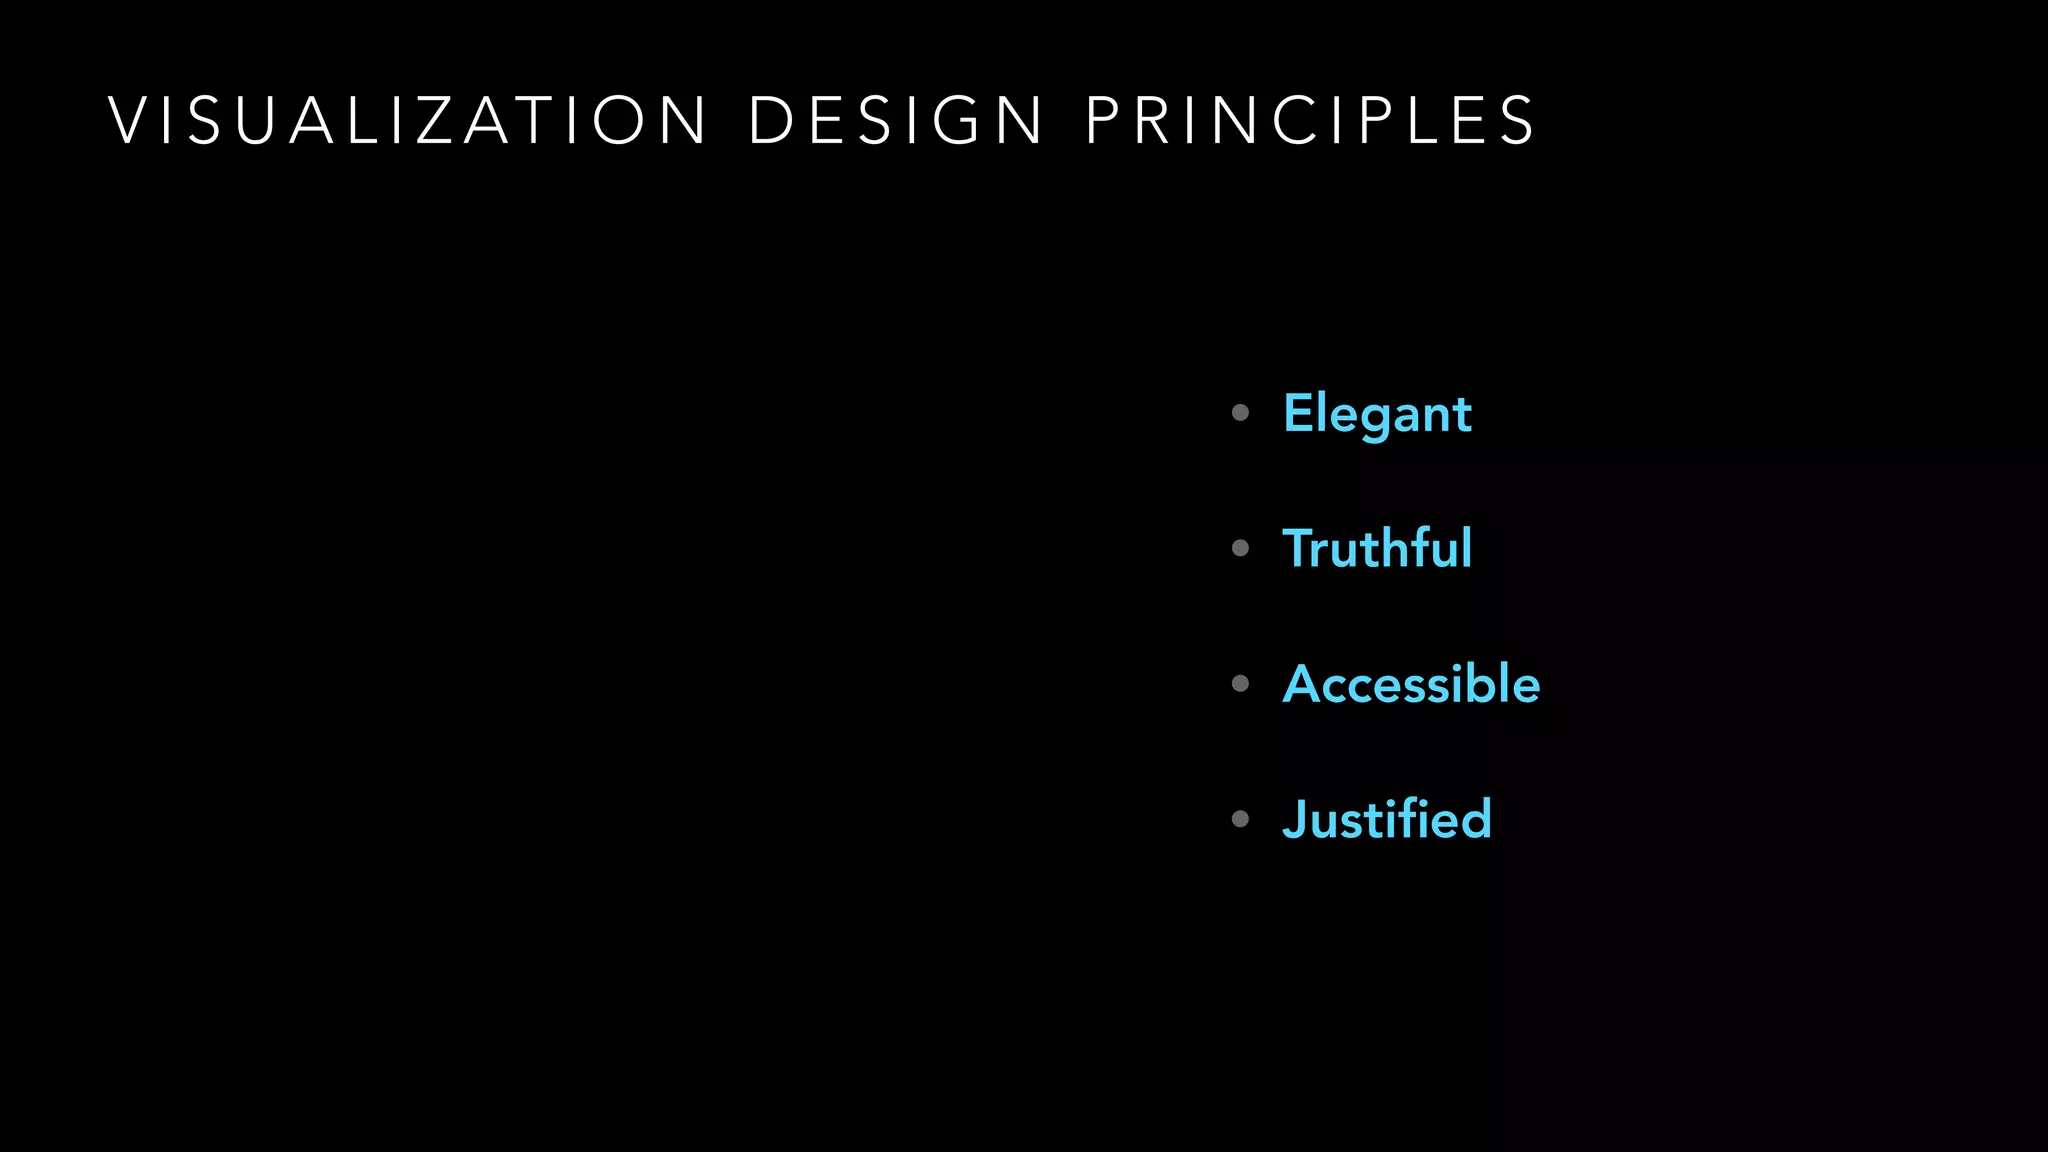
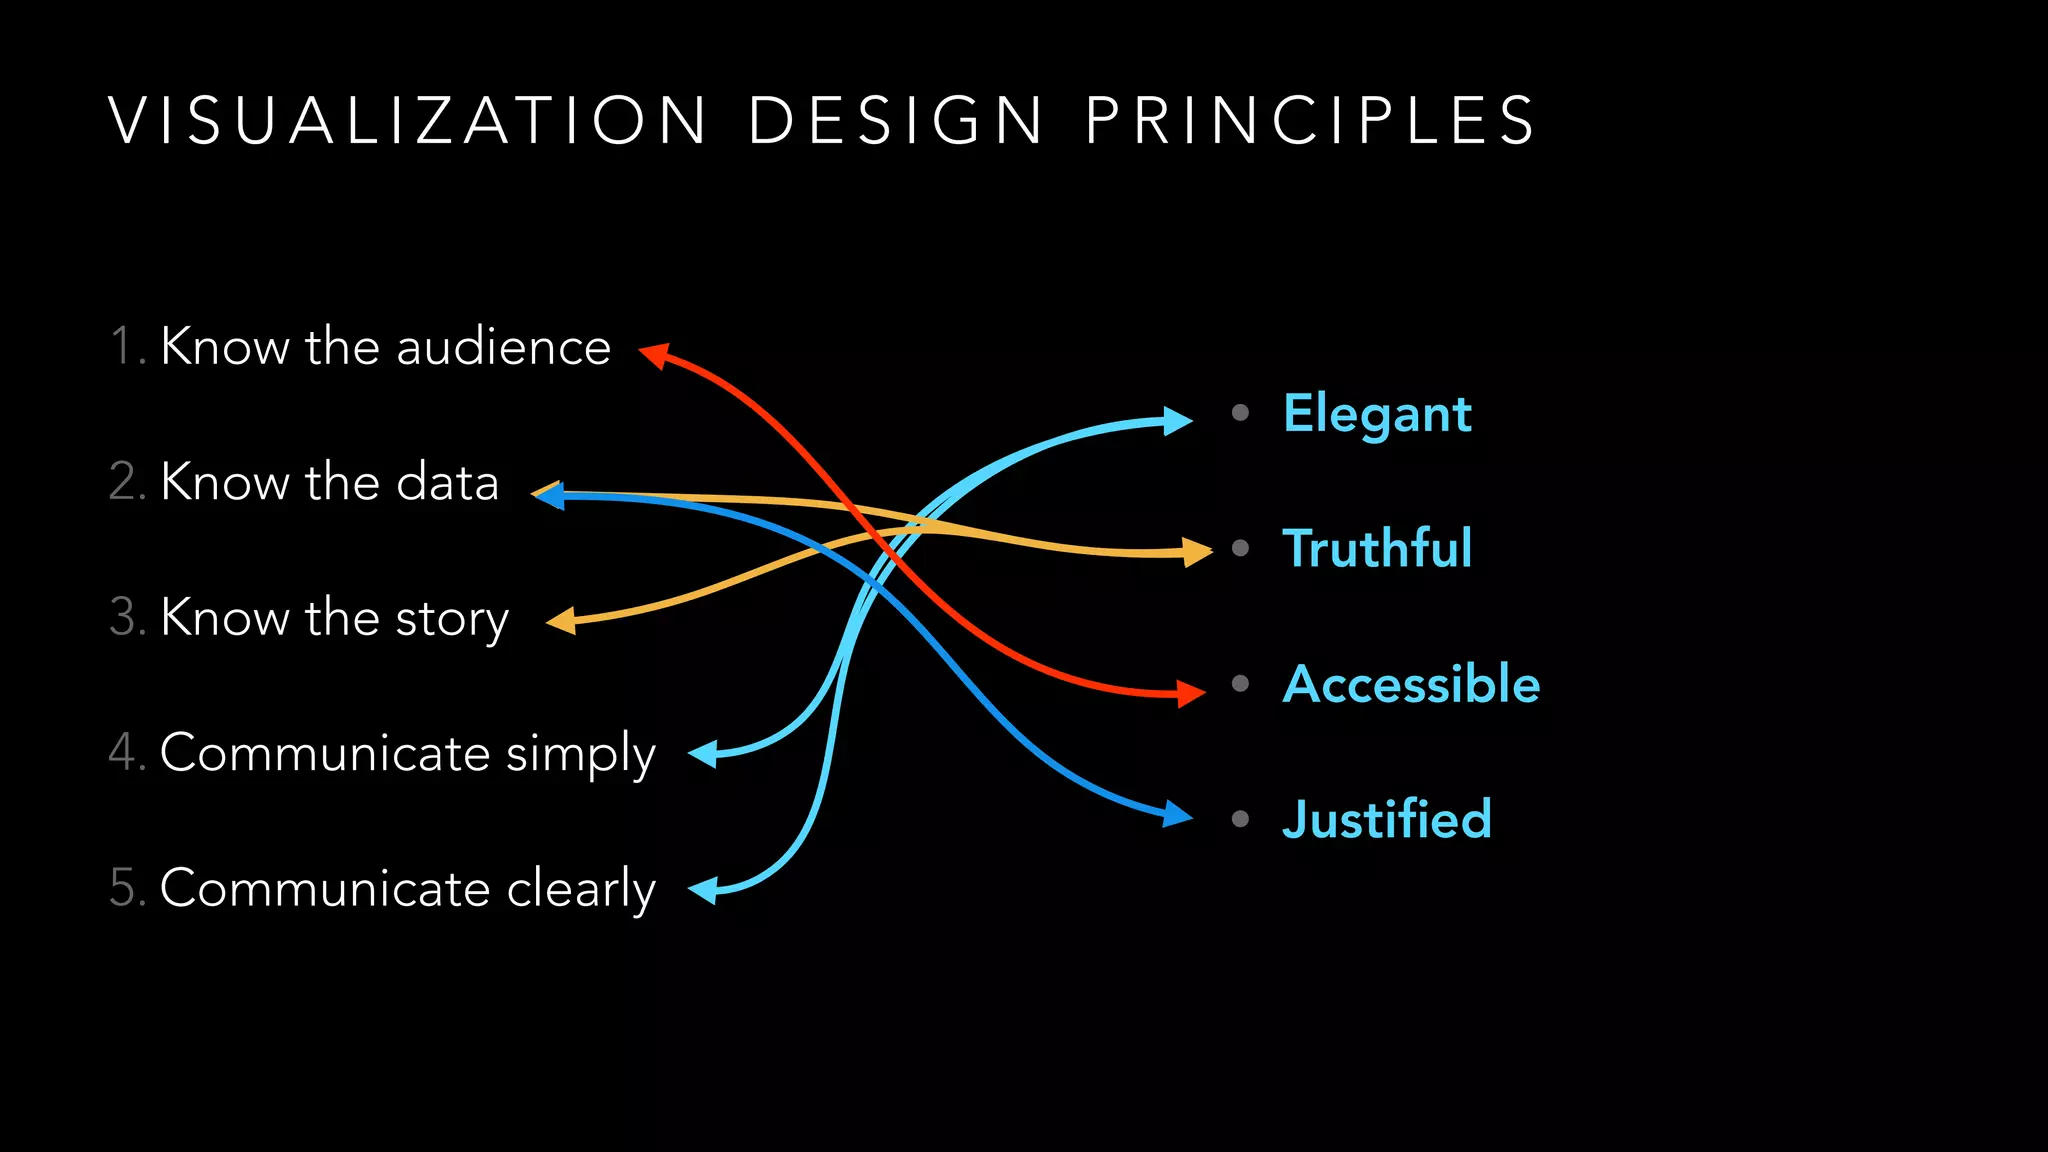
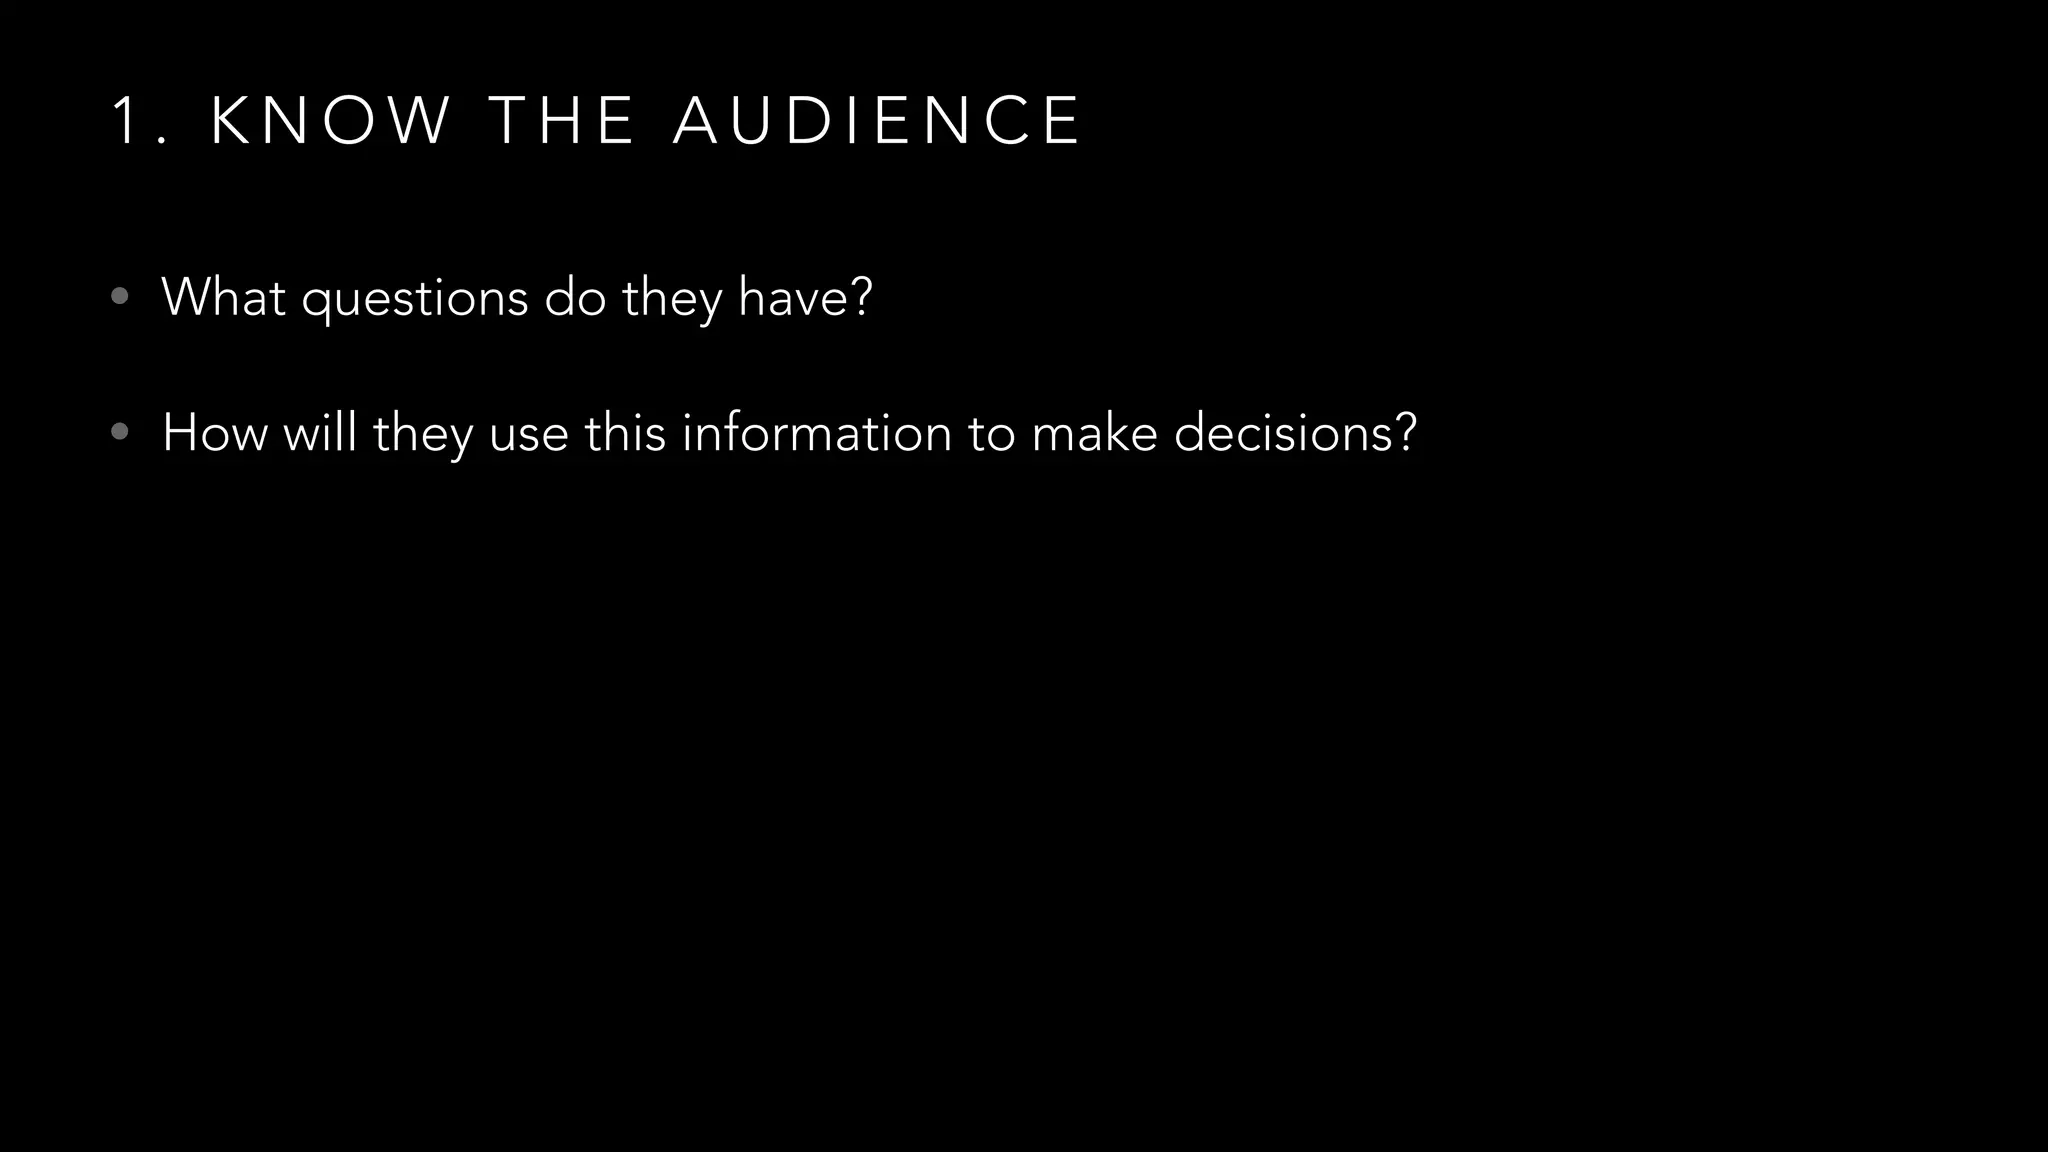
The document discusses various approaches and principles of data visualization in product design, emphasizing understanding the audience, data quality, context, and clear communication. It outlines steps to effectively present data, ensuring accessibility and engagement. Key principles highlighted include knowing the audience, understanding data context, and simplifying communication.