This document discusses data visualization in Python and Django. It introduces common data visualization libraries like Matplotlib. It then covers the steps for gathering and preprocessing data from sources like CSV files and databases. Various types of visual representations are described, and factors for choosing visualizations like whether they are server-based or client-based are addressed. Examples of real-time and batch-based visualization are provided in the appendices along with code samples.


![Appendix 1
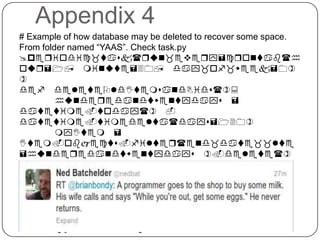
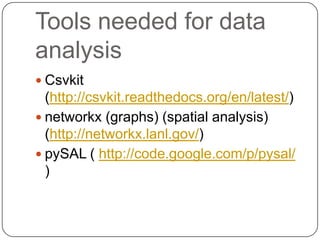
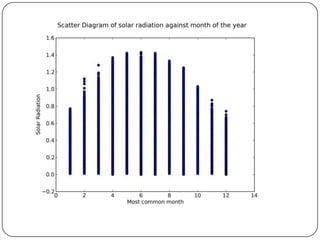
## This describes a scatter plot of solar radiation against the month.
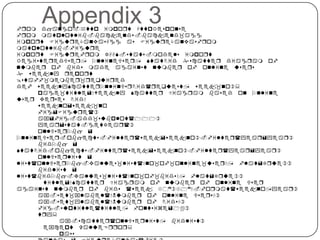
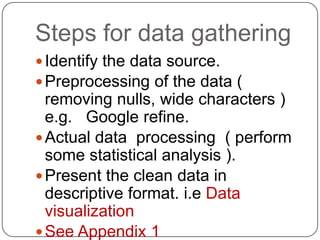
This aim to describe the steps of data gathering.CSV file from data science
hackathon website. The source code is available in a folder named
“plotCode”
impoqv cuv
fqom
mavplovlib.backendu.backend_agg
impoqv FigtqeCanvauAgg au FigtqeCanvau
fqom mavplovlib.figtqe impoqv Figtqe
def
pqepaqeLiuv(monvh_mouv_common_liuv):
''' Pqepaqe vhe inptv foq pqoceuu by
qemoving all tnneceuuaqy valteu.
Replace "NA" sivh 0''
otvptv_liuv = []
foq x in monvh_mouv_common_liuv:
if x != 'NA':
otvptv_liuv.append(x)](https://image.slidesharecdn.com/datavisualization-121023094445-phpapp02/85/Data-visualization-by-Kenneth-Odoh-15-320.jpg)
![Appendix 1 contd.
def plovSolaqRadiavionAgainuvMonvh(filename):
vqainRosReadeq =
cuv.qeadeq(open(filename, 'qb'), delimiveq=',')
monvh_mouv_common_liuv = []
Solaq_qadiavion_64_liuv = []
foq qos in vqainRosReadeq:
monvh_mouv_common = qos[3]
Solaq_qadiavion_64 = qos[6]
monvh_mouv_common_liuv.append(monvh_mouv_common)
Solaq_qadiavion_64_liuv.append(Solaq_qadiavion_6
4)
#conveqv all elemenvu in vhe liuv vo floav
shile ukipping vhe fiquv elemenv foq vhe 1uv
elemenv iu a deucqipvion of vhe field.
monvh_mouv_common_liuv = [floav(i) foq i in
pqepaqeLiuv(monvh_mouv_common_liuv)[1:] ]
Solaq_qadiavion_64_liuv = [floav(i) foq i in
pqepaqeLiuv(Solaq_qadiavion_64_liuv)[1:] ]
fig=Figtqe()
ax=fig.add_utbplov(111)
vivle='Scavveq Diagqam of uolaq qadiavion
againuv monvh of vhe yeaq'
ax.uev_xlabel('Mouv common monvh')
ax.uev_ylabel('Solaq Radiavion')
fig.utpvivle(vivle, fonvuize=14)
vqy:](https://image.slidesharecdn.com/datavisualization-121023094445-phpapp02/85/Data-visualization-by-Kenneth-Odoh-16-320.jpg)
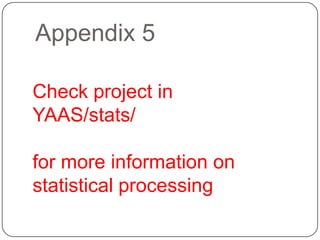
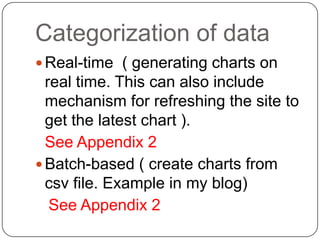
![Appendix 2
Fqom vhe pqojecv in foldeq
named WebMonivoq
clauu LoadEvenv:
def fillMonivoqModel(uelf):
foq monObj in
uelf.monivoqObjLiuv:
mObj =
Monivoq(tql =
monObj[2], hvvpSvavtu =
monObj[0], qeuponueTime =
monObj[1], convenvSvavtu =
monObj[5])](https://image.slidesharecdn.com/datavisualization-121023094445-phpapp02/85/Data-visualization-by-Kenneth-Odoh-18-320.jpg)