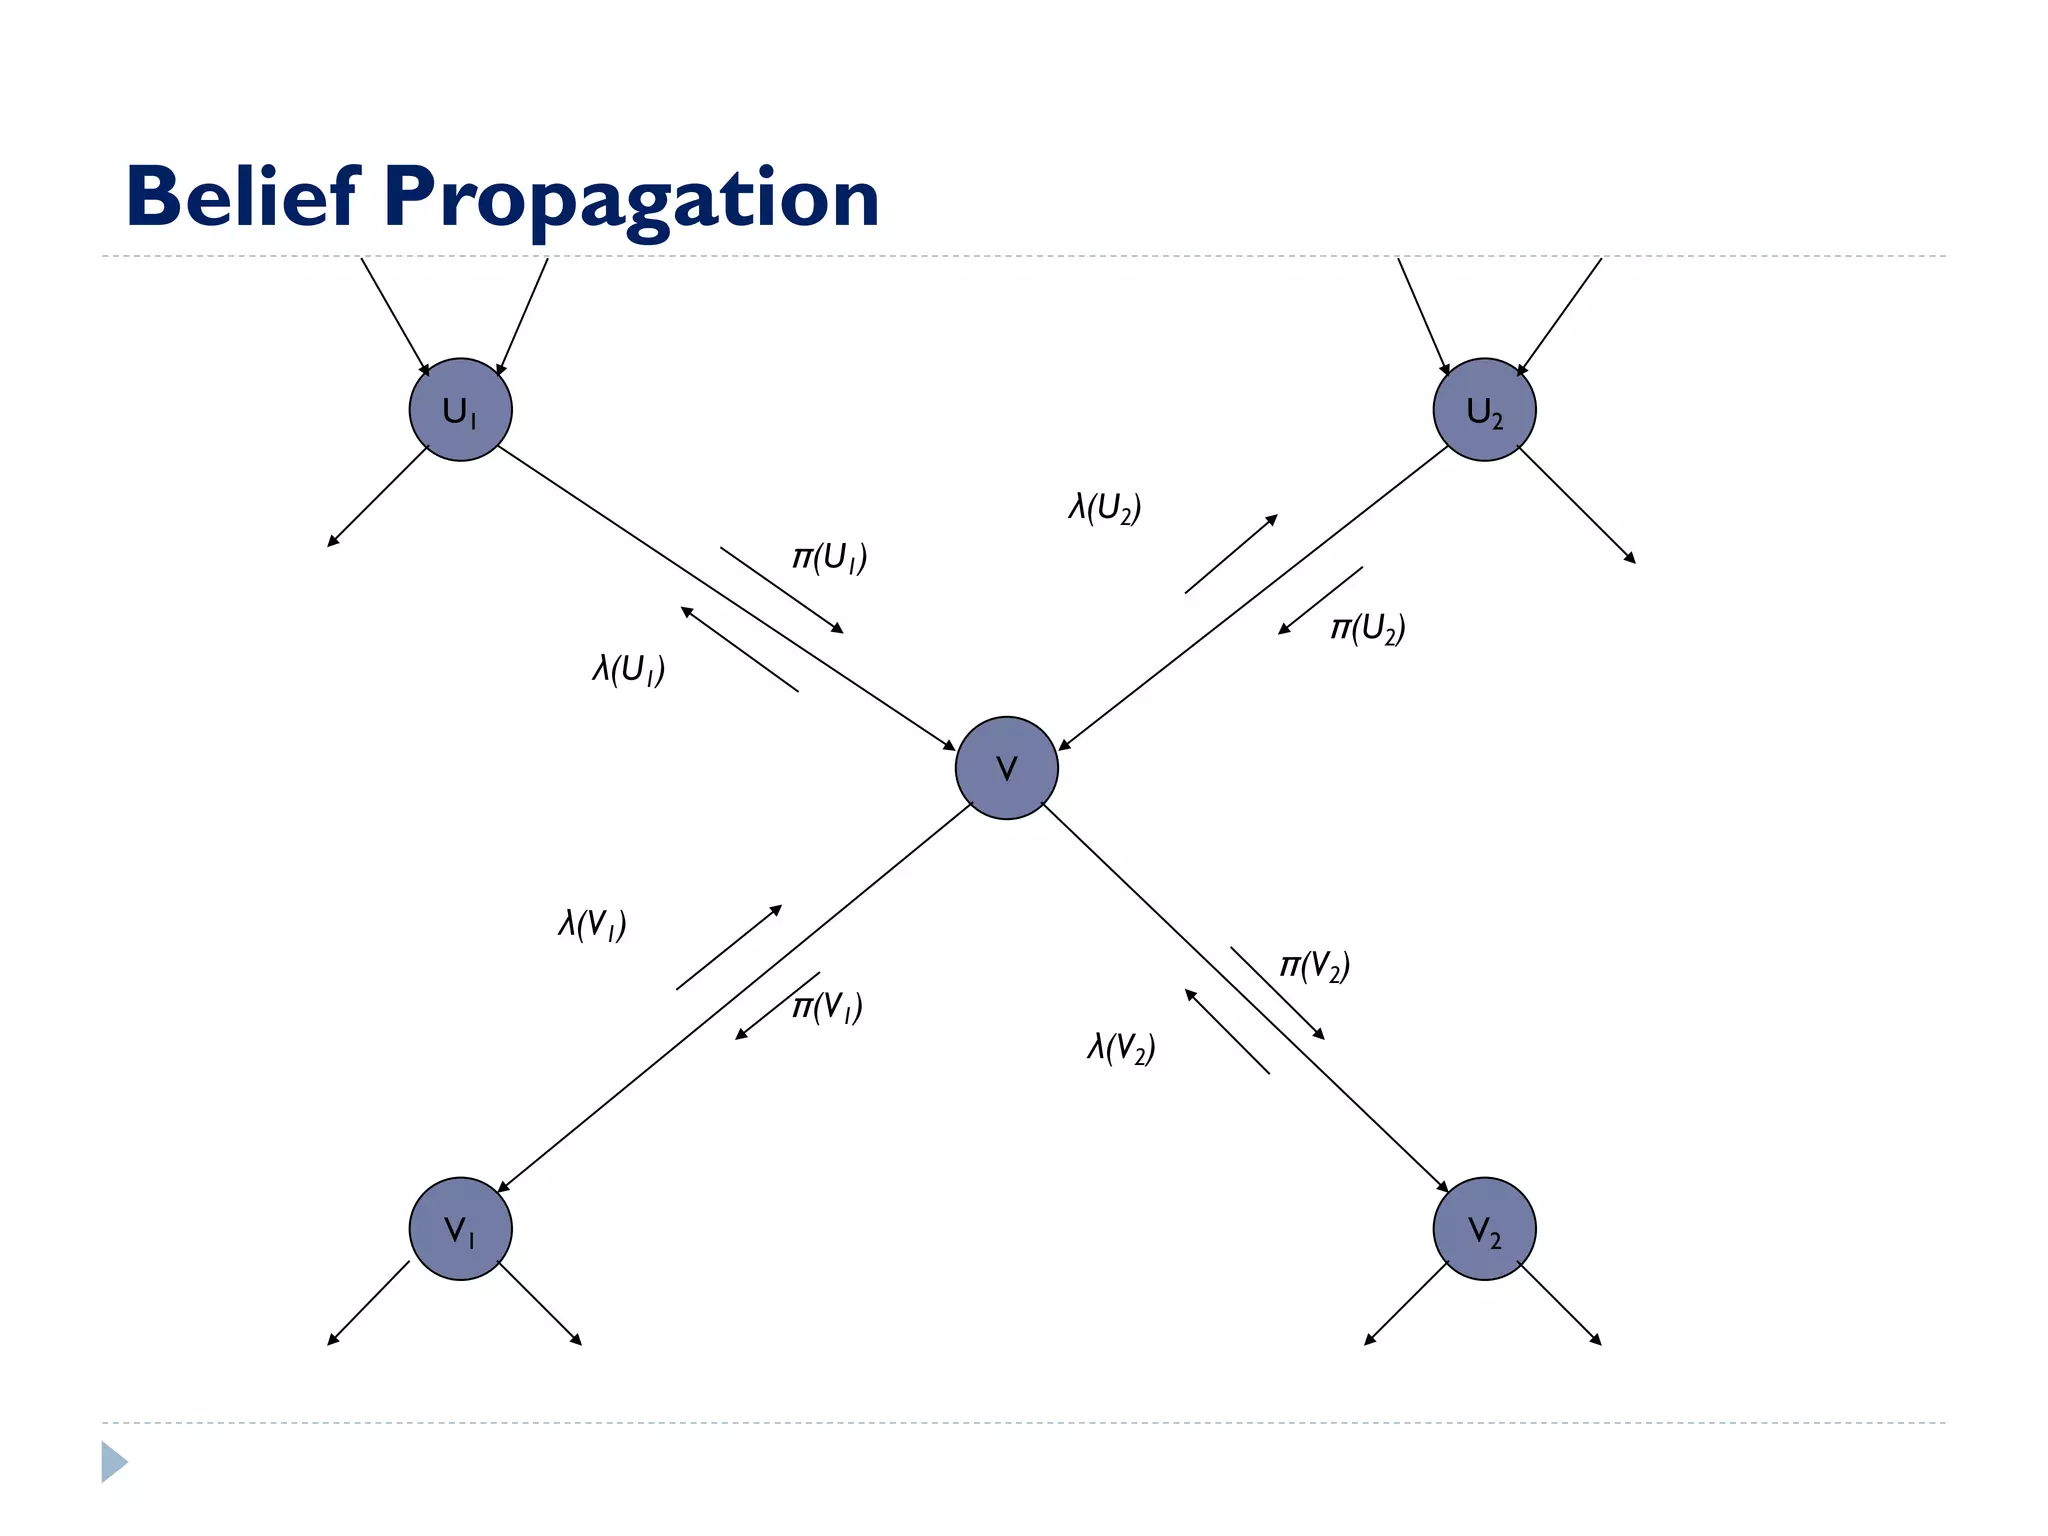
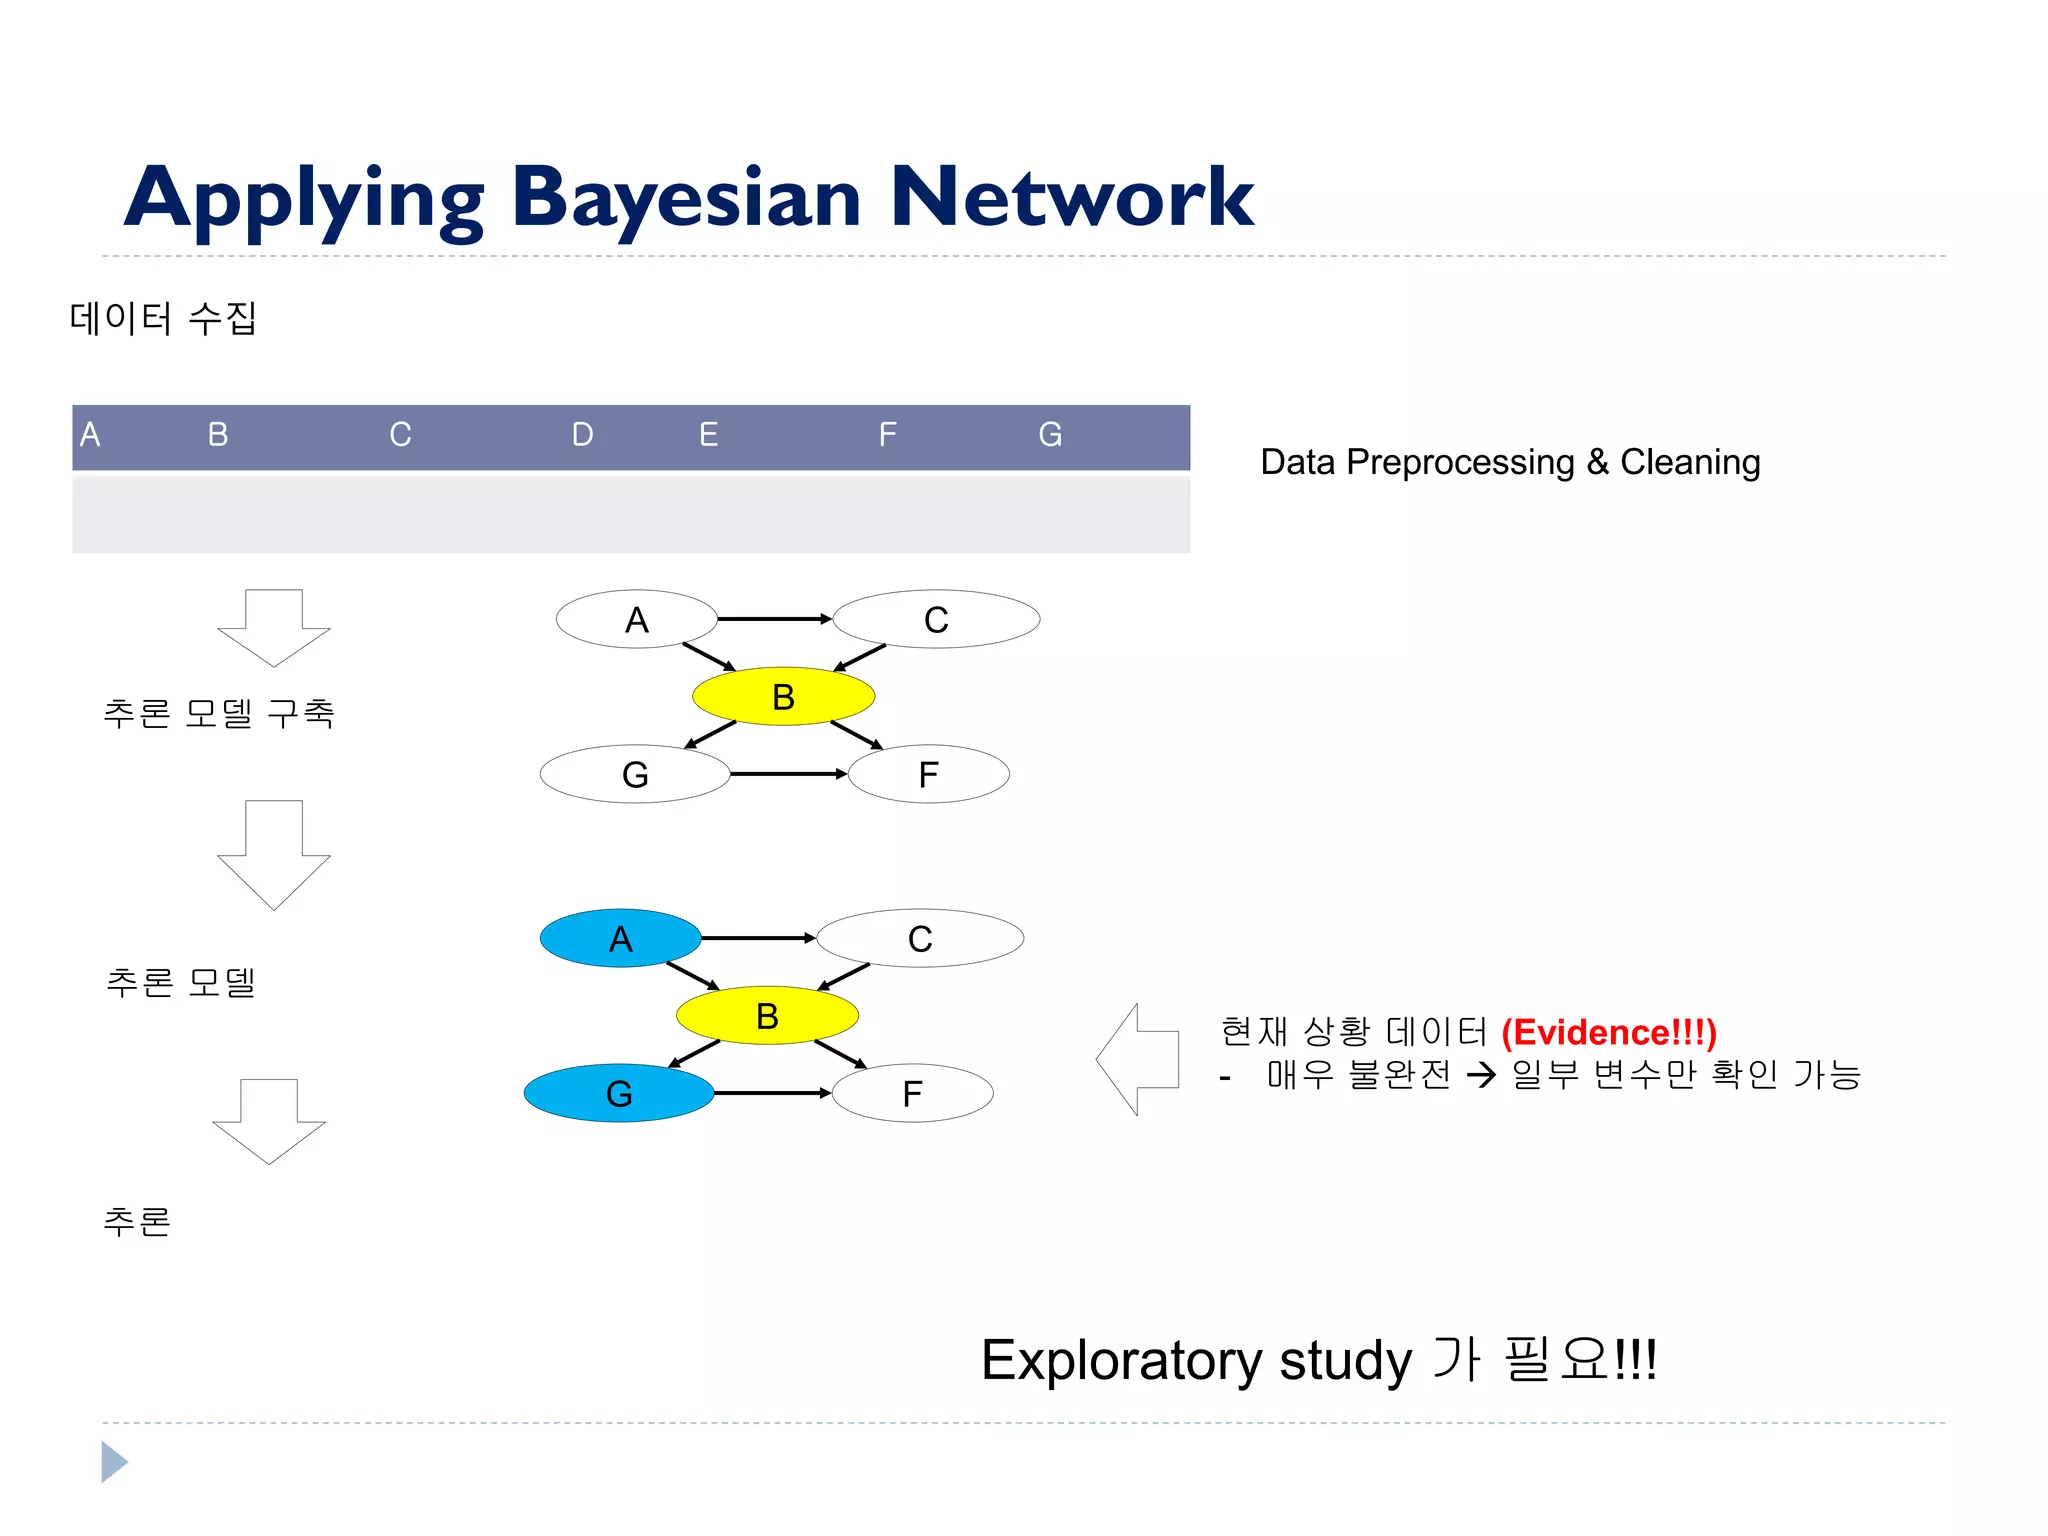
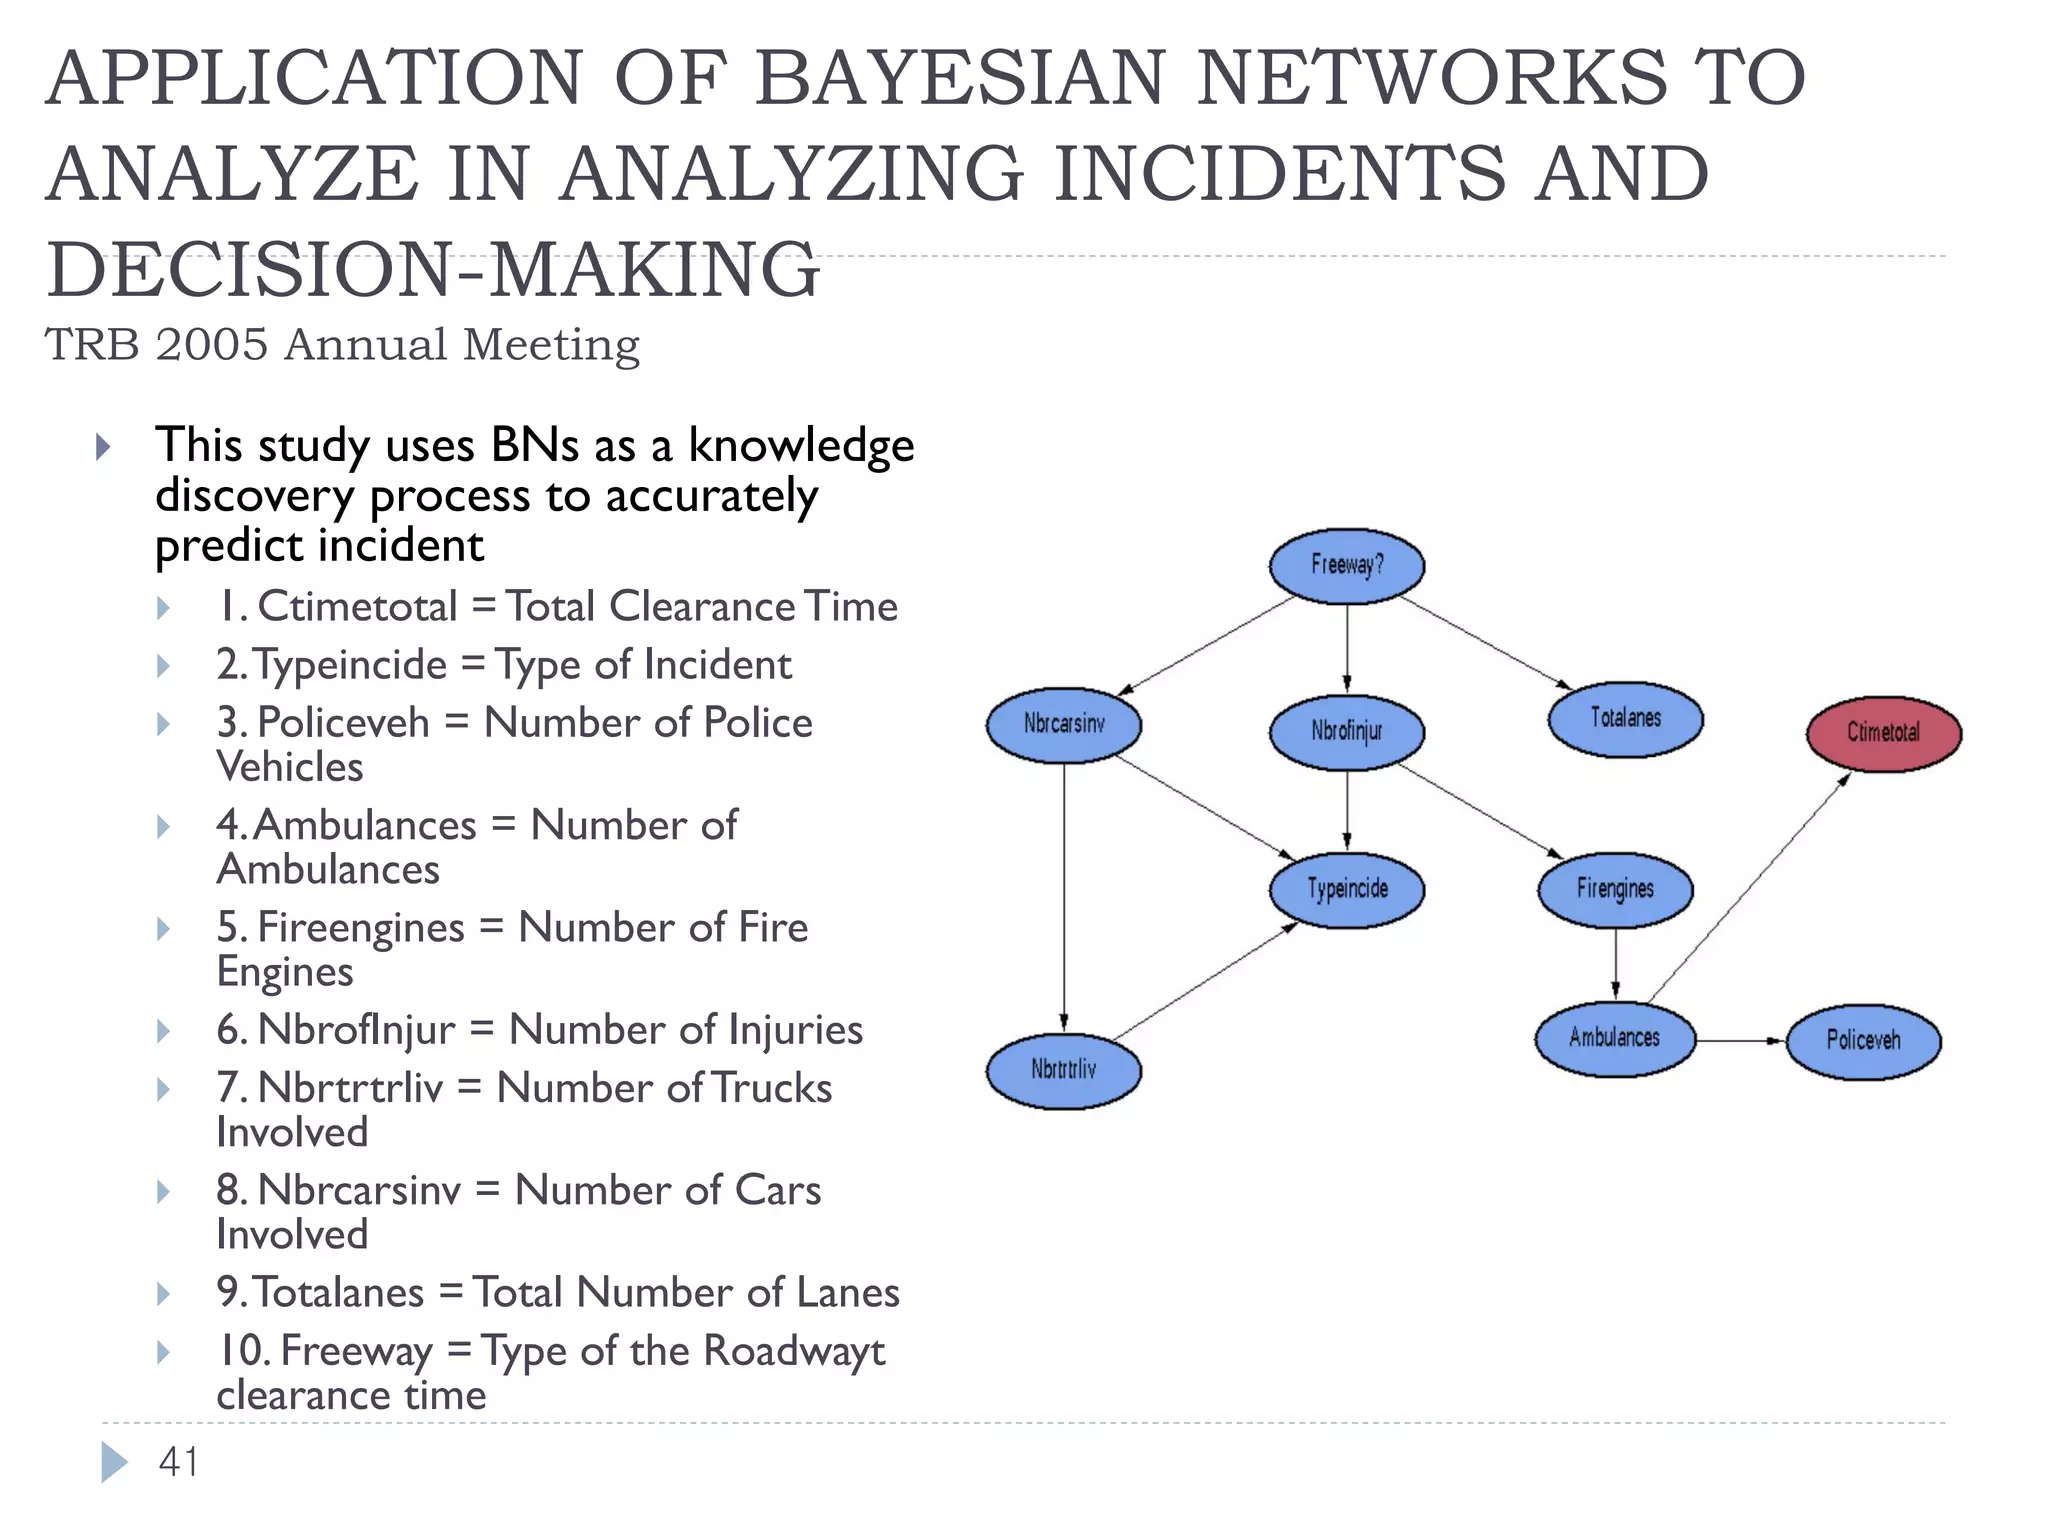
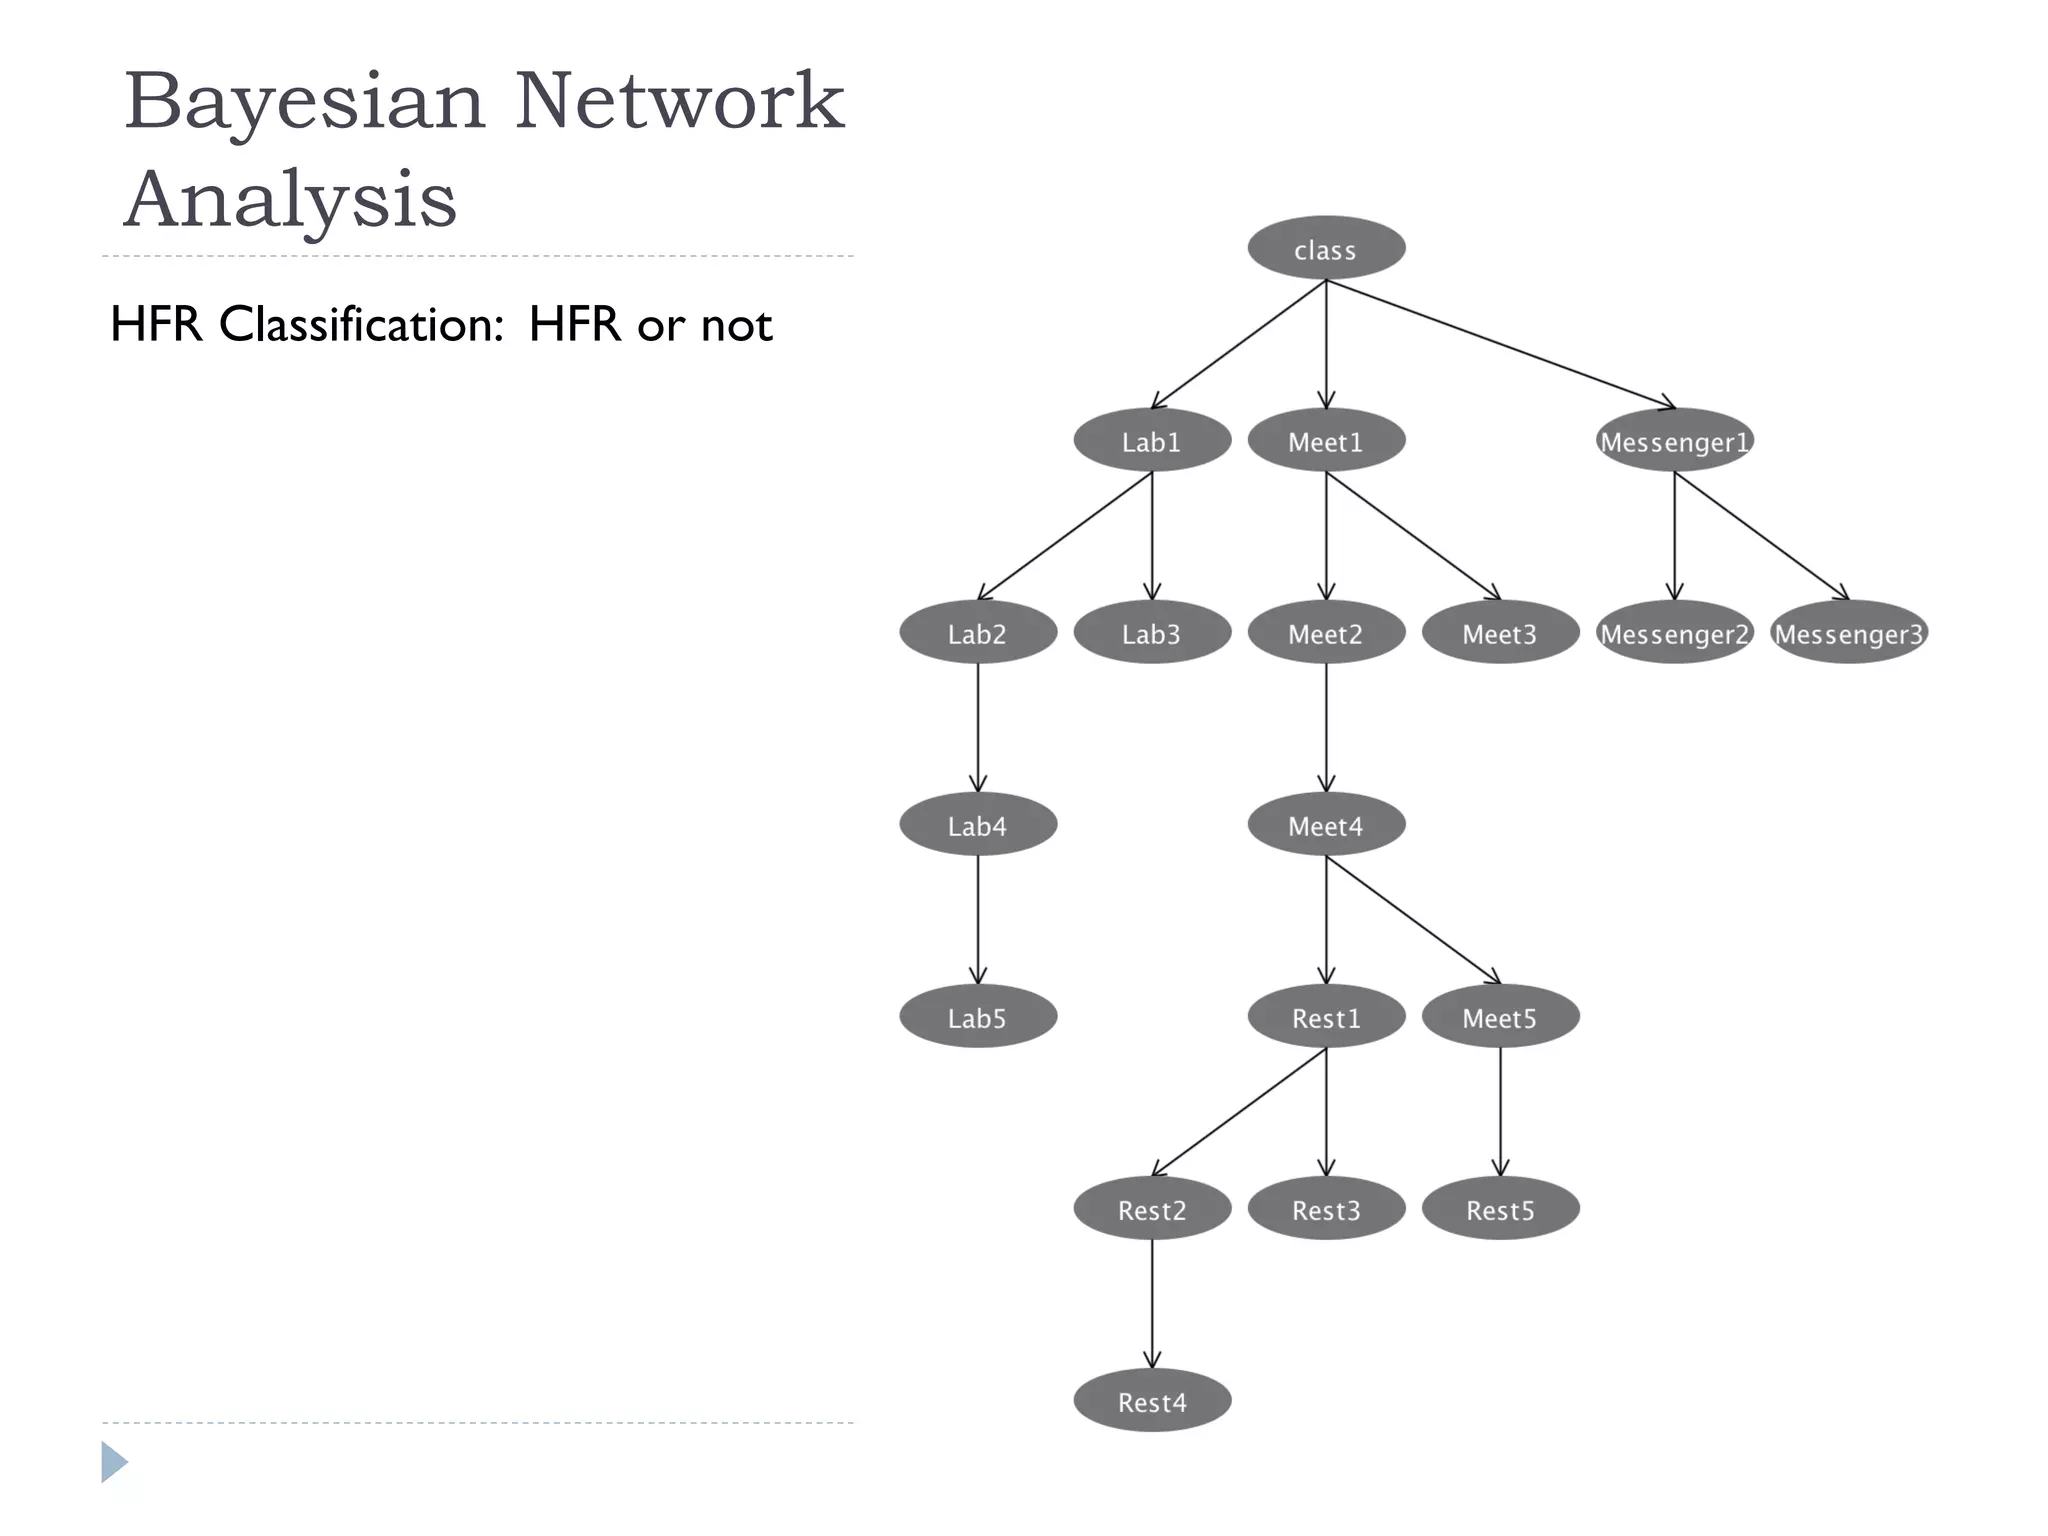
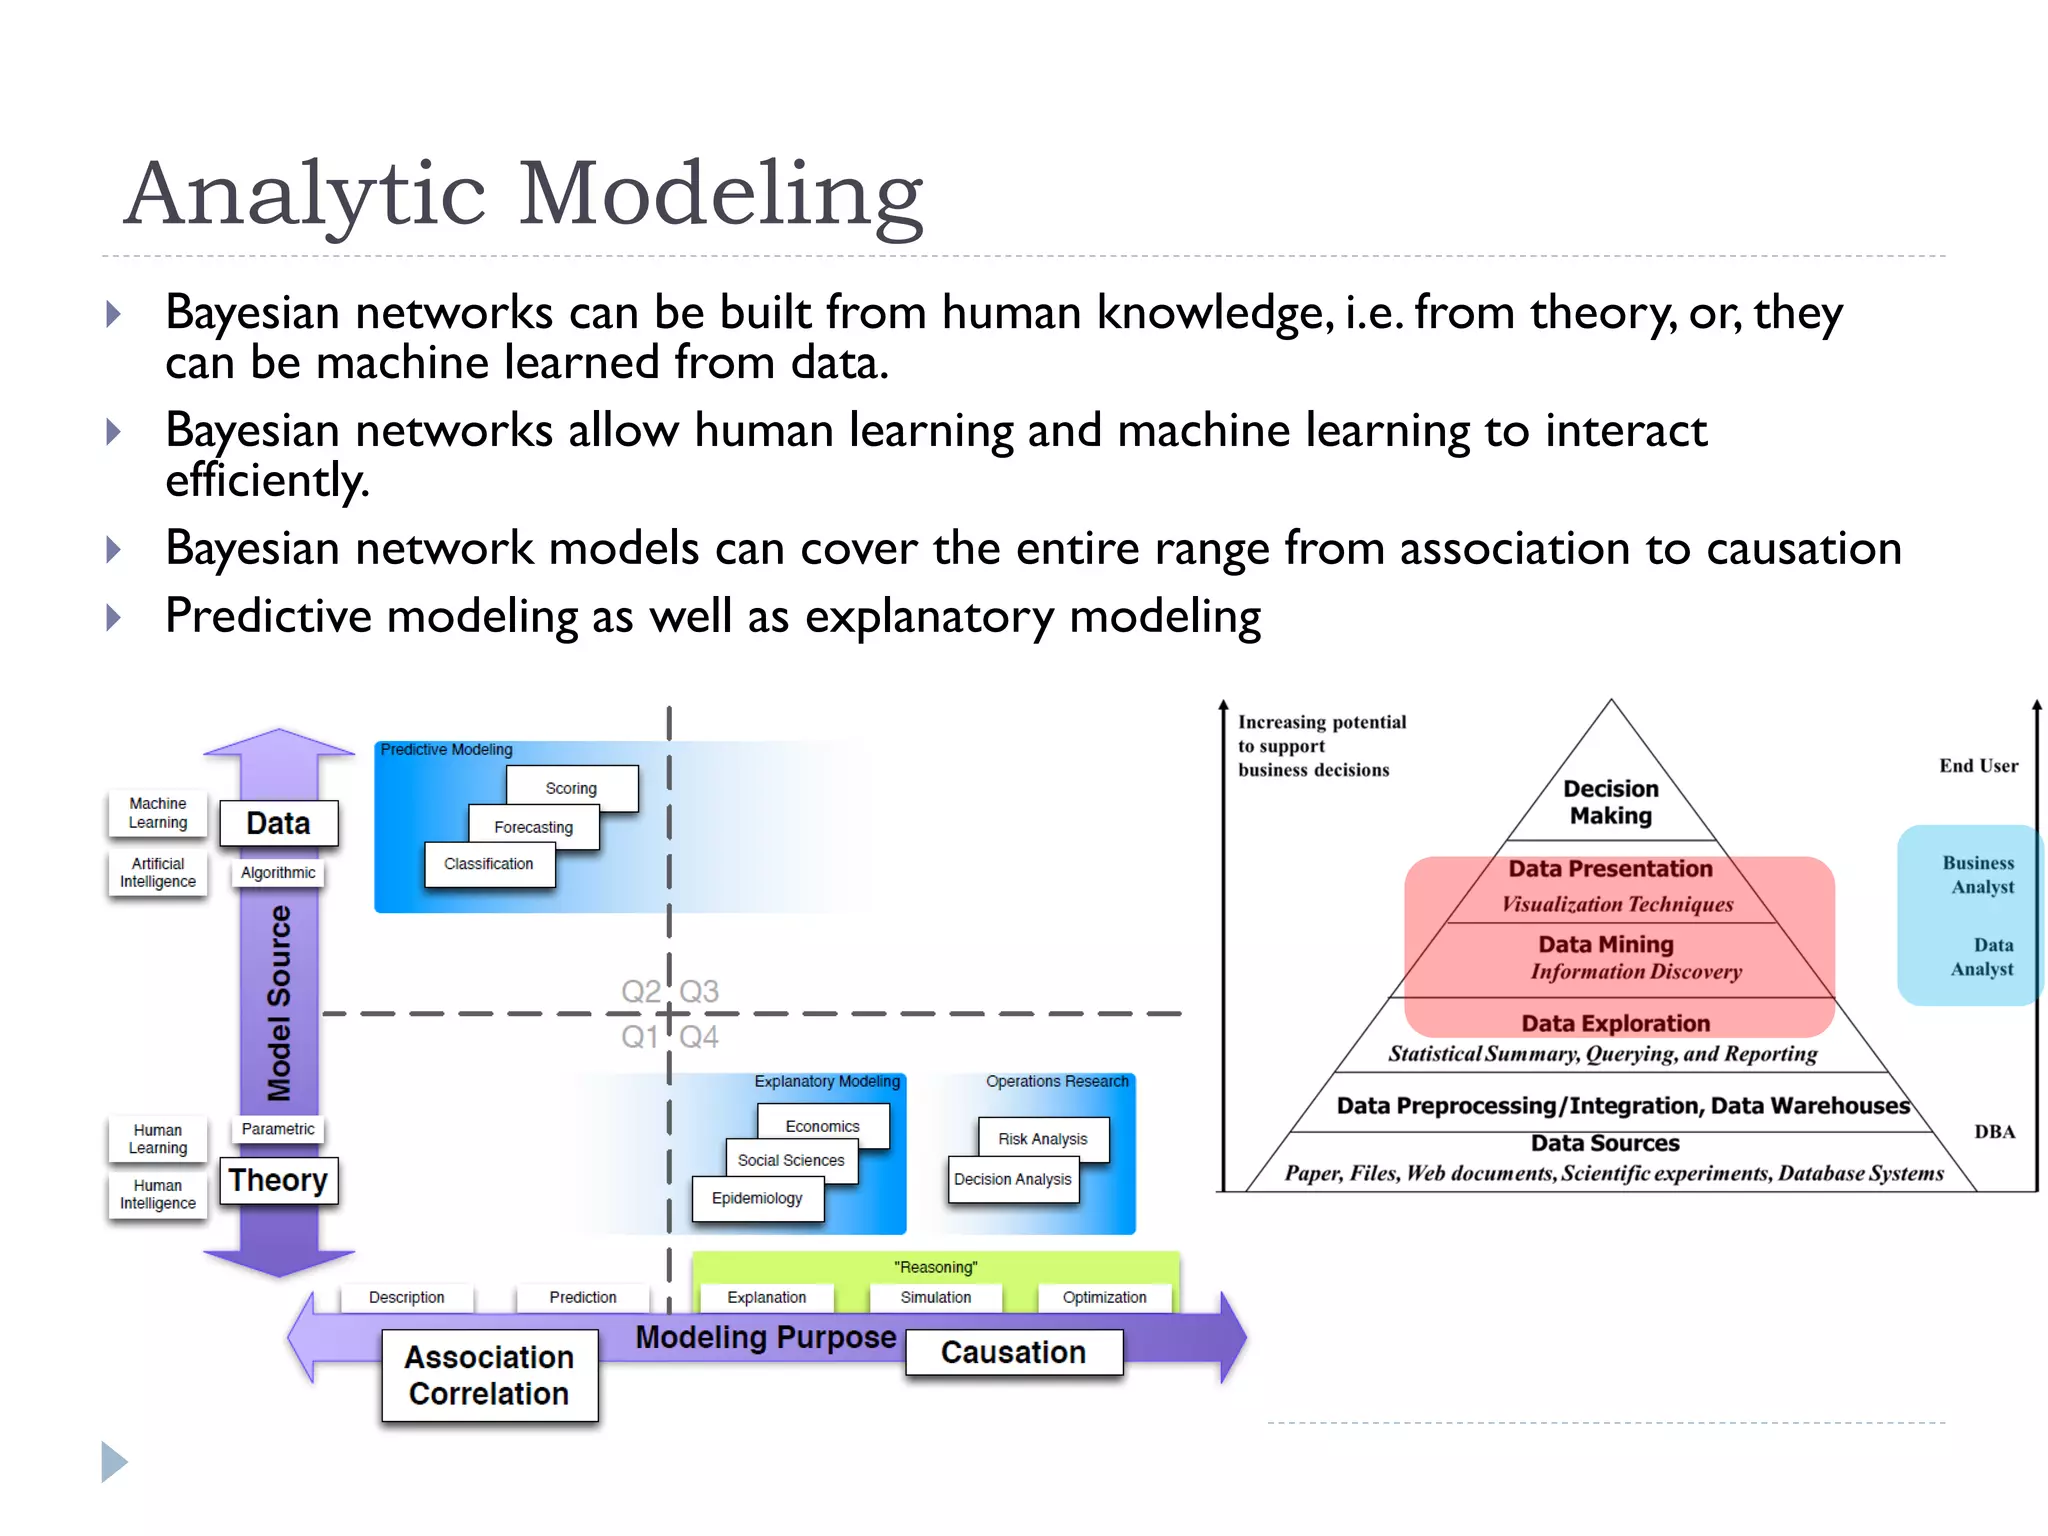
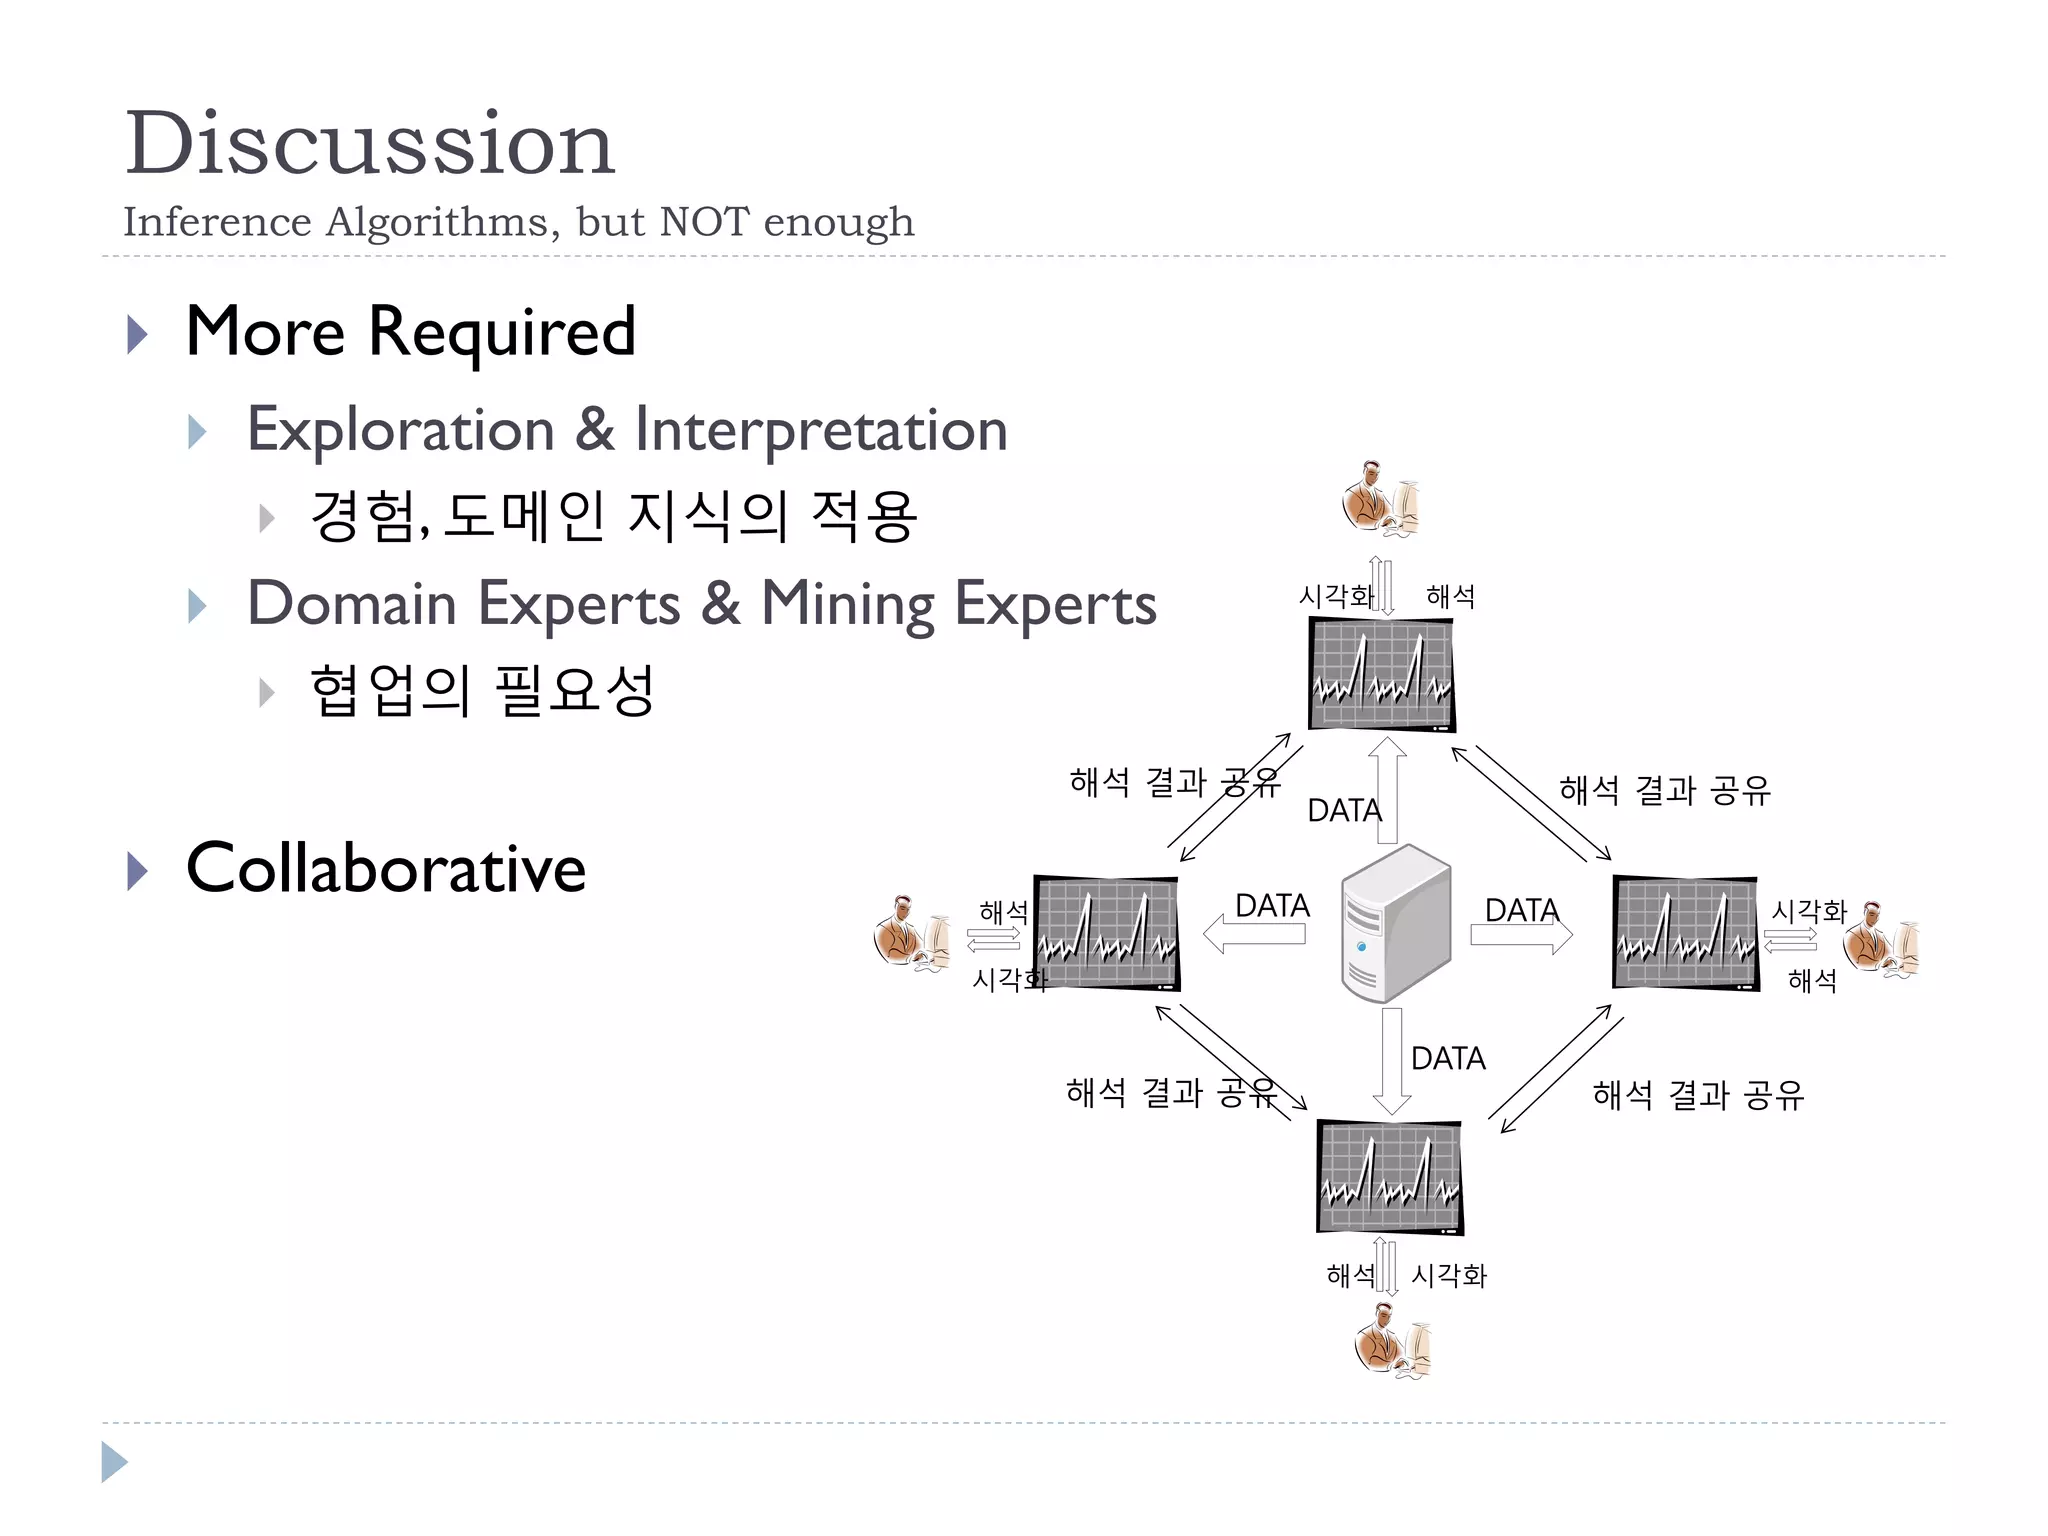
Bayesian Network 을 활용한 예측 분석 Machine learning 의 관점에서 본 데이터의 활용 
최진혁 Ph.D. (인포리언스) 
2014. 09.16.
Who Am I? 
Ph.D. @ KAIST 전산학과 
Human-Computer Interaction 
Machine Learning / Data Mining 
ETRI, KAIST 
데이터 기반 홈 미들웨어 
Web & SNS Mining (usage, text…) 
주식회사 인포리언스 (Inforience Inc.) 
Data (Text) Mining 
데이터로부터 실제적인 가치를 추출 
Collaborative Data Mining System 개발 
데이터에 포함된 동적 패턴의 탐색과 해석을 위한 협업적 탐험 플랫폼(Collaborative Data Mining Platform for Searching and Interpretation of Data Dynamics) 
http://inforience.net/
Who Am I? 
"Big data does not need big machines. It needs big intelligence". 
그렇다면, Big intelligence 는 어디서부터?
세미나 개념 및 내용 
개념 
기계학습의 기본 개념 소개 (사례를 통한) 
특히, Bayesian Network 
비전문가 대상 
경험과 의견의 공유 
내용 
빅 데이터는 충분히 활용되고 있는가? 
빅 데이터 활용의 핵심 - Machine Learning 
개념과 모델 
사례 
데이터 기반 추론과 예측 
Bayesian Networks 
사례 
토론
빅 데이터 충분히 활용되고 있나? 
빅 데이터가 중요하다는 이야기 
모두 지겹다 
활용에 관한 구체적인 이야기!! 
그러나 충분히 활용되지 못하고 있다는 이야기
빅 데이터 시대의 Machine Learning 
증가한 데이터 저장 능력 / 실제로 증가한 데이터 
Looks random but certain patterns 
어떤 패턴들이 숨어있는지 알 수 없다. 
A good or useful approximation 
무척 중요하지만… 
특별한 분야의 특별한 데이터, 그리고 특별한 해석 
데이터 양, 종류, 특성, 활용 분야의 증가 
다양한 분야의 다양한 데이터, 그리고 다양한 활용 
누구에게나 적용될 수 있는 결과  해석과 활용의 중요성
Machine Learning 
Inducing general functions from specific training examples 
Looking for the hypothesis that best fits the training examples 
Inferring a boolean-valued function from training examples of its input and output
Machine Learning
Machine Learning 
Machine Learning을 실제 문제에 적용하는 것은 쉬운가? 
General (Ideal) Process vs. Real Process 
Machine Learning 으로부터 무엇을 얻어낼 수 있는가? 
Inference? Prediction? 
Predictive Modeling vs. Explanatory Modeling
Machine Learning Examples (1) 
 Function approximation (Mexican hat) 
  2 2 
3 1 2 1 2 1 2 f (x , x )  sin 2 x  x , x , x [1,1]
Machine Learning Examples (2) 
Face image classification
Machine Learning Examples (3)
Machine Learning Examples (4)
Machine Learning Examples (5)
Machine Learning Examples (6) 
TV program preference inference based on web usage data 
Web page #1 Web page #2 Web page #3 Web page #4 …. 
Classifier 
TV Program #1 TV Program #2 TV Program #3 TV Program #4 …. 
1 
2 
3 
What are we supposed to do at each step?
Mining Social Relationship Types in an Organization using Communication Patterns 
CSCW 2013 
Jinhyuk Choi, Seongkook Heo, Jaehyun Han, Geehyuk Lee, Junehwa Song 
Department of Computer Science 
KAIST (Korea Advanced Institute of Science and Technology)
Objective 
Propose a method to… 
automatically recognize social relationship types among people in an organization 
Using only easily collectable data 
indoor co-location data 
instant messenger data (rather than e-mail, call logs…) 
real-time communication 
without having to worry about their conversations being exposed in a shared location
Experiment Data collection 
Co-location 
How long, how often, how regularly 
Bluetooth stations at several location points (meeting rooms, Labs, a lounge) 
scan the surrounding area at a radius of approximately 10 m, at a 20s frequency 
collect the Bluetooth IDs of users’ mobile phones 
Instant Messenger Data 
From participants’ PCs 
Record the names of participants conversed with by participants as well as the time of the conversation at one minute intervals 
6th floor at KAIST Computer Science building 
Bluetooth Stations
Experiment Data collection 
Participants 
22 computer science graduate students 
Belong to several different concentrations. 
Same concentration 
close seats & regular meetings in the meeting room 
For one month 
User survey (question about 21 other participants)
Experiment Data analysis 
: detected time slot 
: non- detected time slot 
User #3 
User #1 
User #2 
TIME 
푡12 푘: 14 
푡13 푘: 5 
Location : k 
푓12 푘: 2 
푓13 푘: 1 
푡1 푘: 24 
푡2 푘: 17 
푡3 푘: 11 
푓1 푘: 4 
푓2 푘: 3 
푓3 푘: 2
Experiment Data analysis 
co-visit-duration (no. of detected time slot) 
how long a particular user i stays with another user j at a particular location k 
co-visit-frequency (no. of detected groups) 
how often a particular user i visited a location k with another user j 
co-visit-average-duration 
co-visit-hour-regularity 
co-visit-weekday-regularity 
mess-comm-duration 
mess-comm number 
mess-comm-ave-time 
From IM… 
Total 18 indicators !!
co-visit-frequency 
(Meeting room) 
2 4 6 8 10 12 14 16 18 
0 
0.05 
0.1 
0.15 
HIR Classification 
IG 
2 4 6 8 10 12 14 16 18 
0 
0.05 
0.1 
HFR Classification 
IG 
Experiment 
Data analysis 
Lounge Lab Messenger Meeting 
room 
co-visit-duration 
(Lounge) 
HIR Classification: HIR or not 
HFR Classification: HFR or not 
Indicator numbers 
Indicator numbers
Process 
Hypothesis 
Data selection 
Data collection 
Feature design 
Data exploration 
Algorithm selection 
Analysis 
Interpretation 
Application
 To build accurate user profile 
 Navigational page elimination – “not fully 
explored” 
 Using no. of contained hyperlinks or URL lengths 
 (Cooley, Mobasher, & Srivastava, 1999; Domenech & 
Lorenzo, 2007) 
 Manually 
 (Kelly & Belkin, 2004) 
High-Interested Contents Page Retrieval 
Figure from “Data Preparation for Mining World Wide 
Web Browsing Patterns”, Journal of Knowledge and 
Information Systems, 1999 
1 2 
0 
2000 
4000 
6000 
8000 
10000 
12000 
14000 
16000 
No. of Web pages 
1-Navigational/2-Contents 
1 2 3 4 5 
0 
1000 
2000 
3000 
4000 
5000 
6000 
No. of Web pages 
Interest Levels 
 Hypothesis 
 Users will visit navigational pages more frequently 
& regularly 
 Users will show more interactions at interested 
pages 
 High interested page identification 
 Interaction logs (many references) 
 Visit frequency & revisit patterns 
 (Adar, Teevan, & Dumais, 2008; Aula, Jhaveri, & 
Kaki, 2005)
c c c c c c c c c c c c c c c c c c c c c c c c c 
Day frequency (DF) 
Visit number in a day (VnD) 
Interaction logs (day mean) 
Session frequency (SF) 
Visit number in a session (VnS) 
Interaction logs (session mean) 
|{ : }| 
| | 
j i j 
i 
d Url d 
DF 
D 
 
 
ij 
ij 
kj 
k 
n 
VnD 
n 
 
 
|{ : }| 
| | 
j i j 
i 
s Url s 
SF 
S 
 
 
ij 
ij 
kj 
k 
m 
VnS 
m 
 
 
Total 16 features 
High-Interested Contents Page Retrieval
Visit patterns 
Interaction logs 
High-Interested Contents Page Retrieval 
2 phases required
Day frequency 
Session frequency 
Visit number in a day 
Usage data (day mean) 
Visit number in a session 
Usage data (session mean) 
N-day buffer 
1-day buffer 
1-day buffer 
1-Session buffer 
The first Classifier 
The second Classifier 
High valued 
Web Pages 
Navigational 
pages 
Low-interested pages 
: data calculation modules : Sessions : Web pages 
Contents pages 
High-Interested Contents Page Retrieval
Inference & Prediction based on Data
Bayesian Networks Introduction 
Graphical models, probabilistic networks 
causality and influence 
Nodes are hypotheses (random vars) and the prob corresponds to our belief in the truth of the hypothesis 
Arcs are direct influences between hypotheses 
The structure is represented as a directed acyclic graph (DAG) 
Representation of the dependencies among random variables 
The parameters are the conditional probs in the arcs 
움직임 
소리 
진동 
밝기 
수행 기능
Bayesian Networks Introduction 
Learning 
Inducing a graph 
From prior knowledge 
From structure learning 
Estimating parameters 
Inference 
Beliefs from evidences 
Especially among the nodes not directly connected 
?????
Structure Introduction 
Initial configuration of BN 
Root nodes 
Prior probabilities 
Non-root nodes 
Conditional probabilities given all possible combinations of direct predecessors 
A 
B 
D 
E 
C 
P(b) 
P(a) 
P(d|ab), P(d|aㄱb), P(d|ㄱab), P(d|ㄱaㄱb) 
P(e|d) P(e|ㄱd) 
P(c|a) 
P(c|ㄱa)
Causes and Bayes’ Rule Introduction 
Diagnostic inference: 
Knowing that the grass is wet, 
what is the probability that rain is 
the cause? 
causal 
diagnostic
Causal vs Diagnostic Inference Introduction 
Causal inference: If the sprinkler is on, what is the probability that the grass is wet? P(W|S) = P(W|R,S) P(R|S) + P(W|~R,S) P(~R|S) = P(W|R,S) P(R) + P(W|~R,S) P(~R) = 0.95*0.4 + 0.9*0.6 = 0.92
Bayesian Networks: Causes Introduction 
Causal inference: 
P(W|C) = P(W|R,S) P(R,S|C) + 
P(W|~R,S) P(~R,S|C) + 
P(W|R,~S) P(R,~S|C) + 
P(W|~R,~S) P(~R,~S|C) 
and use the fact that 
P(R,S|C) = P(R|C) P(S|C) 
Diagnostic: P(C|W ) = ?
Bayesian Networks: Inference Introduction 
P (C,S,R,W,F ) = P (C ) P (S |C ) P (R |C ) P (W |R,S ) P (F |R ) 
P (C,F ) = ΣS ΣR ΣW P (C,S,R,W,F ) 
P (F |C) = P (C,F ) / P(C ) Not efficient! 
Belief propagation (Pearl, 1988) 
Junction trees (Lauritzen and Spiegelhalter, 1988) 
Independence assumption
Inference Evidence & Belief Propagation 
Evidence – values of observed nodes 
V3 = T, V6 = 3 
Our belief in what the value of Vi ‘should’ be changes. 
This belief is propagated 
V1 
V5 
V2 
V4 
V3 
V6
Belief Propagation 
V 
U2 
V1 
V2 
U1 
π(U2) 
π(V1) 
π(V2) 
π(U1) 
λ(U1) 
λ(V2) 
λ(V1) 
λ(U2)
Evidence & Belief 
V1 
V5 
V2 
V4 
V3 
V6 
Evidence 
Belief 
Evidence 
Works for classification ??
Applying Bayesian Network 
데이터 수집 
현재 상황 데이터 (Evidence!!!) 
-매우 불완전  일부 변수만 확인 가능 
추론 
추론 모델 구축 
추론 모델 
A 
B 
C 
D 
E 
F 
G 
A 
C 
G 
F 
B 
A 
C 
G 
F 
B 
Exploratory study 가 필요!!! 
Data Preprocessing & Cleaning
Examples 
Modeling Vehicle Choice and Simulating Market Share with Bayesian Networks 
Identifying Priorities for Maximizing Repurchase Intent 
Vehicle Size, Weight, and Injury Risk 
Knowledge Discovery in the Stock Market
APPLICATION OF BAYESIAN NETWORKS TO ANALYZE IN ANALYZING INCIDENTS AND DECISION-MAKING TRB 2005 Annual Meeting 
This study uses BNs as a knowledge discovery process to accurately predict incident 
1. Ctimetotal = Total Clearance Time 
2. Typeincide = Type of Incident 
3. Policeveh = Number of Police Vehicles 
4. Ambulances = Number of Ambulances 
5. Fireengines = Number of Fire Engines 
6. NbrofInjur = Number of Injuries 
7. Nbrtrtrliv = Number of Trucks Involved 
8. Nbrcarsinv = Number of Cars Involved 
9. Totalanes = Total Number of Lanes 
10. Freeway = Type of the Roadwayt clearance time 
41
Using Bayesian Networks to Model Accident Causation in the UK Railway Industry Probabilistic Safety Assessment and Management 2004, pp 3597-3602 
SPAD (Signals Passed at Danger) 
Organisational factors 
Events attributed to human error and blamed on an operator have systemic causes, such as procedural or organisational weaknesses. 
Modelling the Organisational Context
해상 사고 데이터 분석 과정 
공공 데이터 포털에서 2007~2013년 사이의 해상 사고 데이터 (엑셀 형식) 를 다운로드 
원 데이터 형태는 아래 그림과 같음 (각 연도별로 탭을 만들어 저장되어 있는 형태)
해상 사고 데이터 분석 과정 
Bayesian Network 트레이닝 결과
해상 사고 데이터 분석 과정 
•예1) 그림의 노드 6 (사고 유형)을 CD(충돌)로 설정할 경우 (실제로 충돌유형의 사고가 보고되었다는 가정) 
•노드 5 (사고해역) 의 확률분포는 변화가 없음 
•CAUSE 노드는 WH (운항부주의) 값이 현저하게 상승 
•충돌사고는 운항부주의가 원인이라고 추론할 여지가 있음
해상 사고 데이터 분석 과정 
예2) 그림의 노드 6 (사고 유형)을 HJ(화재)로 설정할 경우, (실제로 화재 유형의 사고가 보고되었다는 가정) 
•CAUSE 노드에서는 기타 원인 (ETC)와 화기취급부주의 (HG) 의 확률 값이 크게 상승 
•노드 5 (사고해역) 에서는 항계내(HGN) 의 확률값이 현저히 상승함 
•(화재 사고는 항계내 해역에서 많이 발생하며 화기취급부주의가 가장 큰 원인이 된다고 해석 가능함)
Bayesian Network Analysis 
HFR Classification: HFR or not
Bayesian Network Analysis 
48 
High-Interested Contents Page Retrieval 
Interest Level 
Page Types
Process 
Hypothesis 
Data selection 
Data collection 
Feature design 
Data exploration 
Algorithm selection  Bayesian Network 
Analysis & Inference 
Interpretation 
Application
Analytic Modeling 
Bayesian networks can be built from human knowledge, i.e. from theory, or, they can be machine learned from data. 
Bayesian networks allow human learning and machine learning to interact efficiently. 
Bayesian network models can cover the entire range from association to causation 
Predictive modeling as well as explanatory modeling
Bayesian Network – 어디에 쓰면 좋을까?
Big machine, data analysis, Inference Algorithms, but NOT enough 
무엇이 더 필요한가?
Discussion 
Inference Algorithms, but NOT enough 
 More Required 
 Exploration & Interpretation 
 경험, 도메인 지식의 적용 
 Domain Experts & Mining Experts 
 협업의 필요성 
 Collaborative 
해석 결과 공유 
해석 결과 공유 
해석 결과 공유 
해석 결과 공유 
시각화 해석 
시각화 
해석 
해석 
해석 
시각화 
시각화 
DATA DATA 
DATA 
DATA
References 
Textbooks 
Ethem ALPAYDIN, Introduction to Machine Learning, The MIT Press, 2004 
Tom Mitchell, Machine Learning, McGraw Hill, 1997 
Neapolitan, R.E., Learning Bayesian Networks, Prentice Hall, 2003 
Jiawei Han, Micheline Kamber, and Jian Pei, Data Mining: Concepts and Techniques, 3rd edition, Morgan Kaufmann, 2011. 
Materials 
Serafín Moral, Learning Bayesian Networks, University of Granada, Spain 
Zheng Rong Yang, Connectionism, Exeter University 
KyuTae Cho ,Jeong Ki Yoo ,HeeJin Lee, Uncertainty in AI, Probabilistic reasoning, Especially for Bayesian Networks 
Gary Bradski, Sebastian Thrun, Bayesian Networks in Computer Vision, Stanford University 
Websites 
http://library.bayesia.com/display/whitepapers/White+Papers 
https://www.facebook.com/dan.ariely/posts/904383595868 
http://tomfishburne.com/2014/01/big-data.html 
http://news.dice.com/2012/07/17/businesses-struggling-with-data-flood-survey/ 
http://www.slideshare.net/jeric14/201305-hadoop-jplv3 
Papers 
Daniel Siewiorek et. al. "SenSay: A Context-Aware Mobile Phone", Proceeding ISWC '03 Proceedings of the 7th IEEE International Symposium on Wearable Computers 
A. Krause et. al, “Unsupervised, Dynamic Identification of Physiological and Activity Context in Wearable Computing”, ISWC 2005

Bayesian Network 을 활용한 예측 분석

  • 1.
    Bayesian Network 을활용한 예측 분석 Machine learning 의 관점에서 본 데이터의 활용 최진혁 Ph.D. (인포리언스) 2014. 09.16.
  • 2.
    Who Am I? Ph.D. @ KAIST 전산학과 Human-Computer Interaction Machine Learning / Data Mining ETRI, KAIST 데이터 기반 홈 미들웨어 Web & SNS Mining (usage, text…) 주식회사 인포리언스 (Inforience Inc.) Data (Text) Mining 데이터로부터 실제적인 가치를 추출 Collaborative Data Mining System 개발 데이터에 포함된 동적 패턴의 탐색과 해석을 위한 협업적 탐험 플랫폼(Collaborative Data Mining Platform for Searching and Interpretation of Data Dynamics) http://inforience.net/
  • 3.
    Who Am I? "Big data does not need big machines. It needs big intelligence". 그렇다면, Big intelligence 는 어디서부터?
  • 4.
    세미나 개념 및내용 개념 기계학습의 기본 개념 소개 (사례를 통한) 특히, Bayesian Network 비전문가 대상 경험과 의견의 공유 내용 빅 데이터는 충분히 활용되고 있는가? 빅 데이터 활용의 핵심 - Machine Learning 개념과 모델 사례 데이터 기반 추론과 예측 Bayesian Networks 사례 토론
  • 5.
    빅 데이터 충분히활용되고 있나? 빅 데이터가 중요하다는 이야기 모두 지겹다 활용에 관한 구체적인 이야기!! 그러나 충분히 활용되지 못하고 있다는 이야기
  • 6.
    빅 데이터 시대의Machine Learning 증가한 데이터 저장 능력 / 실제로 증가한 데이터 Looks random but certain patterns 어떤 패턴들이 숨어있는지 알 수 없다. A good or useful approximation 무척 중요하지만… 특별한 분야의 특별한 데이터, 그리고 특별한 해석 데이터 양, 종류, 특성, 활용 분야의 증가 다양한 분야의 다양한 데이터, 그리고 다양한 활용 누구에게나 적용될 수 있는 결과  해석과 활용의 중요성
  • 7.
    Machine Learning Inducinggeneral functions from specific training examples Looking for the hypothesis that best fits the training examples Inferring a boolean-valued function from training examples of its input and output
  • 8.
  • 9.
    Machine Learning MachineLearning을 실제 문제에 적용하는 것은 쉬운가? General (Ideal) Process vs. Real Process Machine Learning 으로부터 무엇을 얻어낼 수 있는가? Inference? Prediction? Predictive Modeling vs. Explanatory Modeling
  • 10.
    Machine Learning Examples(1)  Function approximation (Mexican hat)   2 2 3 1 2 1 2 1 2 f (x , x )  sin 2 x  x , x , x [1,1]
  • 11.
    Machine Learning Examples(2) Face image classification
  • 12.
  • 13.
  • 14.
  • 15.
    Machine Learning Examples(6) TV program preference inference based on web usage data Web page #1 Web page #2 Web page #3 Web page #4 …. Classifier TV Program #1 TV Program #2 TV Program #3 TV Program #4 …. 1 2 3 What are we supposed to do at each step?
  • 16.
    Mining Social RelationshipTypes in an Organization using Communication Patterns CSCW 2013 Jinhyuk Choi, Seongkook Heo, Jaehyun Han, Geehyuk Lee, Junehwa Song Department of Computer Science KAIST (Korea Advanced Institute of Science and Technology)
  • 17.
    Objective Propose amethod to… automatically recognize social relationship types among people in an organization Using only easily collectable data indoor co-location data instant messenger data (rather than e-mail, call logs…) real-time communication without having to worry about their conversations being exposed in a shared location
  • 18.
    Experiment Data collection Co-location How long, how often, how regularly Bluetooth stations at several location points (meeting rooms, Labs, a lounge) scan the surrounding area at a radius of approximately 10 m, at a 20s frequency collect the Bluetooth IDs of users’ mobile phones Instant Messenger Data From participants’ PCs Record the names of participants conversed with by participants as well as the time of the conversation at one minute intervals 6th floor at KAIST Computer Science building Bluetooth Stations
  • 19.
    Experiment Data collection Participants 22 computer science graduate students Belong to several different concentrations. Same concentration close seats & regular meetings in the meeting room For one month User survey (question about 21 other participants)
  • 20.
    Experiment Data analysis : detected time slot : non- detected time slot User #3 User #1 User #2 TIME 푡12 푘: 14 푡13 푘: 5 Location : k 푓12 푘: 2 푓13 푘: 1 푡1 푘: 24 푡2 푘: 17 푡3 푘: 11 푓1 푘: 4 푓2 푘: 3 푓3 푘: 2
  • 21.
    Experiment Data analysis co-visit-duration (no. of detected time slot) how long a particular user i stays with another user j at a particular location k co-visit-frequency (no. of detected groups) how often a particular user i visited a location k with another user j co-visit-average-duration co-visit-hour-regularity co-visit-weekday-regularity mess-comm-duration mess-comm number mess-comm-ave-time From IM… Total 18 indicators !!
  • 22.
    co-visit-frequency (Meeting room) 2 4 6 8 10 12 14 16 18 0 0.05 0.1 0.15 HIR Classification IG 2 4 6 8 10 12 14 16 18 0 0.05 0.1 HFR Classification IG Experiment Data analysis Lounge Lab Messenger Meeting room co-visit-duration (Lounge) HIR Classification: HIR or not HFR Classification: HFR or not Indicator numbers Indicator numbers
  • 23.
    Process Hypothesis Dataselection Data collection Feature design Data exploration Algorithm selection Analysis Interpretation Application
  • 24.
     To buildaccurate user profile  Navigational page elimination – “not fully explored”  Using no. of contained hyperlinks or URL lengths  (Cooley, Mobasher, & Srivastava, 1999; Domenech & Lorenzo, 2007)  Manually  (Kelly & Belkin, 2004) High-Interested Contents Page Retrieval Figure from “Data Preparation for Mining World Wide Web Browsing Patterns”, Journal of Knowledge and Information Systems, 1999 1 2 0 2000 4000 6000 8000 10000 12000 14000 16000 No. of Web pages 1-Navigational/2-Contents 1 2 3 4 5 0 1000 2000 3000 4000 5000 6000 No. of Web pages Interest Levels  Hypothesis  Users will visit navigational pages more frequently & regularly  Users will show more interactions at interested pages  High interested page identification  Interaction logs (many references)  Visit frequency & revisit patterns  (Adar, Teevan, & Dumais, 2008; Aula, Jhaveri, & Kaki, 2005)
  • 25.
    c c cc c c c c c c c c c c c c c c c c c c c c c Day frequency (DF) Visit number in a day (VnD) Interaction logs (day mean) Session frequency (SF) Visit number in a session (VnS) Interaction logs (session mean) |{ : }| | | j i j i d Url d DF D   ij ij kj k n VnD n   |{ : }| | | j i j i s Url s SF S   ij ij kj k m VnS m   Total 16 features High-Interested Contents Page Retrieval
  • 26.
    Visit patterns Interactionlogs High-Interested Contents Page Retrieval 2 phases required
  • 27.
    Day frequency Sessionfrequency Visit number in a day Usage data (day mean) Visit number in a session Usage data (session mean) N-day buffer 1-day buffer 1-day buffer 1-Session buffer The first Classifier The second Classifier High valued Web Pages Navigational pages Low-interested pages : data calculation modules : Sessions : Web pages Contents pages High-Interested Contents Page Retrieval
  • 28.
  • 29.
    Bayesian Networks Introduction Graphical models, probabilistic networks causality and influence Nodes are hypotheses (random vars) and the prob corresponds to our belief in the truth of the hypothesis Arcs are direct influences between hypotheses The structure is represented as a directed acyclic graph (DAG) Representation of the dependencies among random variables The parameters are the conditional probs in the arcs 움직임 소리 진동 밝기 수행 기능
  • 30.
    Bayesian Networks Introduction Learning Inducing a graph From prior knowledge From structure learning Estimating parameters Inference Beliefs from evidences Especially among the nodes not directly connected ?????
  • 31.
    Structure Introduction Initialconfiguration of BN Root nodes Prior probabilities Non-root nodes Conditional probabilities given all possible combinations of direct predecessors A B D E C P(b) P(a) P(d|ab), P(d|aㄱb), P(d|ㄱab), P(d|ㄱaㄱb) P(e|d) P(e|ㄱd) P(c|a) P(c|ㄱa)
  • 32.
    Causes and Bayes’Rule Introduction Diagnostic inference: Knowing that the grass is wet, what is the probability that rain is the cause? causal diagnostic
  • 33.
    Causal vs DiagnosticInference Introduction Causal inference: If the sprinkler is on, what is the probability that the grass is wet? P(W|S) = P(W|R,S) P(R|S) + P(W|~R,S) P(~R|S) = P(W|R,S) P(R) + P(W|~R,S) P(~R) = 0.95*0.4 + 0.9*0.6 = 0.92
  • 34.
    Bayesian Networks: CausesIntroduction Causal inference: P(W|C) = P(W|R,S) P(R,S|C) + P(W|~R,S) P(~R,S|C) + P(W|R,~S) P(R,~S|C) + P(W|~R,~S) P(~R,~S|C) and use the fact that P(R,S|C) = P(R|C) P(S|C) Diagnostic: P(C|W ) = ?
  • 35.
    Bayesian Networks: InferenceIntroduction P (C,S,R,W,F ) = P (C ) P (S |C ) P (R |C ) P (W |R,S ) P (F |R ) P (C,F ) = ΣS ΣR ΣW P (C,S,R,W,F ) P (F |C) = P (C,F ) / P(C ) Not efficient! Belief propagation (Pearl, 1988) Junction trees (Lauritzen and Spiegelhalter, 1988) Independence assumption
  • 36.
    Inference Evidence &Belief Propagation Evidence – values of observed nodes V3 = T, V6 = 3 Our belief in what the value of Vi ‘should’ be changes. This belief is propagated V1 V5 V2 V4 V3 V6
  • 37.
    Belief Propagation V U2 V1 V2 U1 π(U2) π(V1) π(V2) π(U1) λ(U1) λ(V2) λ(V1) λ(U2)
  • 38.
    Evidence & Belief V1 V5 V2 V4 V3 V6 Evidence Belief Evidence Works for classification ??
  • 39.
    Applying Bayesian Network 데이터 수집 현재 상황 데이터 (Evidence!!!) -매우 불완전  일부 변수만 확인 가능 추론 추론 모델 구축 추론 모델 A B C D E F G A C G F B A C G F B Exploratory study 가 필요!!! Data Preprocessing & Cleaning
  • 40.
    Examples Modeling VehicleChoice and Simulating Market Share with Bayesian Networks Identifying Priorities for Maximizing Repurchase Intent Vehicle Size, Weight, and Injury Risk Knowledge Discovery in the Stock Market
  • 41.
    APPLICATION OF BAYESIANNETWORKS TO ANALYZE IN ANALYZING INCIDENTS AND DECISION-MAKING TRB 2005 Annual Meeting This study uses BNs as a knowledge discovery process to accurately predict incident 1. Ctimetotal = Total Clearance Time 2. Typeincide = Type of Incident 3. Policeveh = Number of Police Vehicles 4. Ambulances = Number of Ambulances 5. Fireengines = Number of Fire Engines 6. NbrofInjur = Number of Injuries 7. Nbrtrtrliv = Number of Trucks Involved 8. Nbrcarsinv = Number of Cars Involved 9. Totalanes = Total Number of Lanes 10. Freeway = Type of the Roadwayt clearance time 41
  • 42.
    Using Bayesian Networksto Model Accident Causation in the UK Railway Industry Probabilistic Safety Assessment and Management 2004, pp 3597-3602 SPAD (Signals Passed at Danger) Organisational factors Events attributed to human error and blamed on an operator have systemic causes, such as procedural or organisational weaknesses. Modelling the Organisational Context
  • 43.
    해상 사고 데이터분석 과정 공공 데이터 포털에서 2007~2013년 사이의 해상 사고 데이터 (엑셀 형식) 를 다운로드 원 데이터 형태는 아래 그림과 같음 (각 연도별로 탭을 만들어 저장되어 있는 형태)
  • 44.
    해상 사고 데이터분석 과정 Bayesian Network 트레이닝 결과
  • 45.
    해상 사고 데이터분석 과정 •예1) 그림의 노드 6 (사고 유형)을 CD(충돌)로 설정할 경우 (실제로 충돌유형의 사고가 보고되었다는 가정) •노드 5 (사고해역) 의 확률분포는 변화가 없음 •CAUSE 노드는 WH (운항부주의) 값이 현저하게 상승 •충돌사고는 운항부주의가 원인이라고 추론할 여지가 있음
  • 46.
    해상 사고 데이터분석 과정 예2) 그림의 노드 6 (사고 유형)을 HJ(화재)로 설정할 경우, (실제로 화재 유형의 사고가 보고되었다는 가정) •CAUSE 노드에서는 기타 원인 (ETC)와 화기취급부주의 (HG) 의 확률 값이 크게 상승 •노드 5 (사고해역) 에서는 항계내(HGN) 의 확률값이 현저히 상승함 •(화재 사고는 항계내 해역에서 많이 발생하며 화기취급부주의가 가장 큰 원인이 된다고 해석 가능함)
  • 47.
    Bayesian Network Analysis HFR Classification: HFR or not
  • 48.
    Bayesian Network Analysis 48 High-Interested Contents Page Retrieval Interest Level Page Types
  • 49.
    Process Hypothesis Dataselection Data collection Feature design Data exploration Algorithm selection  Bayesian Network Analysis & Inference Interpretation Application
  • 50.
    Analytic Modeling Bayesiannetworks can be built from human knowledge, i.e. from theory, or, they can be machine learned from data. Bayesian networks allow human learning and machine learning to interact efficiently. Bayesian network models can cover the entire range from association to causation Predictive modeling as well as explanatory modeling
  • 51.
    Bayesian Network –어디에 쓰면 좋을까?
  • 52.
    Big machine, dataanalysis, Inference Algorithms, but NOT enough 무엇이 더 필요한가?
  • 53.
    Discussion Inference Algorithms,but NOT enough  More Required  Exploration & Interpretation  경험, 도메인 지식의 적용  Domain Experts & Mining Experts  협업의 필요성  Collaborative 해석 결과 공유 해석 결과 공유 해석 결과 공유 해석 결과 공유 시각화 해석 시각화 해석 해석 해석 시각화 시각화 DATA DATA DATA DATA
  • 54.
    References Textbooks EthemALPAYDIN, Introduction to Machine Learning, The MIT Press, 2004 Tom Mitchell, Machine Learning, McGraw Hill, 1997 Neapolitan, R.E., Learning Bayesian Networks, Prentice Hall, 2003 Jiawei Han, Micheline Kamber, and Jian Pei, Data Mining: Concepts and Techniques, 3rd edition, Morgan Kaufmann, 2011. Materials Serafín Moral, Learning Bayesian Networks, University of Granada, Spain Zheng Rong Yang, Connectionism, Exeter University KyuTae Cho ,Jeong Ki Yoo ,HeeJin Lee, Uncertainty in AI, Probabilistic reasoning, Especially for Bayesian Networks Gary Bradski, Sebastian Thrun, Bayesian Networks in Computer Vision, Stanford University Websites http://library.bayesia.com/display/whitepapers/White+Papers https://www.facebook.com/dan.ariely/posts/904383595868 http://tomfishburne.com/2014/01/big-data.html http://news.dice.com/2012/07/17/businesses-struggling-with-data-flood-survey/ http://www.slideshare.net/jeric14/201305-hadoop-jplv3 Papers Daniel Siewiorek et. al. "SenSay: A Context-Aware Mobile Phone", Proceeding ISWC '03 Proceedings of the 7th IEEE International Symposium on Wearable Computers A. Krause et. al, “Unsupervised, Dynamic Identification of Physiological and Activity Context in Wearable Computing”, ISWC 2005