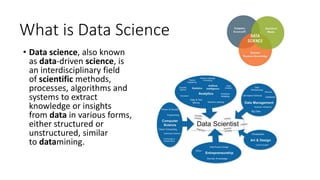
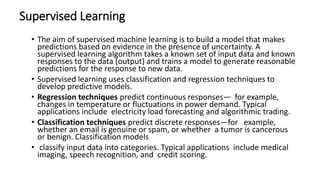
What is Data Science
• Data science, also known
as data-driven science, is
an interdisciplinary field
of scientific methods,
processes, algorithms and
systems to extract
knowledge or insights
from data in various forms,
either structured or
unstructured, similar
to datamining.
Need for DataScientists & Job opportunities
• Data volume is increasing in enterprises because of transactional data,
internet and mobile apps
• Decision making will have to be fast and accurate and should be
available at the point of need
• Without analytics its impossible to run large enterprises like Amazon,
Flipkart, Reliance Jio, Airtel, Citi Bank, Unilever, P&G, Google, IBM,
Microsoft, Alibaba, eBay, Tesco, Metro cash, Walmart…
• There is insufficient number of personnel skilled in analytics where as
demand is more
• Opportunities in Startups, IoT, Consumer Goods, eCommerce, KPOs,
BPOs, Telecom, B&F, Logistics, Utilities…
• Just browse through Naukri, Shine, Monster etc
What is Machine Learning?
• Machine learning teaches computers to do what comes naturally to
humans and animals: learn from experience.
• Machine learning algorithms use computational methods to “learn”
information directly from data without relying on a predetermined
equation as a model.
• The algorithms adaptively improve their performance as the number of
samples available for learning increases.
Real-World Applications
 With the rise in big data, machine learning has become particularly important
for solving problems in areas like these:
 Computational finance, for credit scoring and algorithmic trading
 Image processing and computer vision, for face recognition, motion
detection, and object detection
 Computational biology, for tumor detection, drug discovery, and DNA
sequencing
 Energy production, for price and load forecasting
 Automotive, aerospace, and manufacturing, for predictive maintenance
 Natural language processing
How Machine Learning Works
• Machine learning uses
two types of
techniques: supervised
learning, which trains a
model on known input
and output data so
that it can predict
future outputs, and
unsupervised learning,
which finds hidden
patterns or intrinsic
structures in input
data.
How Do You Decide Which Algorithm to Use?
• Algorithm
selection also
depends on
the size and
type of data
you’re
working with,
the insights
you want to
get from the
data, and how
those insights
will be used
When Should You Use Machine Learning?
• you have a complex task or problem involving a large
amount of data and lots of variables, but no existing
formula or equation
• Hand-written rules and equations are too complex—as in
face recognition and speech recognition
• The rules of a task are constantly changing—as in fraud
detection from transaction records.
• The nature of the data keeps changing, and the program
needs to adapt—as in automated trading,energy demand
forecasting, and predicting shopping trends.
Supervised Learning
• The aim of supervised machine learning is to build a model that makes
predictions based on evidence in the presence of uncertainty. A
supervised learning algorithm takes a known set of input data and known
responses to the data (output) and trains a model to generate reasonable
predictions for the response to new data.
• Supervised learning uses classification and regression techniques to
develop predictive models.
• Regression techniques predict continuous responses— for example,
changes in temperature or fluctuations in power demand. Typical
applications include electricity load forecasting and algorithmic trading.
• Classification techniques predict discrete responses—for example,
whether an email is genuine or spam, or whether a tumor is cancerous
or benign. Classification models
• classify input data into categories. Typical applications include medical
imaging, speech recognition, and credit scoring.
Unsupervised Learning
• Unsupervised learning finds hidden patterns or intrinsic structures in
data. It is used to draw inferences from datasets consisting of input
data without labeled responses.
• Clustering is the most common unsupervised learning technique. It is
used for exploratory data analysis to find hidden patterns or groupings
in data. Applications for clustering include gene sequence analysis,
market research, and object recognition.
Common Dimensionality Reduction Techniques
Why R?
• Free Software
• Versatile and crowd sourced for development
• Handle multiple platform
• End to End service in Data Science
• Functionality is divided into a number of packages
• Variety of analytical techniques 7000+ algorithms
• No restriction in length of column
• Integrates with other software
29
Data Types in R
• Vectors
• Matrices
• Arrays
• List
• DataFrame
30
Objects
• character
• numeric (real numbers)
• Integer
• Complex
• logical (True/False)
31
Data Operators
• Arithmetic+-*/%^
• Relational >=,<=,==,!=
• Logical ! and &
• Model Formula D ~ I
• Assignment = or <-
• List Index $
• Sequence :
32
Case Study
• Multiple Linear Regression Model
• Methods: All in, Step by Step, (Forward,Backward, Bi-directional),
Score comparison
• Independent Variables: R&D Spend, Administration, Marketing
Spend
• Dependent Variable: Profit
• Training Data 80% & Test Data 20%
33

What is Machine Learning.pptx

  • 1.
    What is DataScience • Data science, also known as data-driven science, is an interdisciplinary field of scientific methods, processes, algorithms and systems to extract knowledge or insights from data in various forms, either structured or unstructured, similar to datamining.
  • 2.
    Need for DataScientists& Job opportunities • Data volume is increasing in enterprises because of transactional data, internet and mobile apps • Decision making will have to be fast and accurate and should be available at the point of need • Without analytics its impossible to run large enterprises like Amazon, Flipkart, Reliance Jio, Airtel, Citi Bank, Unilever, P&G, Google, IBM, Microsoft, Alibaba, eBay, Tesco, Metro cash, Walmart… • There is insufficient number of personnel skilled in analytics where as demand is more • Opportunities in Startups, IoT, Consumer Goods, eCommerce, KPOs, BPOs, Telecom, B&F, Logistics, Utilities… • Just browse through Naukri, Shine, Monster etc
  • 7.
    What is MachineLearning? • Machine learning teaches computers to do what comes naturally to humans and animals: learn from experience. • Machine learning algorithms use computational methods to “learn” information directly from data without relying on a predetermined equation as a model. • The algorithms adaptively improve their performance as the number of samples available for learning increases.
  • 8.
    Real-World Applications  Withthe rise in big data, machine learning has become particularly important for solving problems in areas like these:  Computational finance, for credit scoring and algorithmic trading  Image processing and computer vision, for face recognition, motion detection, and object detection  Computational biology, for tumor detection, drug discovery, and DNA sequencing  Energy production, for price and load forecasting  Automotive, aerospace, and manufacturing, for predictive maintenance  Natural language processing
  • 9.
    How Machine LearningWorks • Machine learning uses two types of techniques: supervised learning, which trains a model on known input and output data so that it can predict future outputs, and unsupervised learning, which finds hidden patterns or intrinsic structures in input data.
  • 10.
    How Do YouDecide Which Algorithm to Use? • Algorithm selection also depends on the size and type of data you’re working with, the insights you want to get from the data, and how those insights will be used
  • 11.
    When Should YouUse Machine Learning? • you have a complex task or problem involving a large amount of data and lots of variables, but no existing formula or equation • Hand-written rules and equations are too complex—as in face recognition and speech recognition • The rules of a task are constantly changing—as in fraud detection from transaction records. • The nature of the data keeps changing, and the program needs to adapt—as in automated trading,energy demand forecasting, and predicting shopping trends.
  • 12.
    Supervised Learning • Theaim of supervised machine learning is to build a model that makes predictions based on evidence in the presence of uncertainty. A supervised learning algorithm takes a known set of input data and known responses to the data (output) and trains a model to generate reasonable predictions for the response to new data. • Supervised learning uses classification and regression techniques to develop predictive models. • Regression techniques predict continuous responses— for example, changes in temperature or fluctuations in power demand. Typical applications include electricity load forecasting and algorithmic trading. • Classification techniques predict discrete responses—for example, whether an email is genuine or spam, or whether a tumor is cancerous or benign. Classification models • classify input data into categories. Typical applications include medical imaging, speech recognition, and credit scoring.
  • 22.
    Unsupervised Learning • Unsupervisedlearning finds hidden patterns or intrinsic structures in data. It is used to draw inferences from datasets consisting of input data without labeled responses. • Clustering is the most common unsupervised learning technique. It is used for exploratory data analysis to find hidden patterns or groupings in data. Applications for clustering include gene sequence analysis, market research, and object recognition.
  • 27.
  • 29.
    Why R? • FreeSoftware • Versatile and crowd sourced for development • Handle multiple platform • End to End service in Data Science • Functionality is divided into a number of packages • Variety of analytical techniques 7000+ algorithms • No restriction in length of column • Integrates with other software 29
  • 30.
    Data Types inR • Vectors • Matrices • Arrays • List • DataFrame 30
  • 31.
    Objects • character • numeric(real numbers) • Integer • Complex • logical (True/False) 31
  • 32.
    Data Operators • Arithmetic+-*/%^ •Relational >=,<=,==,!= • Logical ! and & • Model Formula D ~ I • Assignment = or <- • List Index $ • Sequence : 32
  • 33.
    Case Study • MultipleLinear Regression Model • Methods: All in, Step by Step, (Forward,Backward, Bi-directional), Score comparison • Independent Variables: R&D Spend, Administration, Marketing Spend • Dependent Variable: Profit • Training Data 80% & Test Data 20% 33