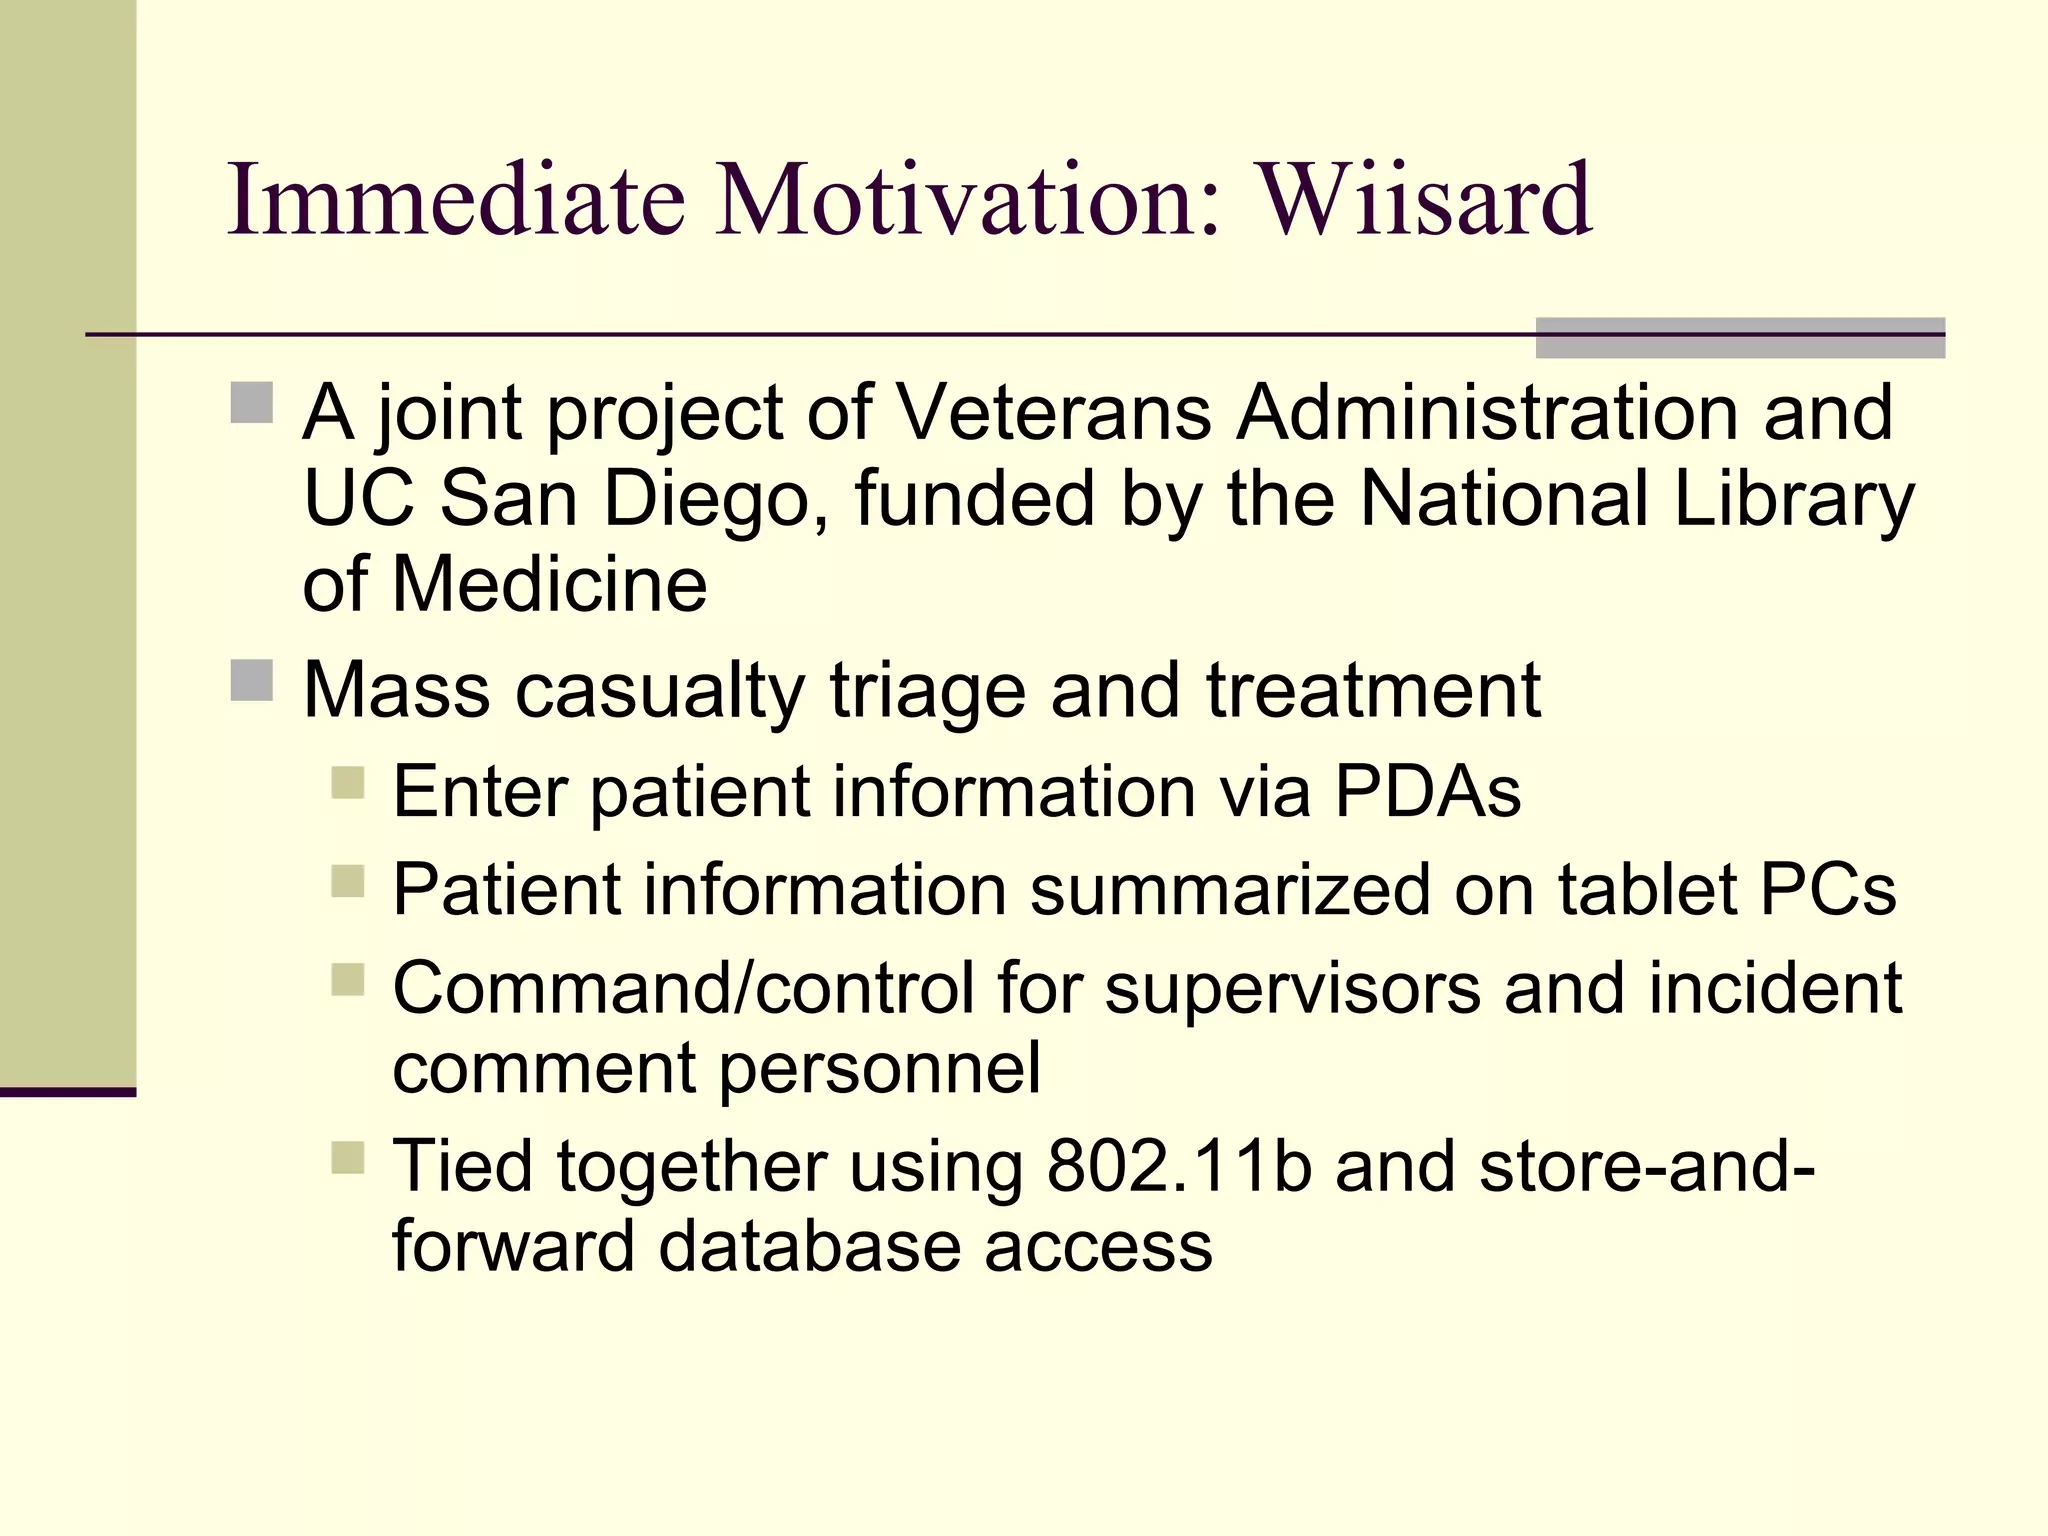
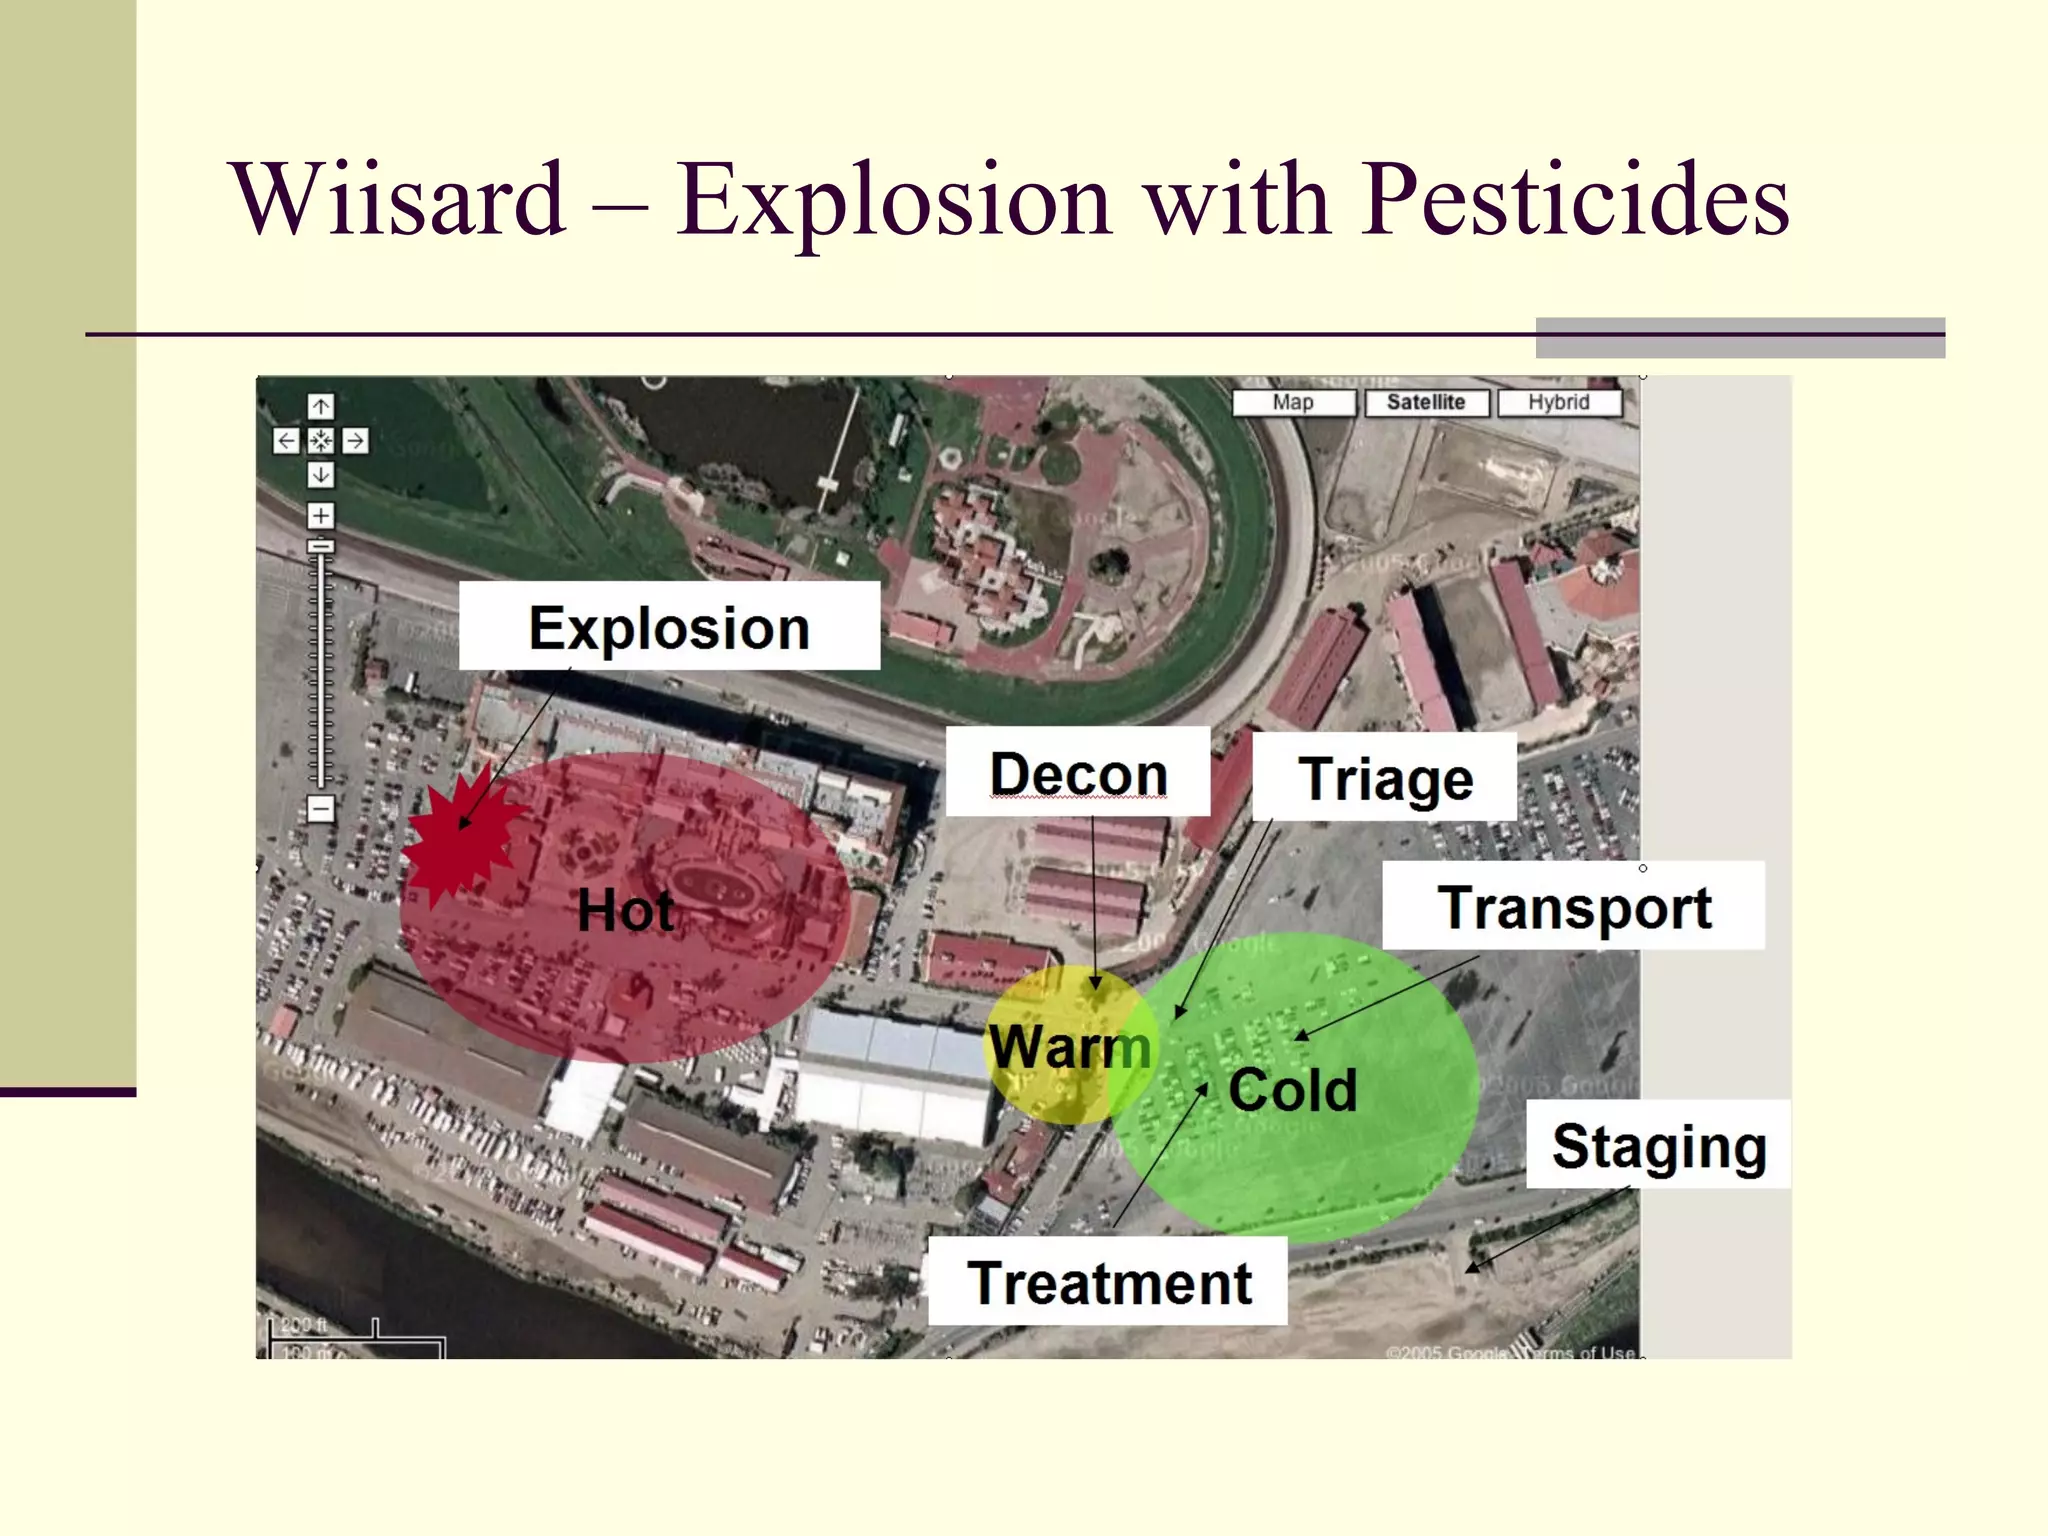
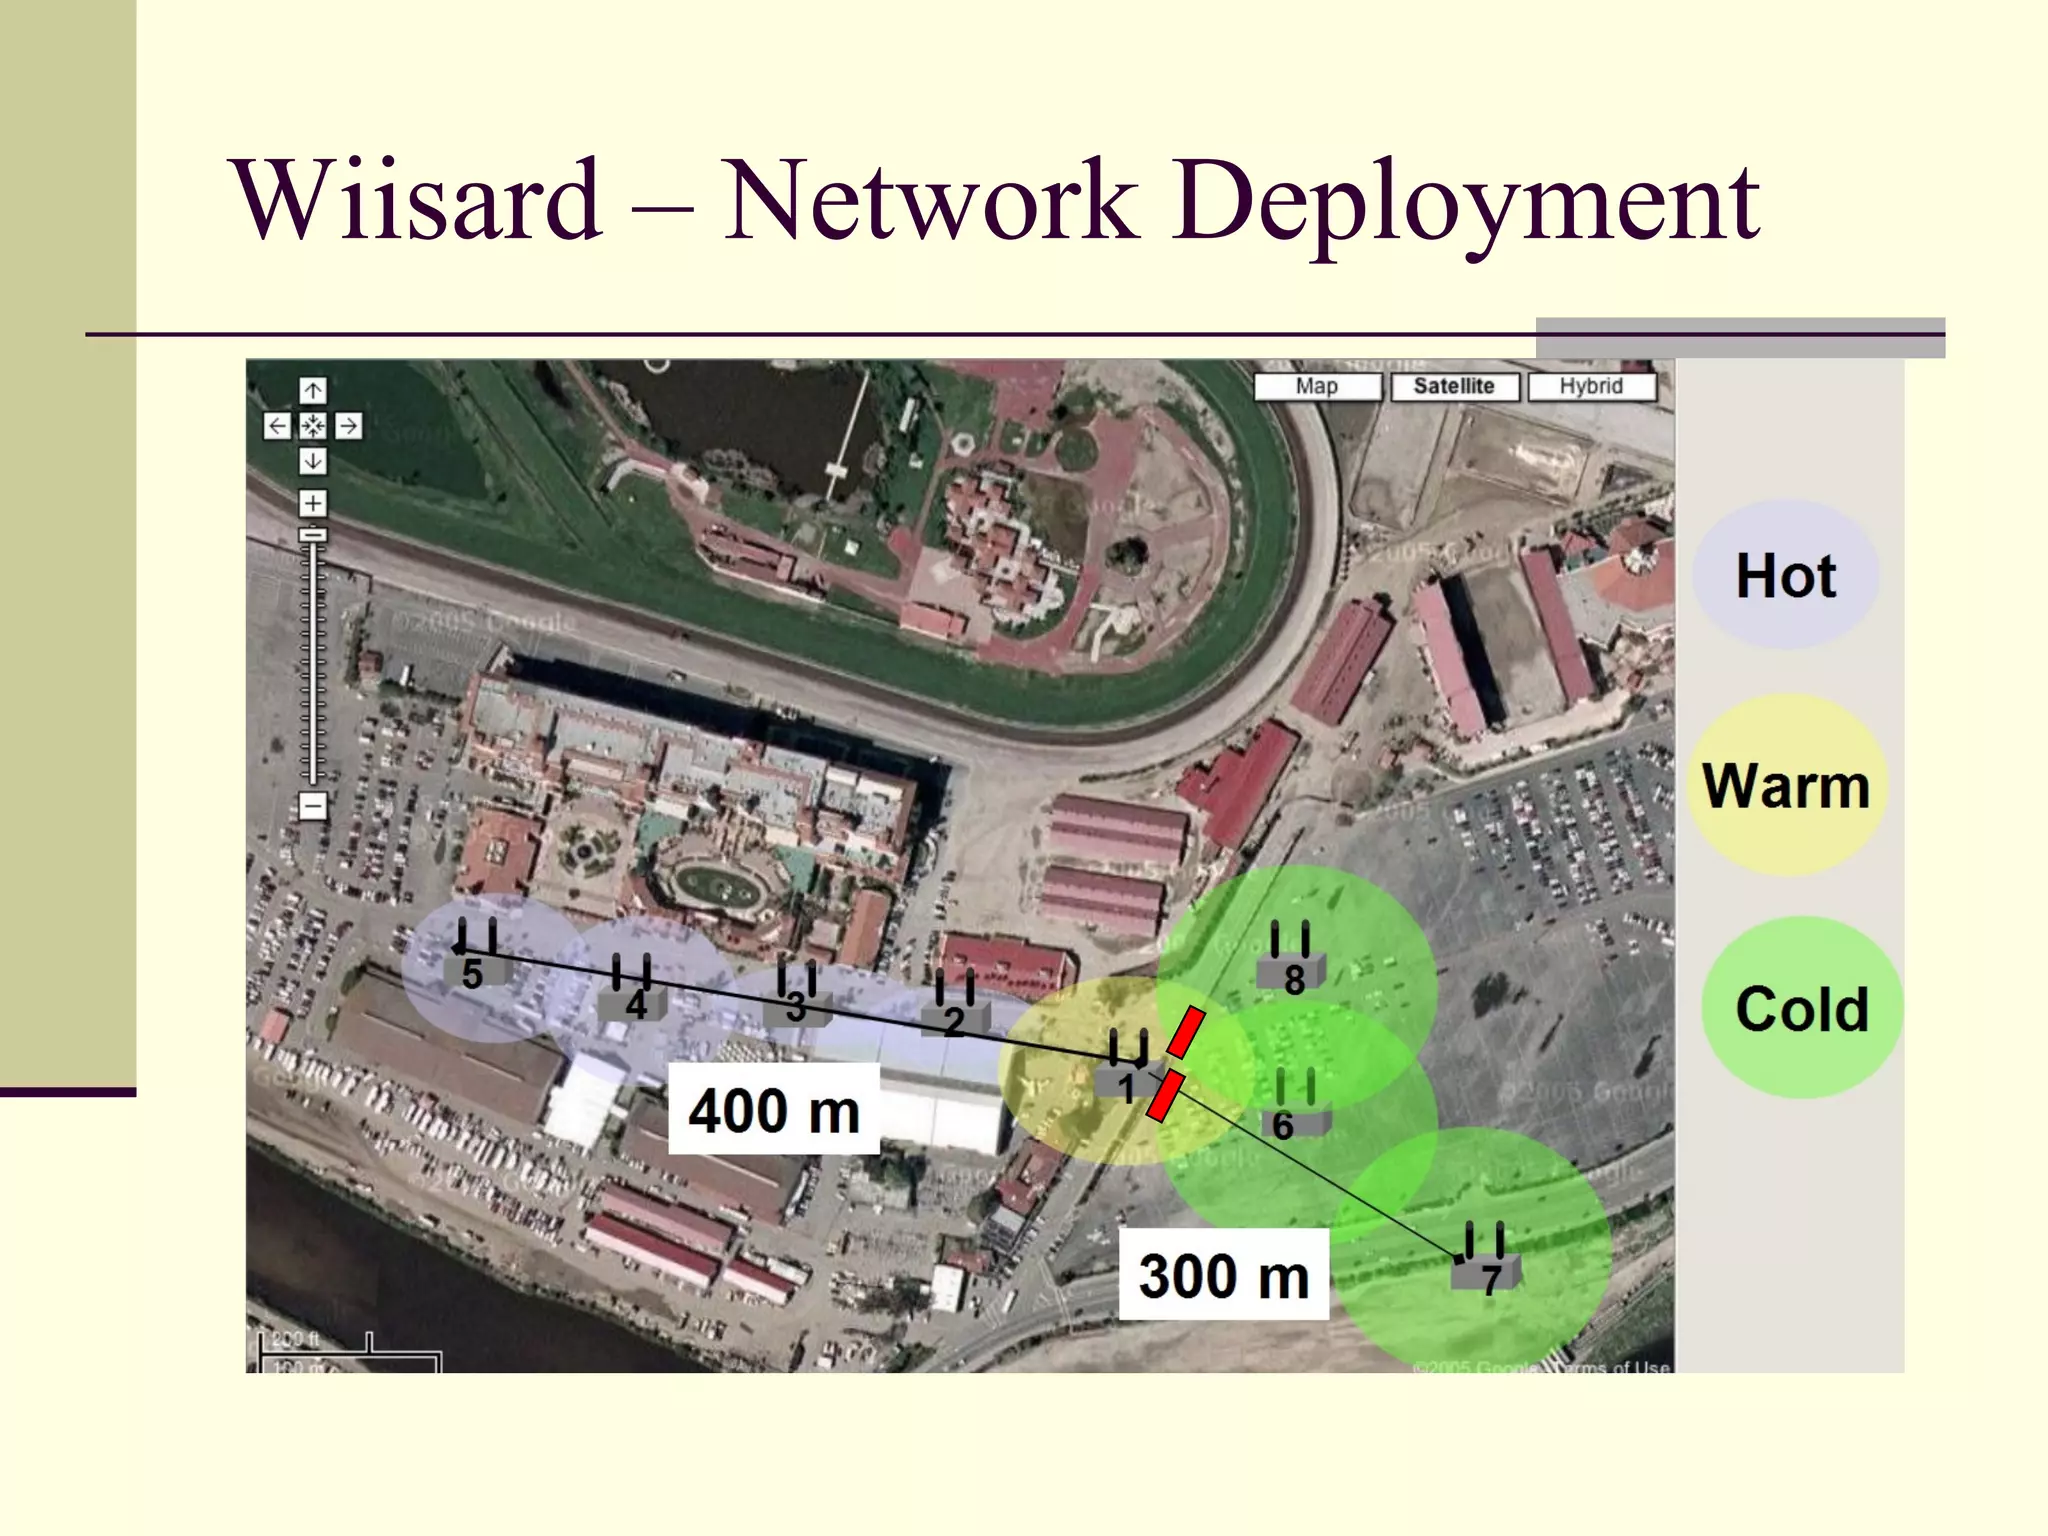
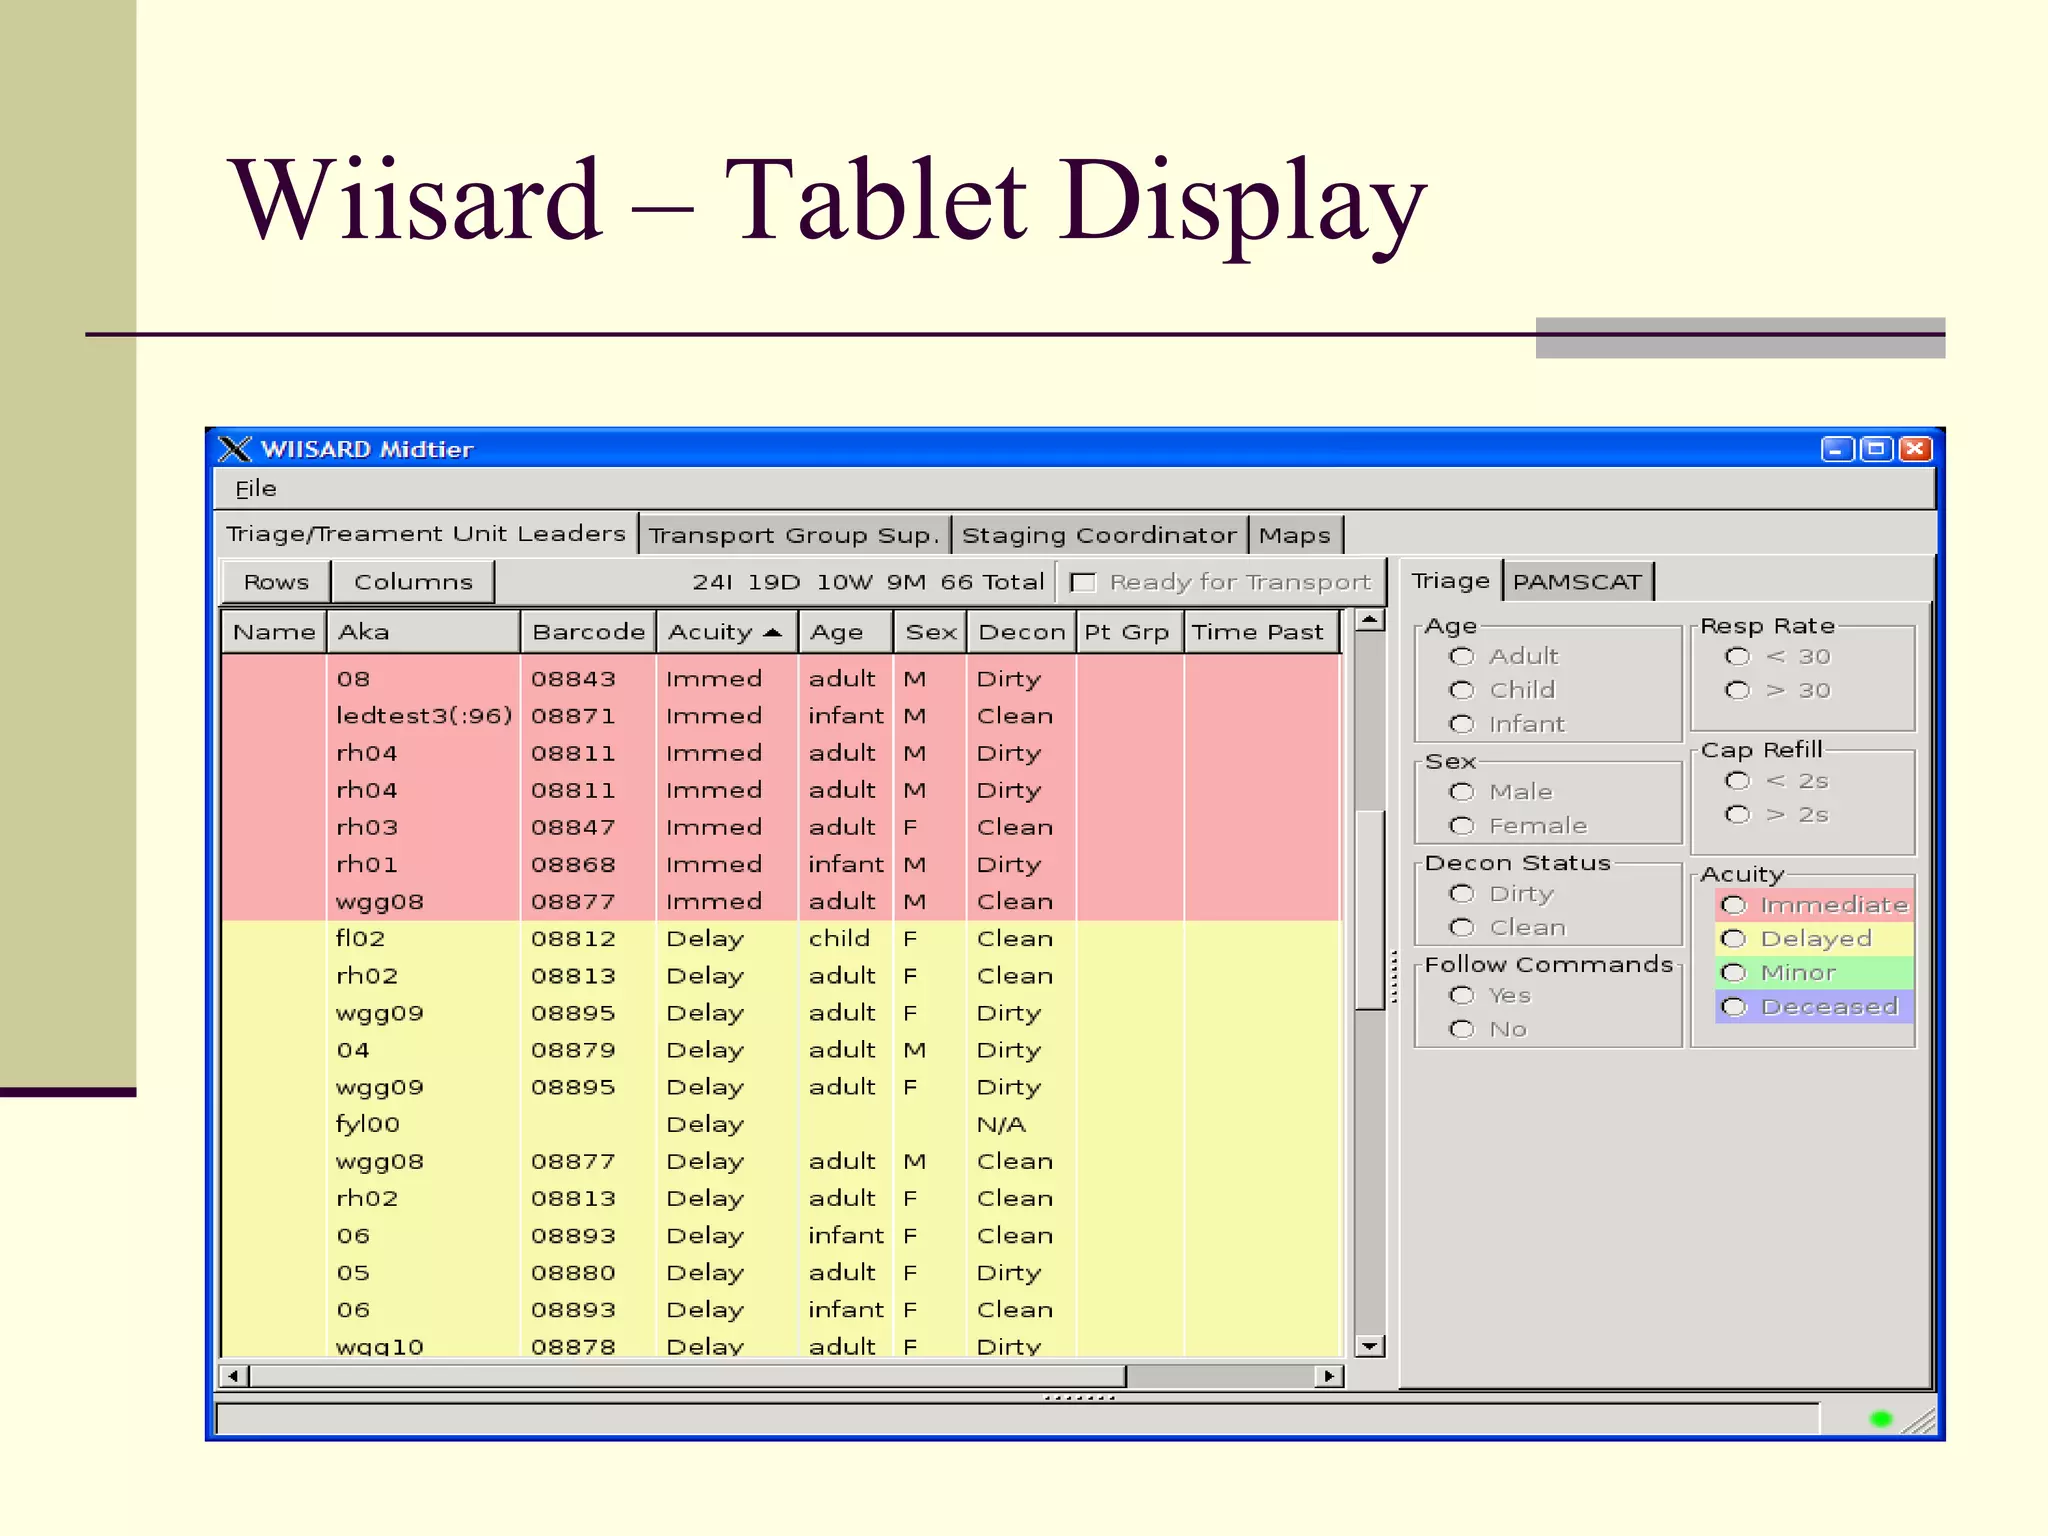
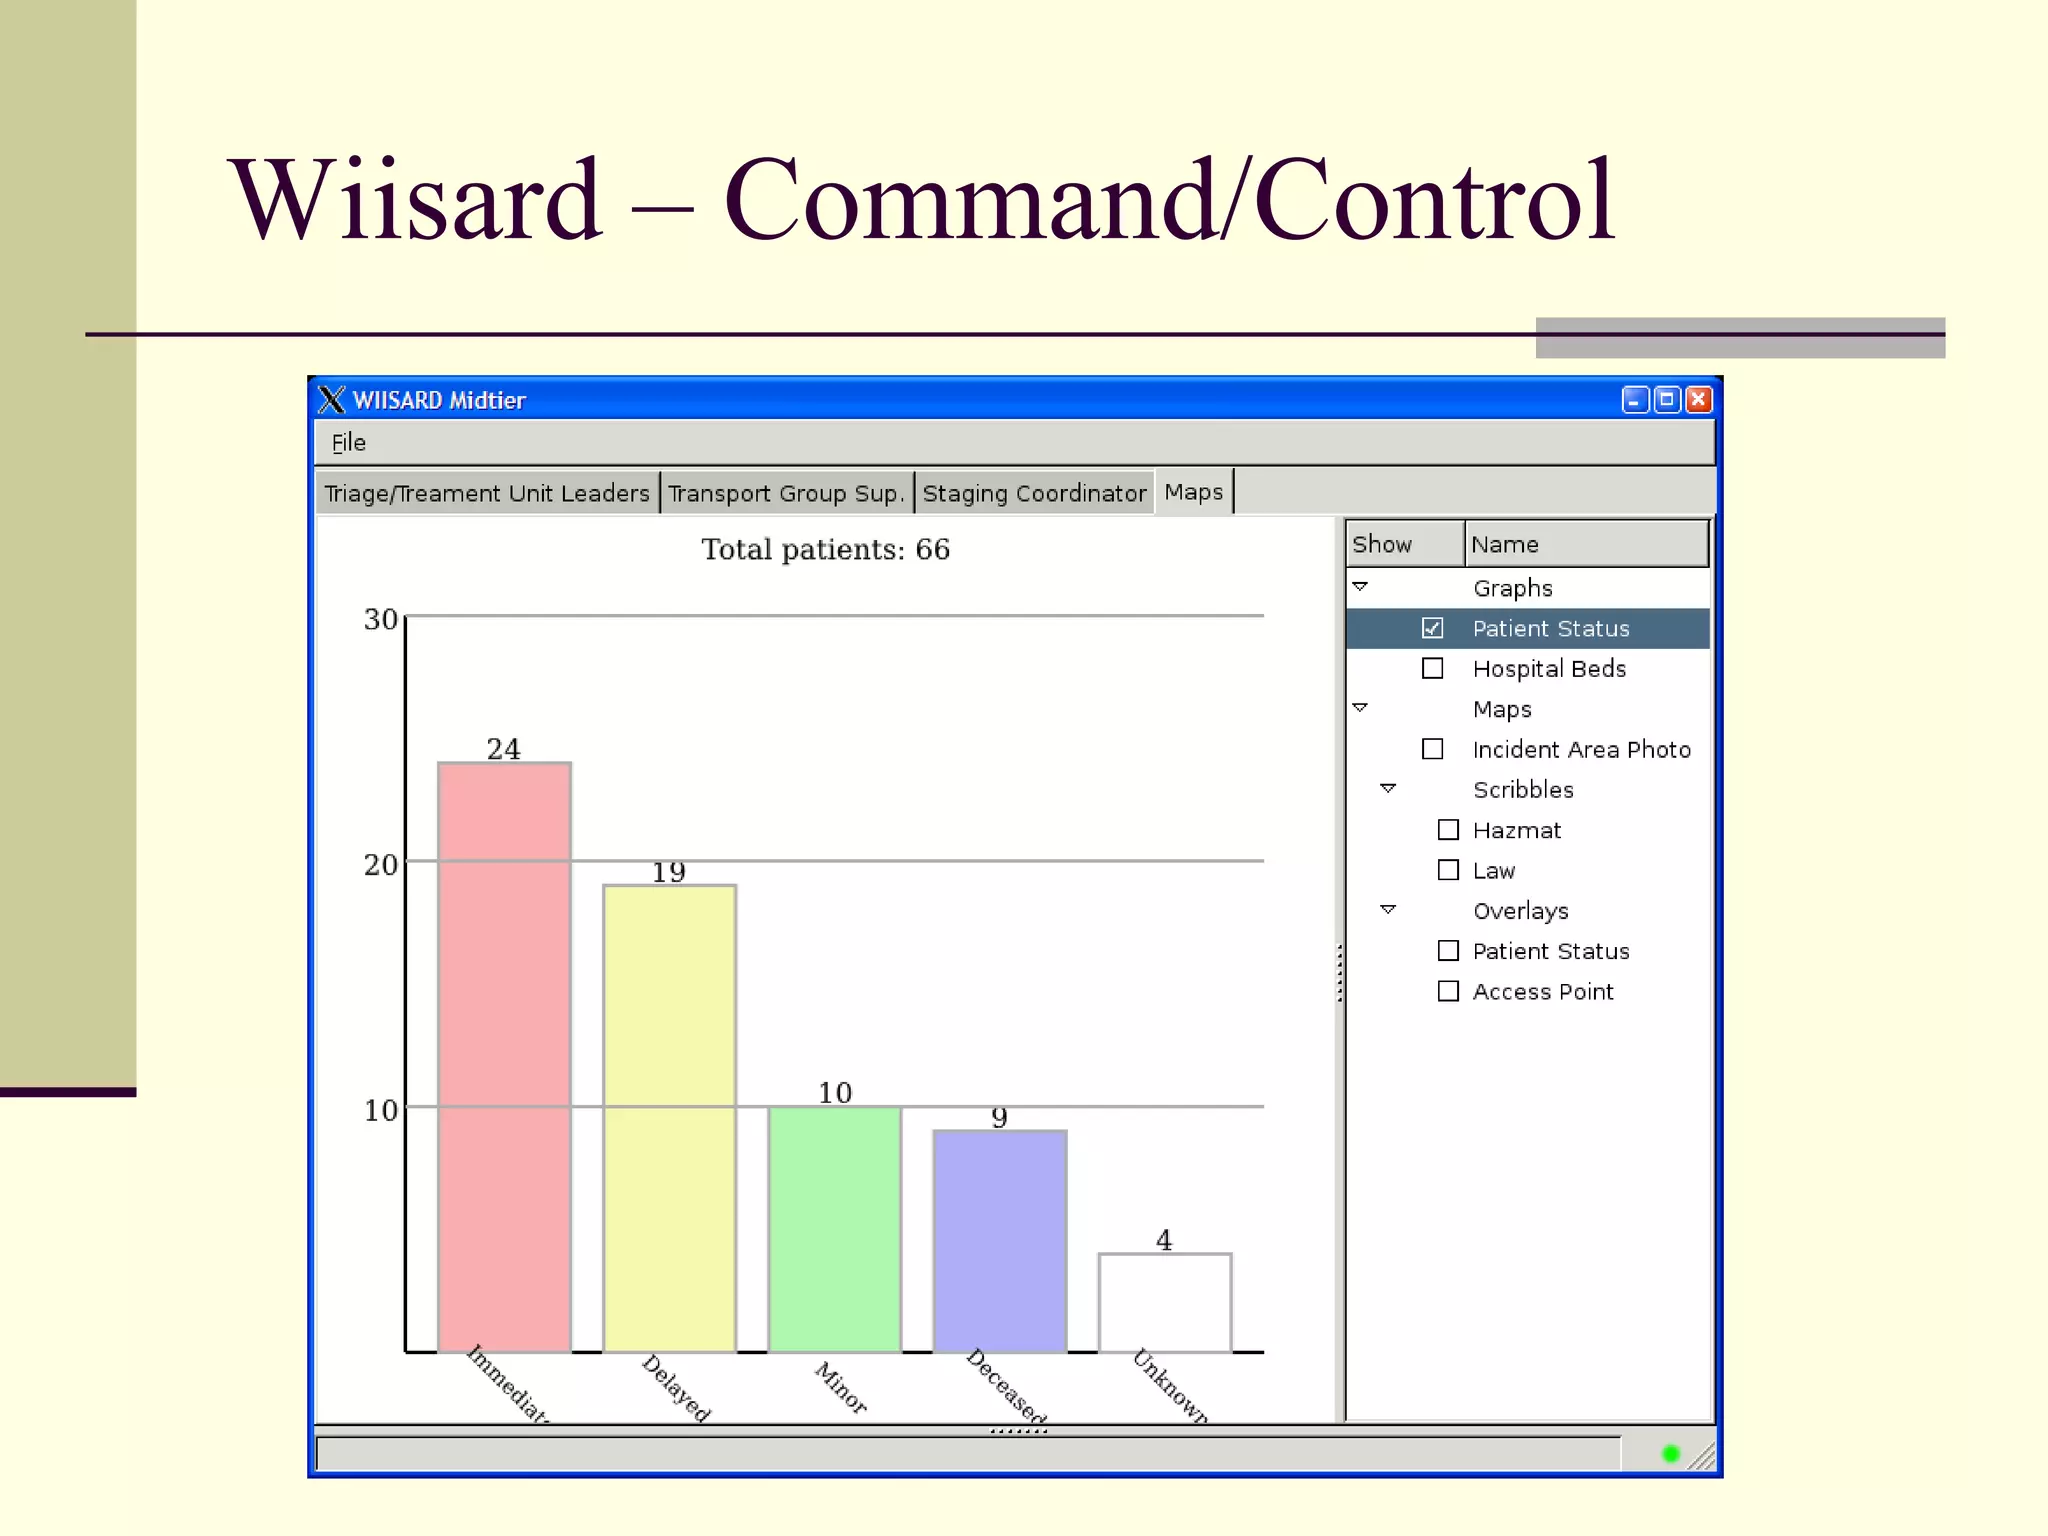
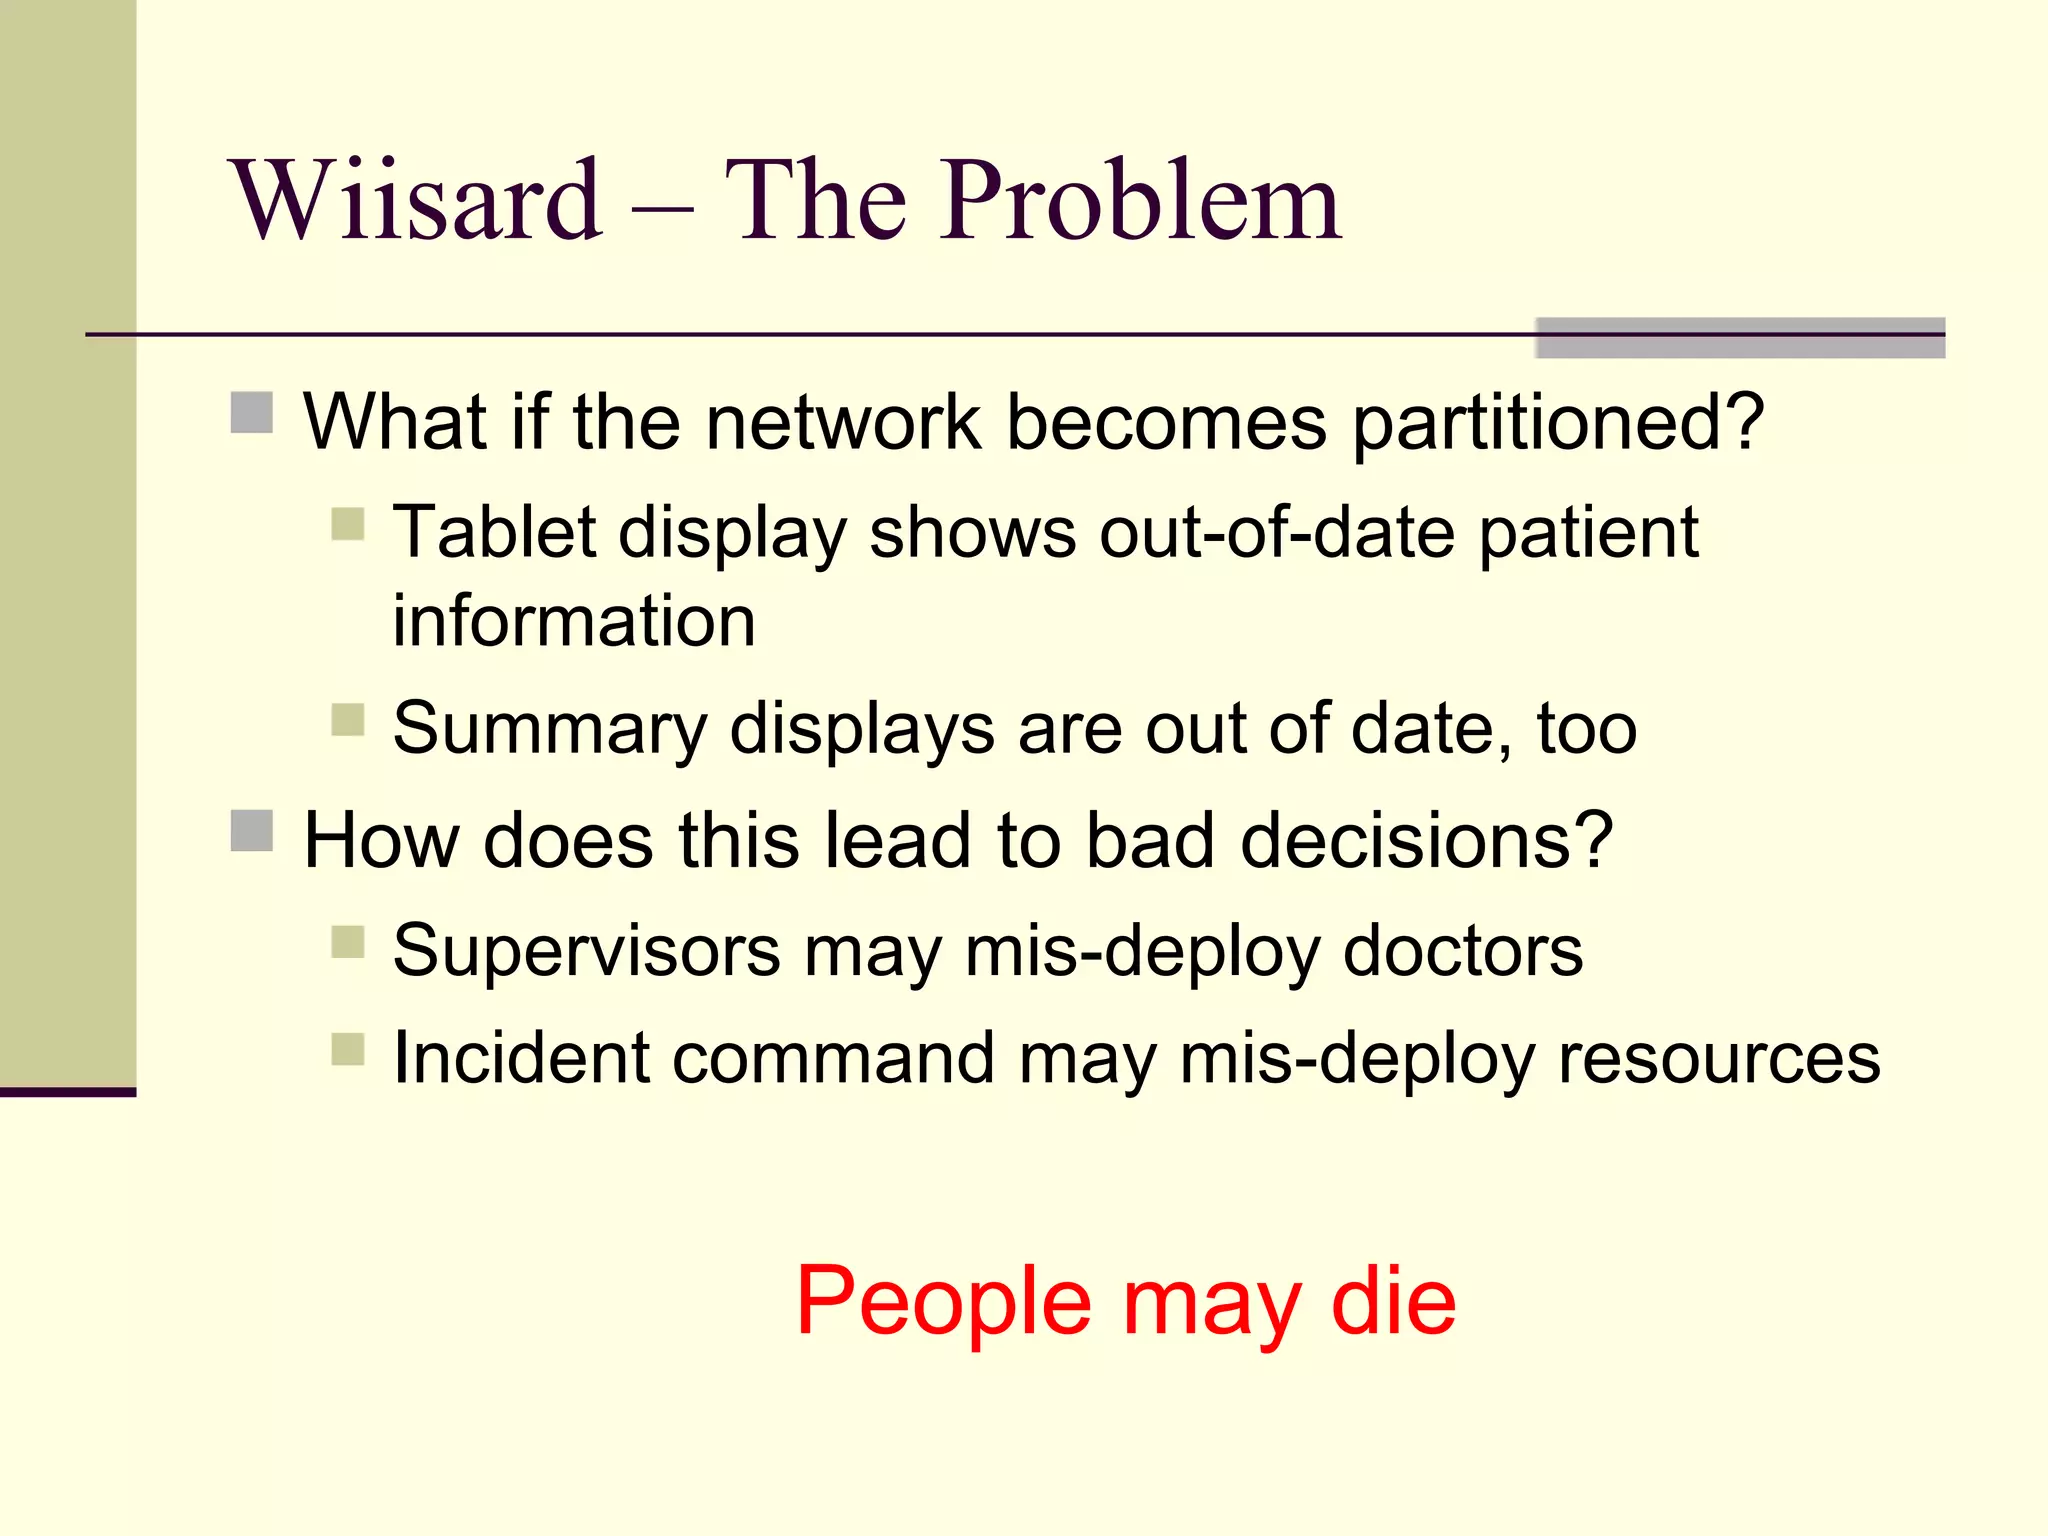
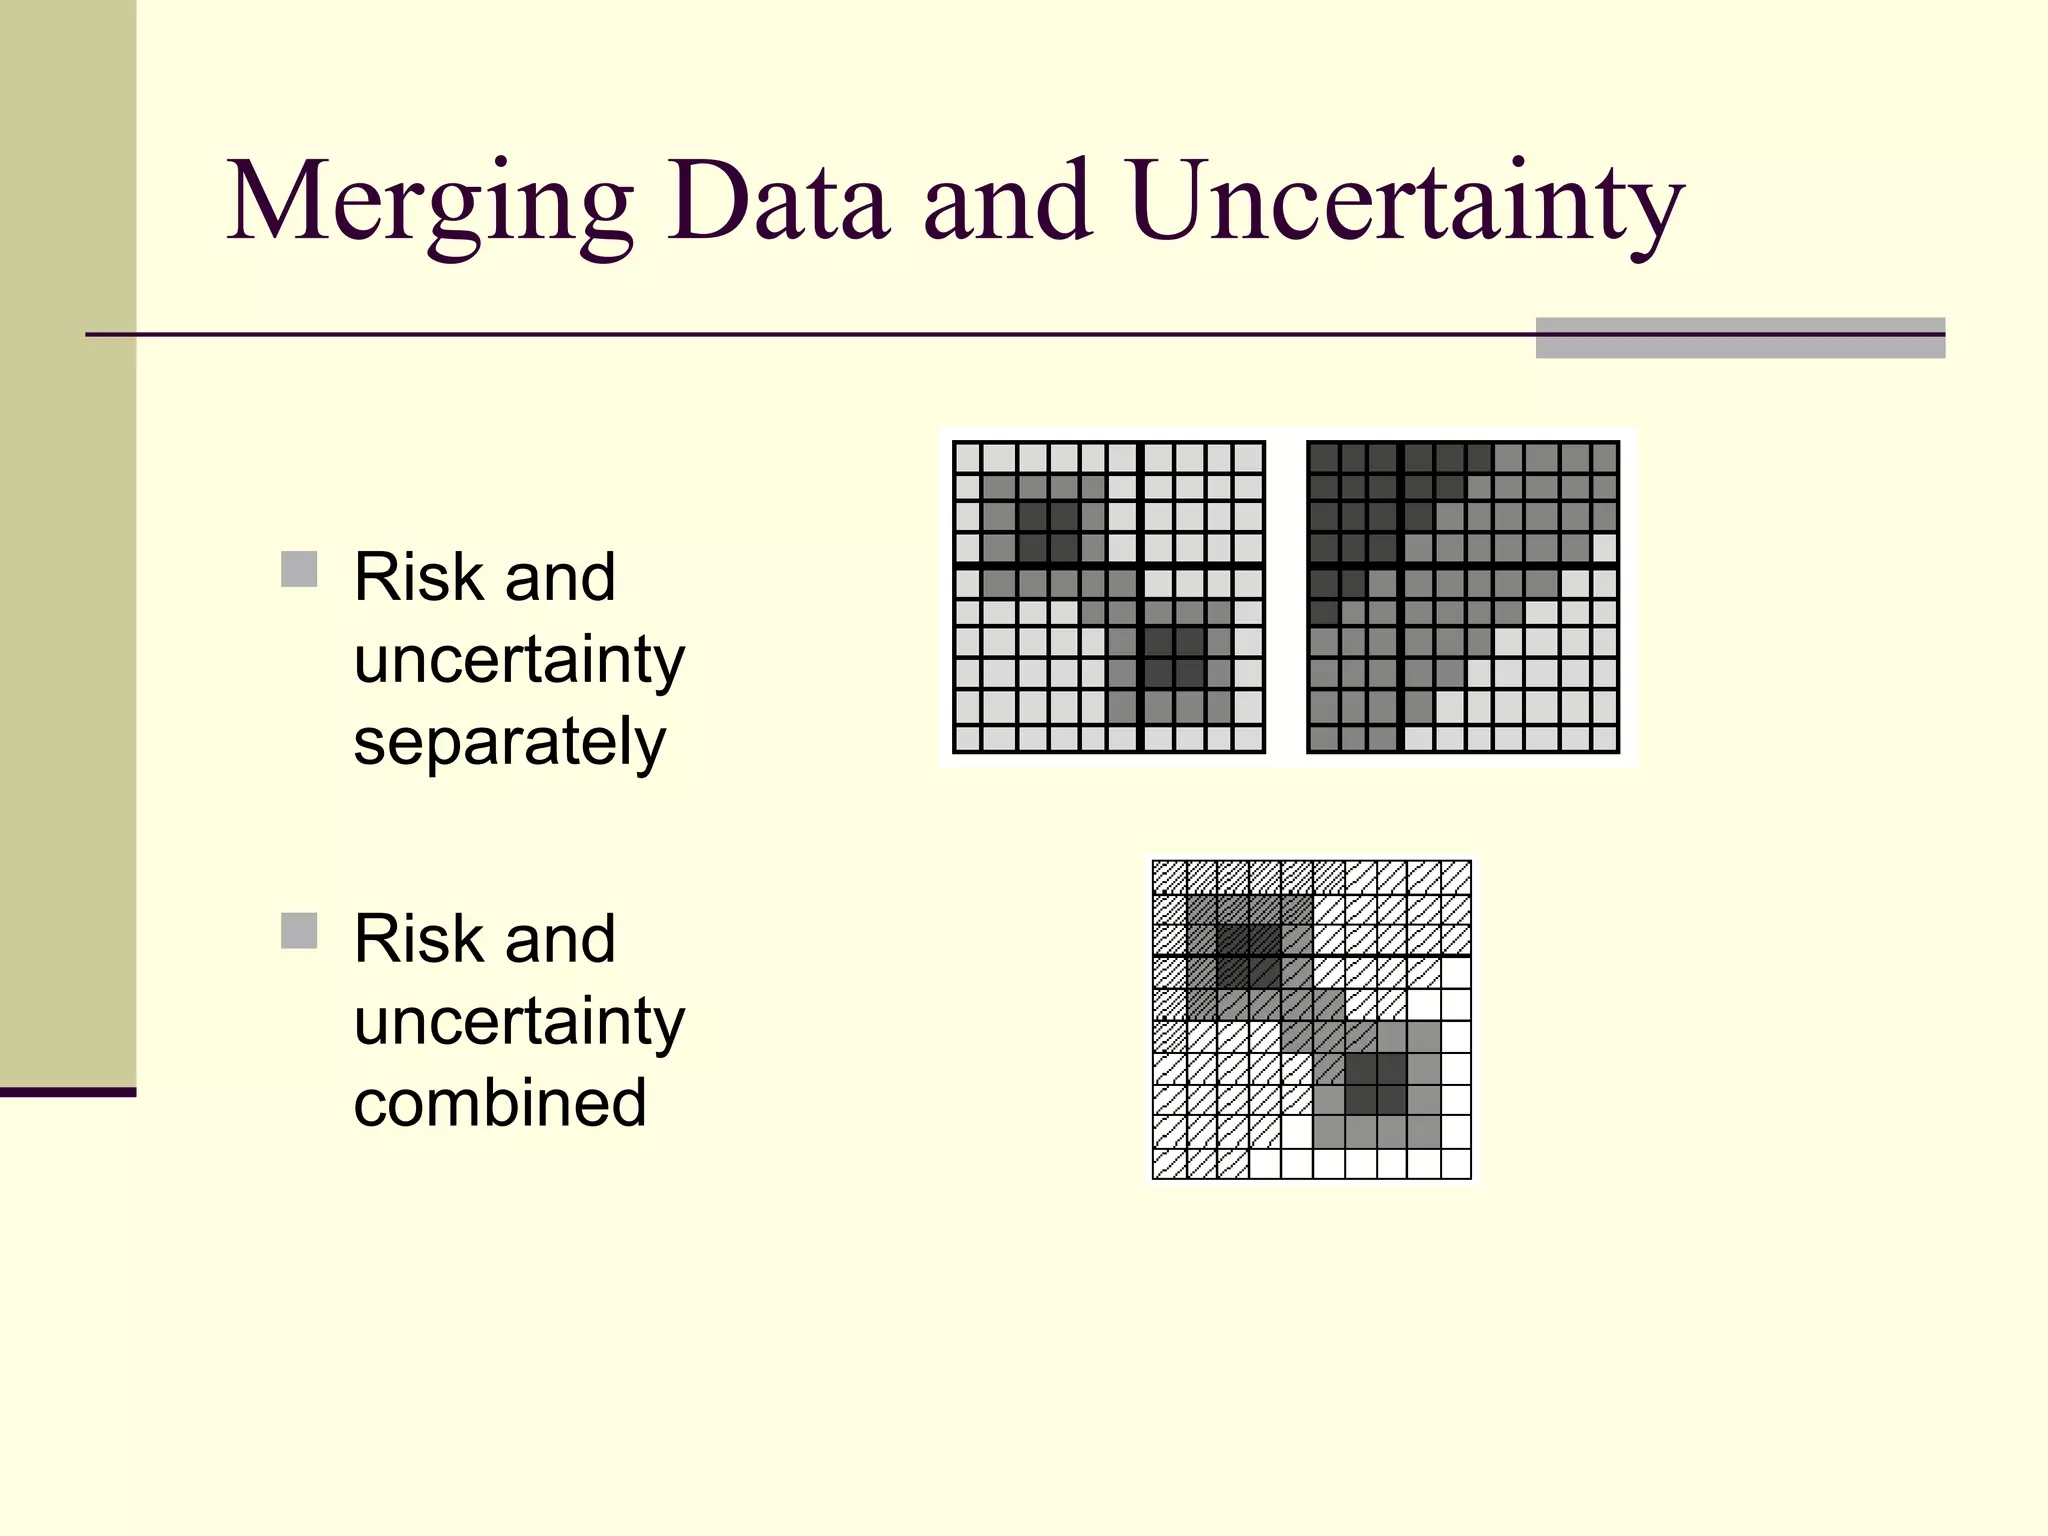
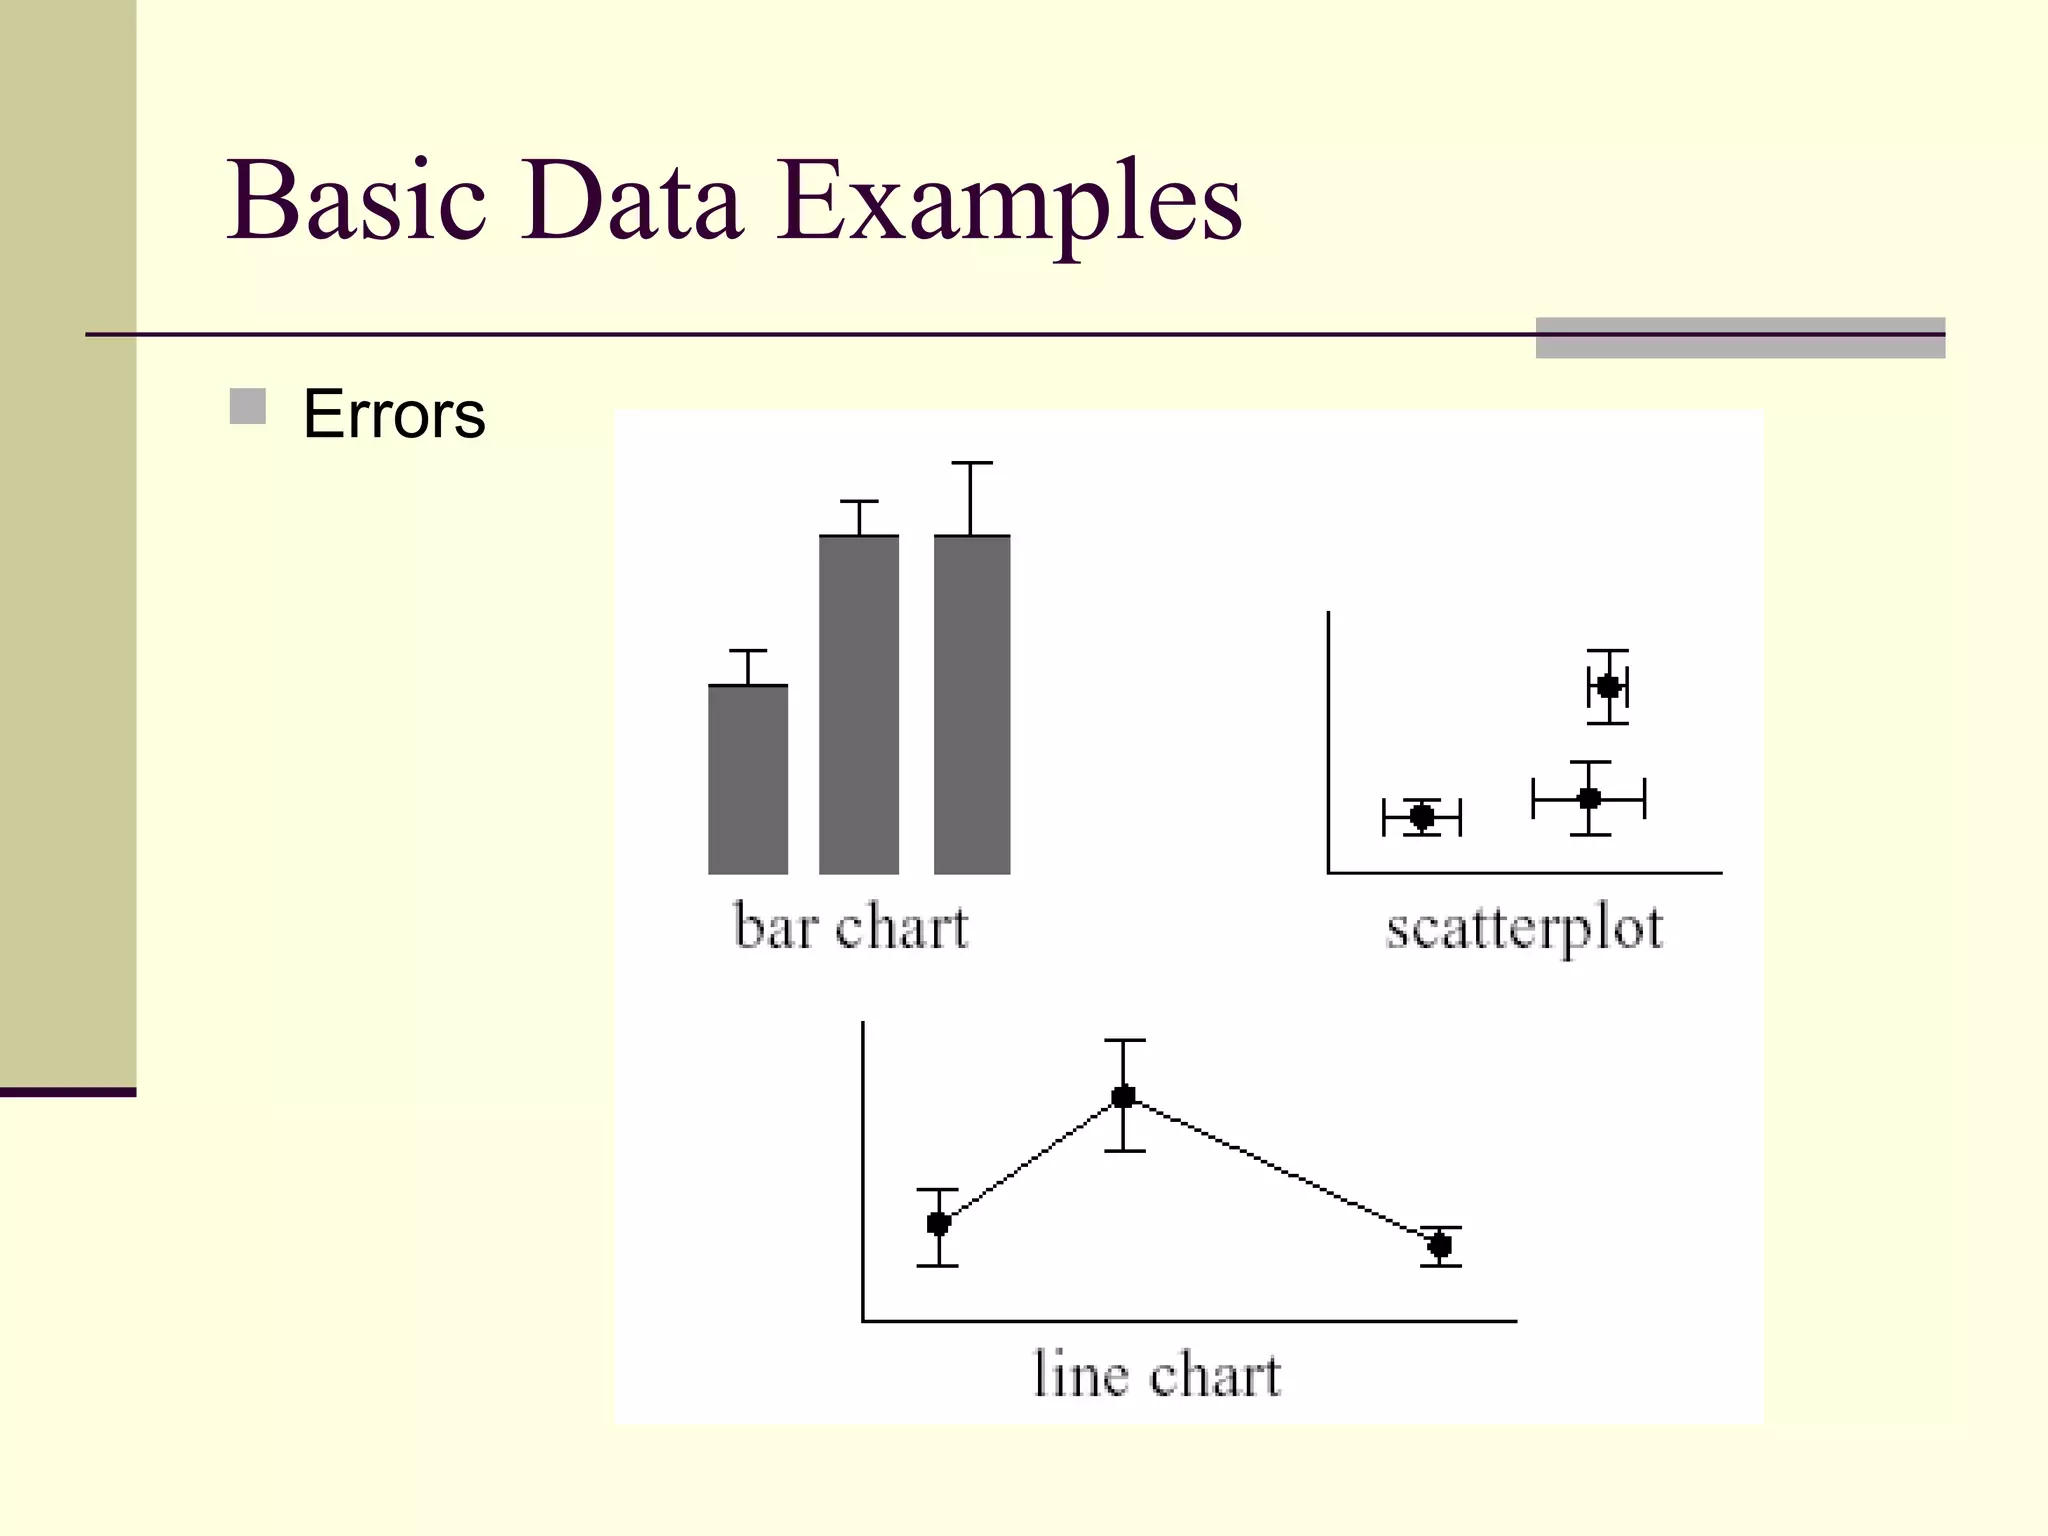
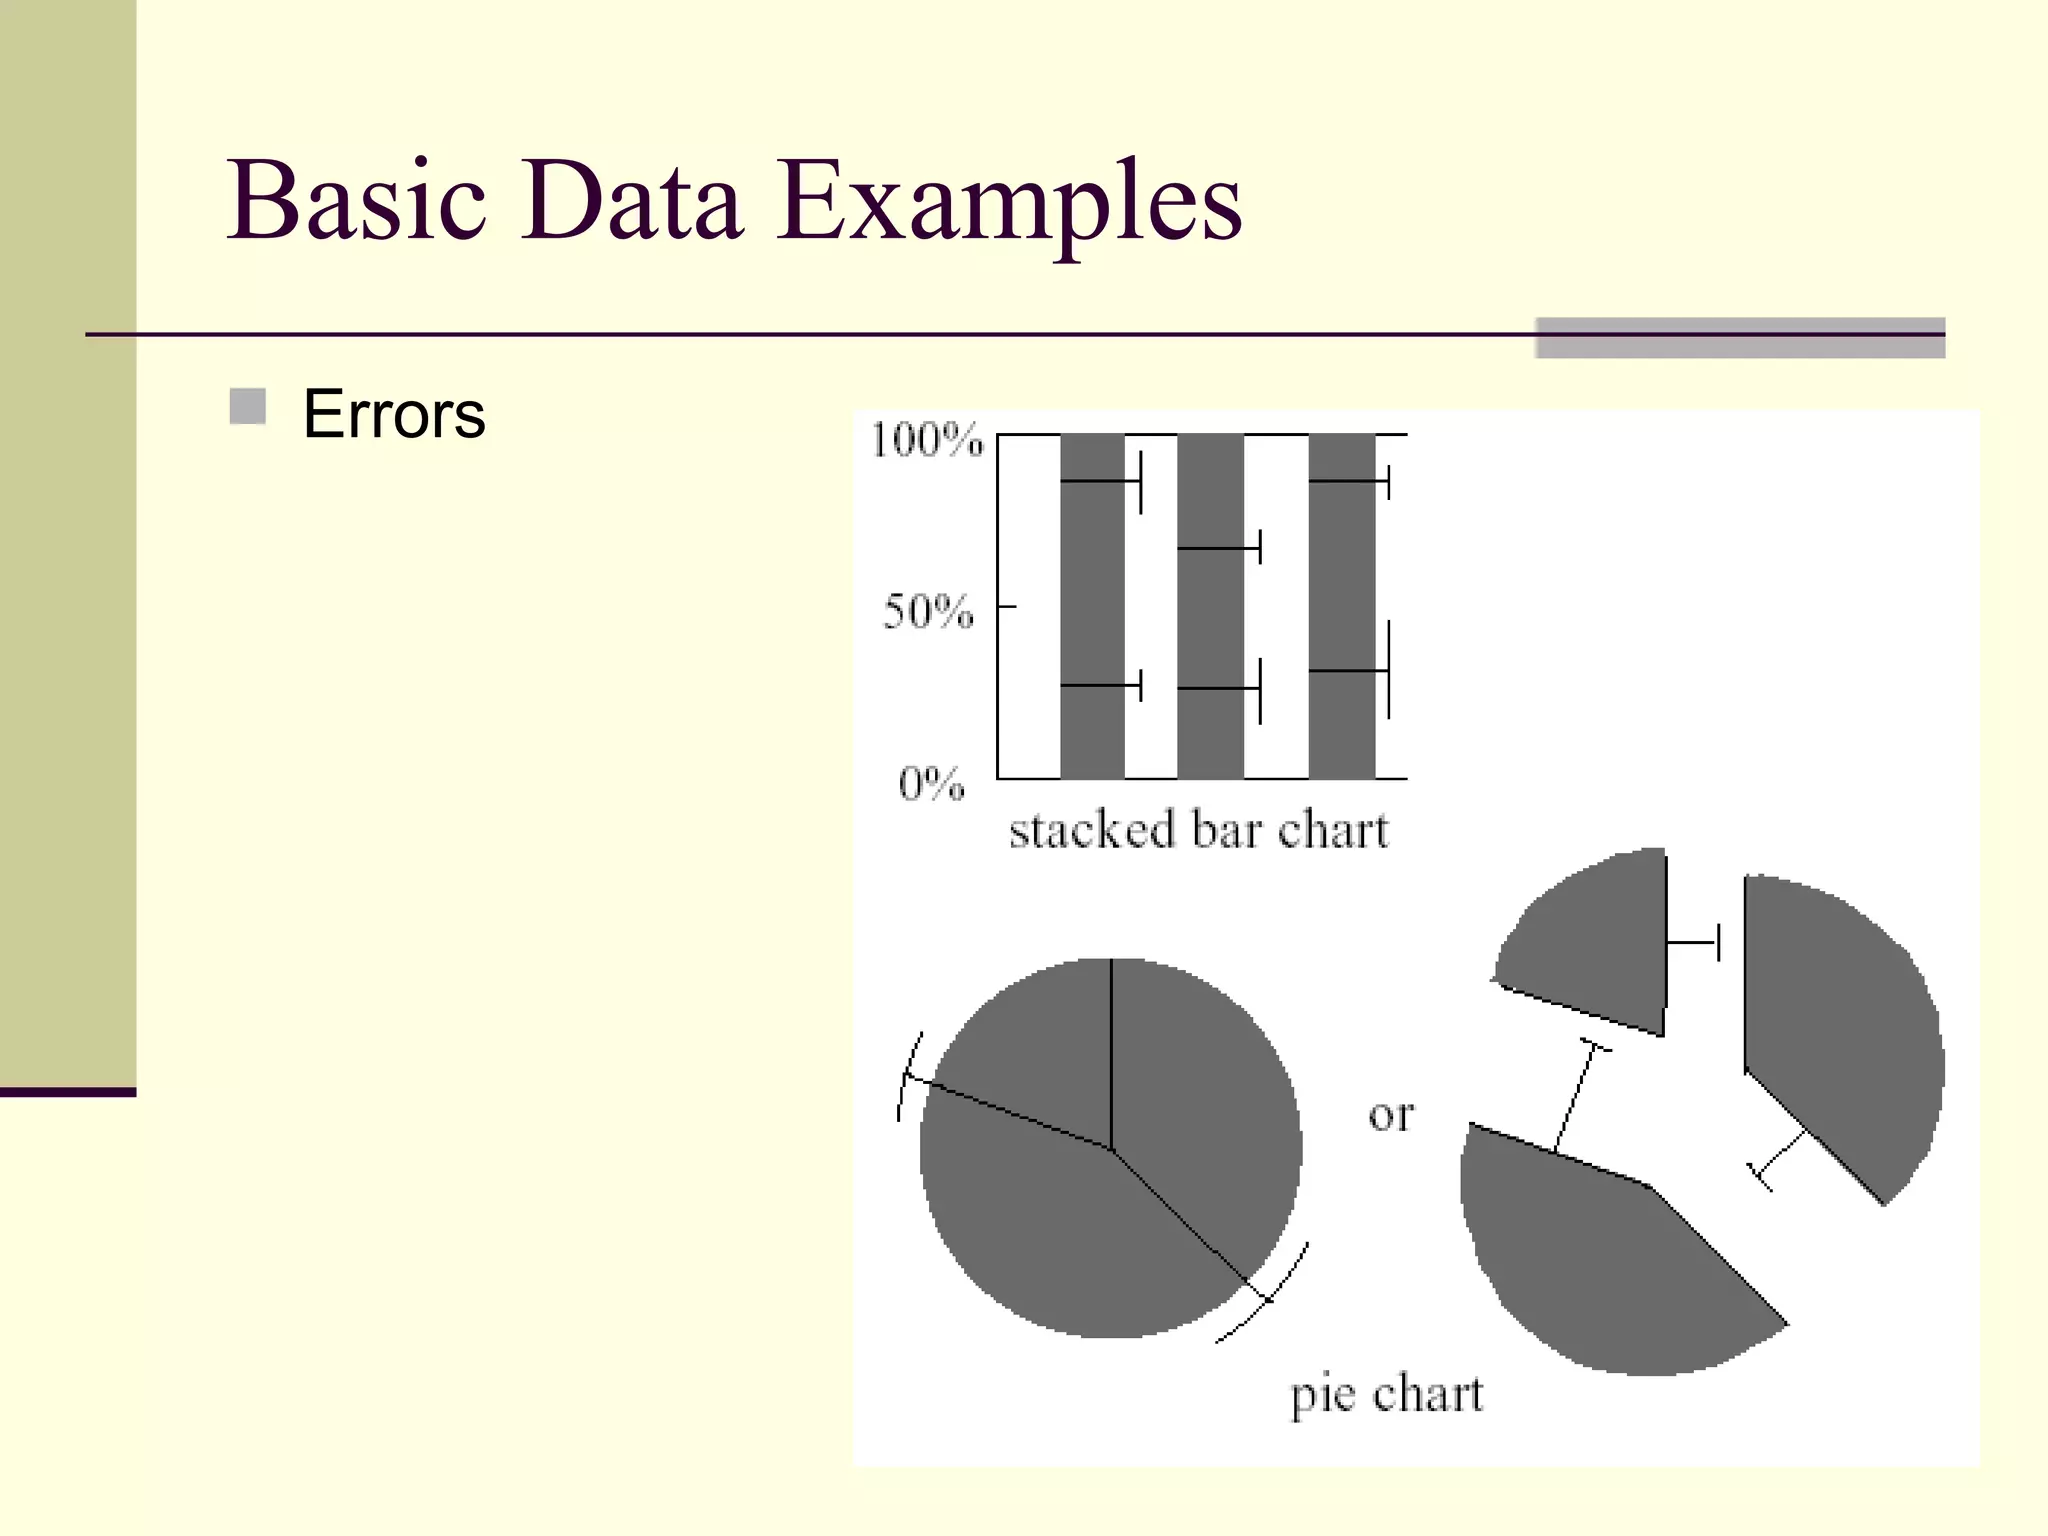
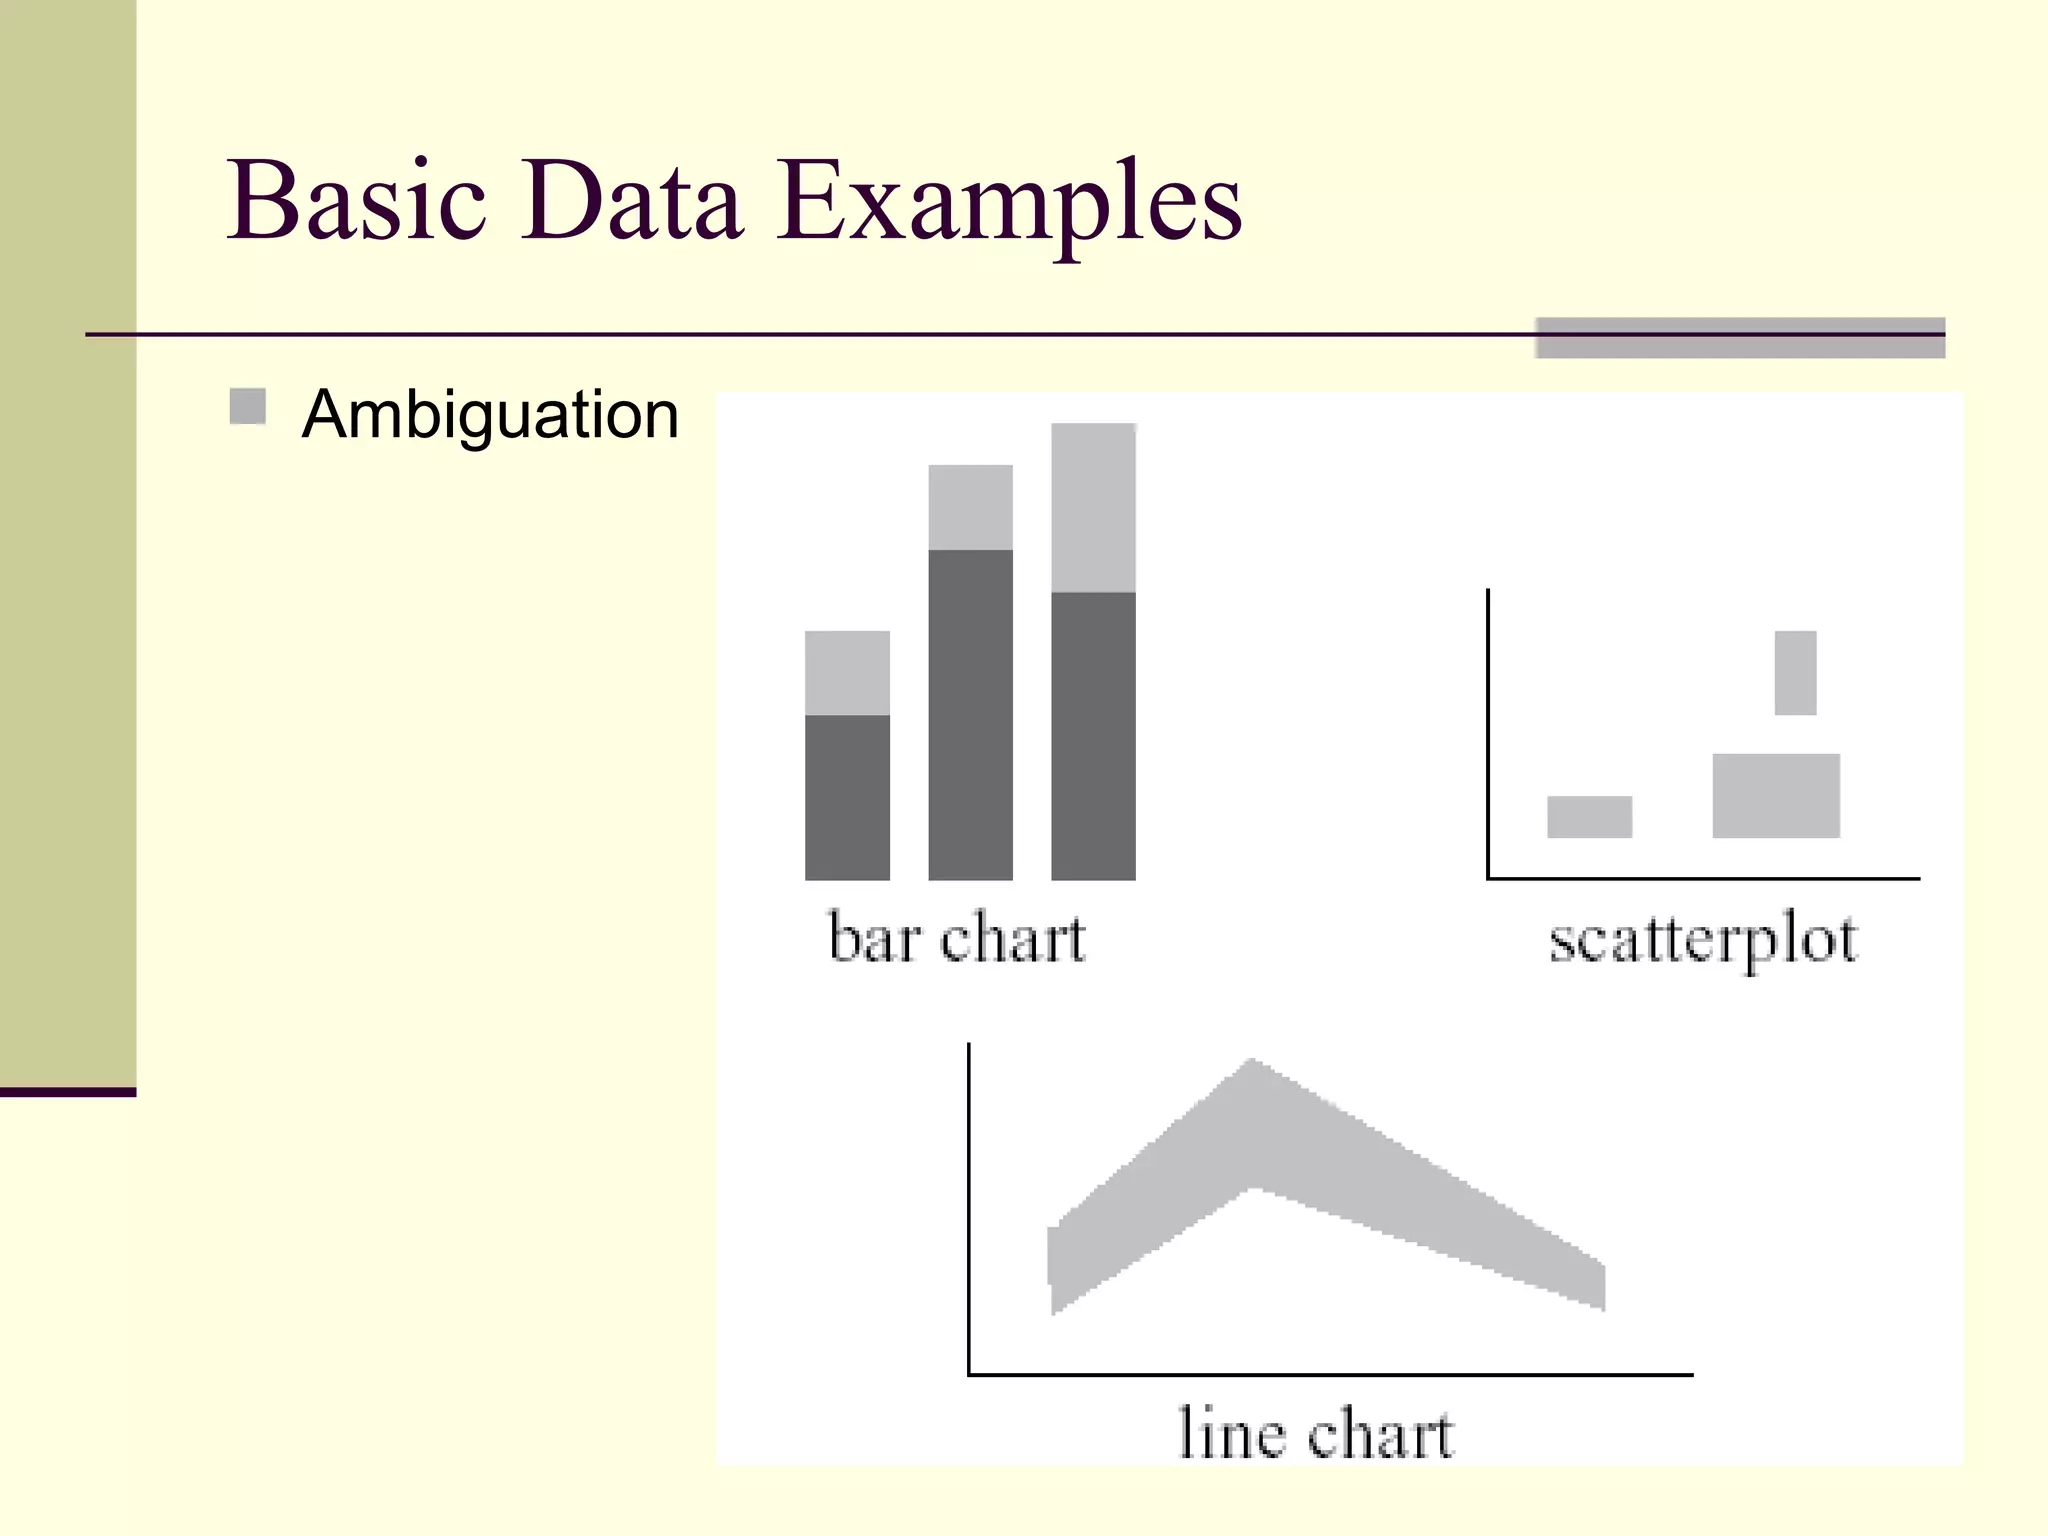
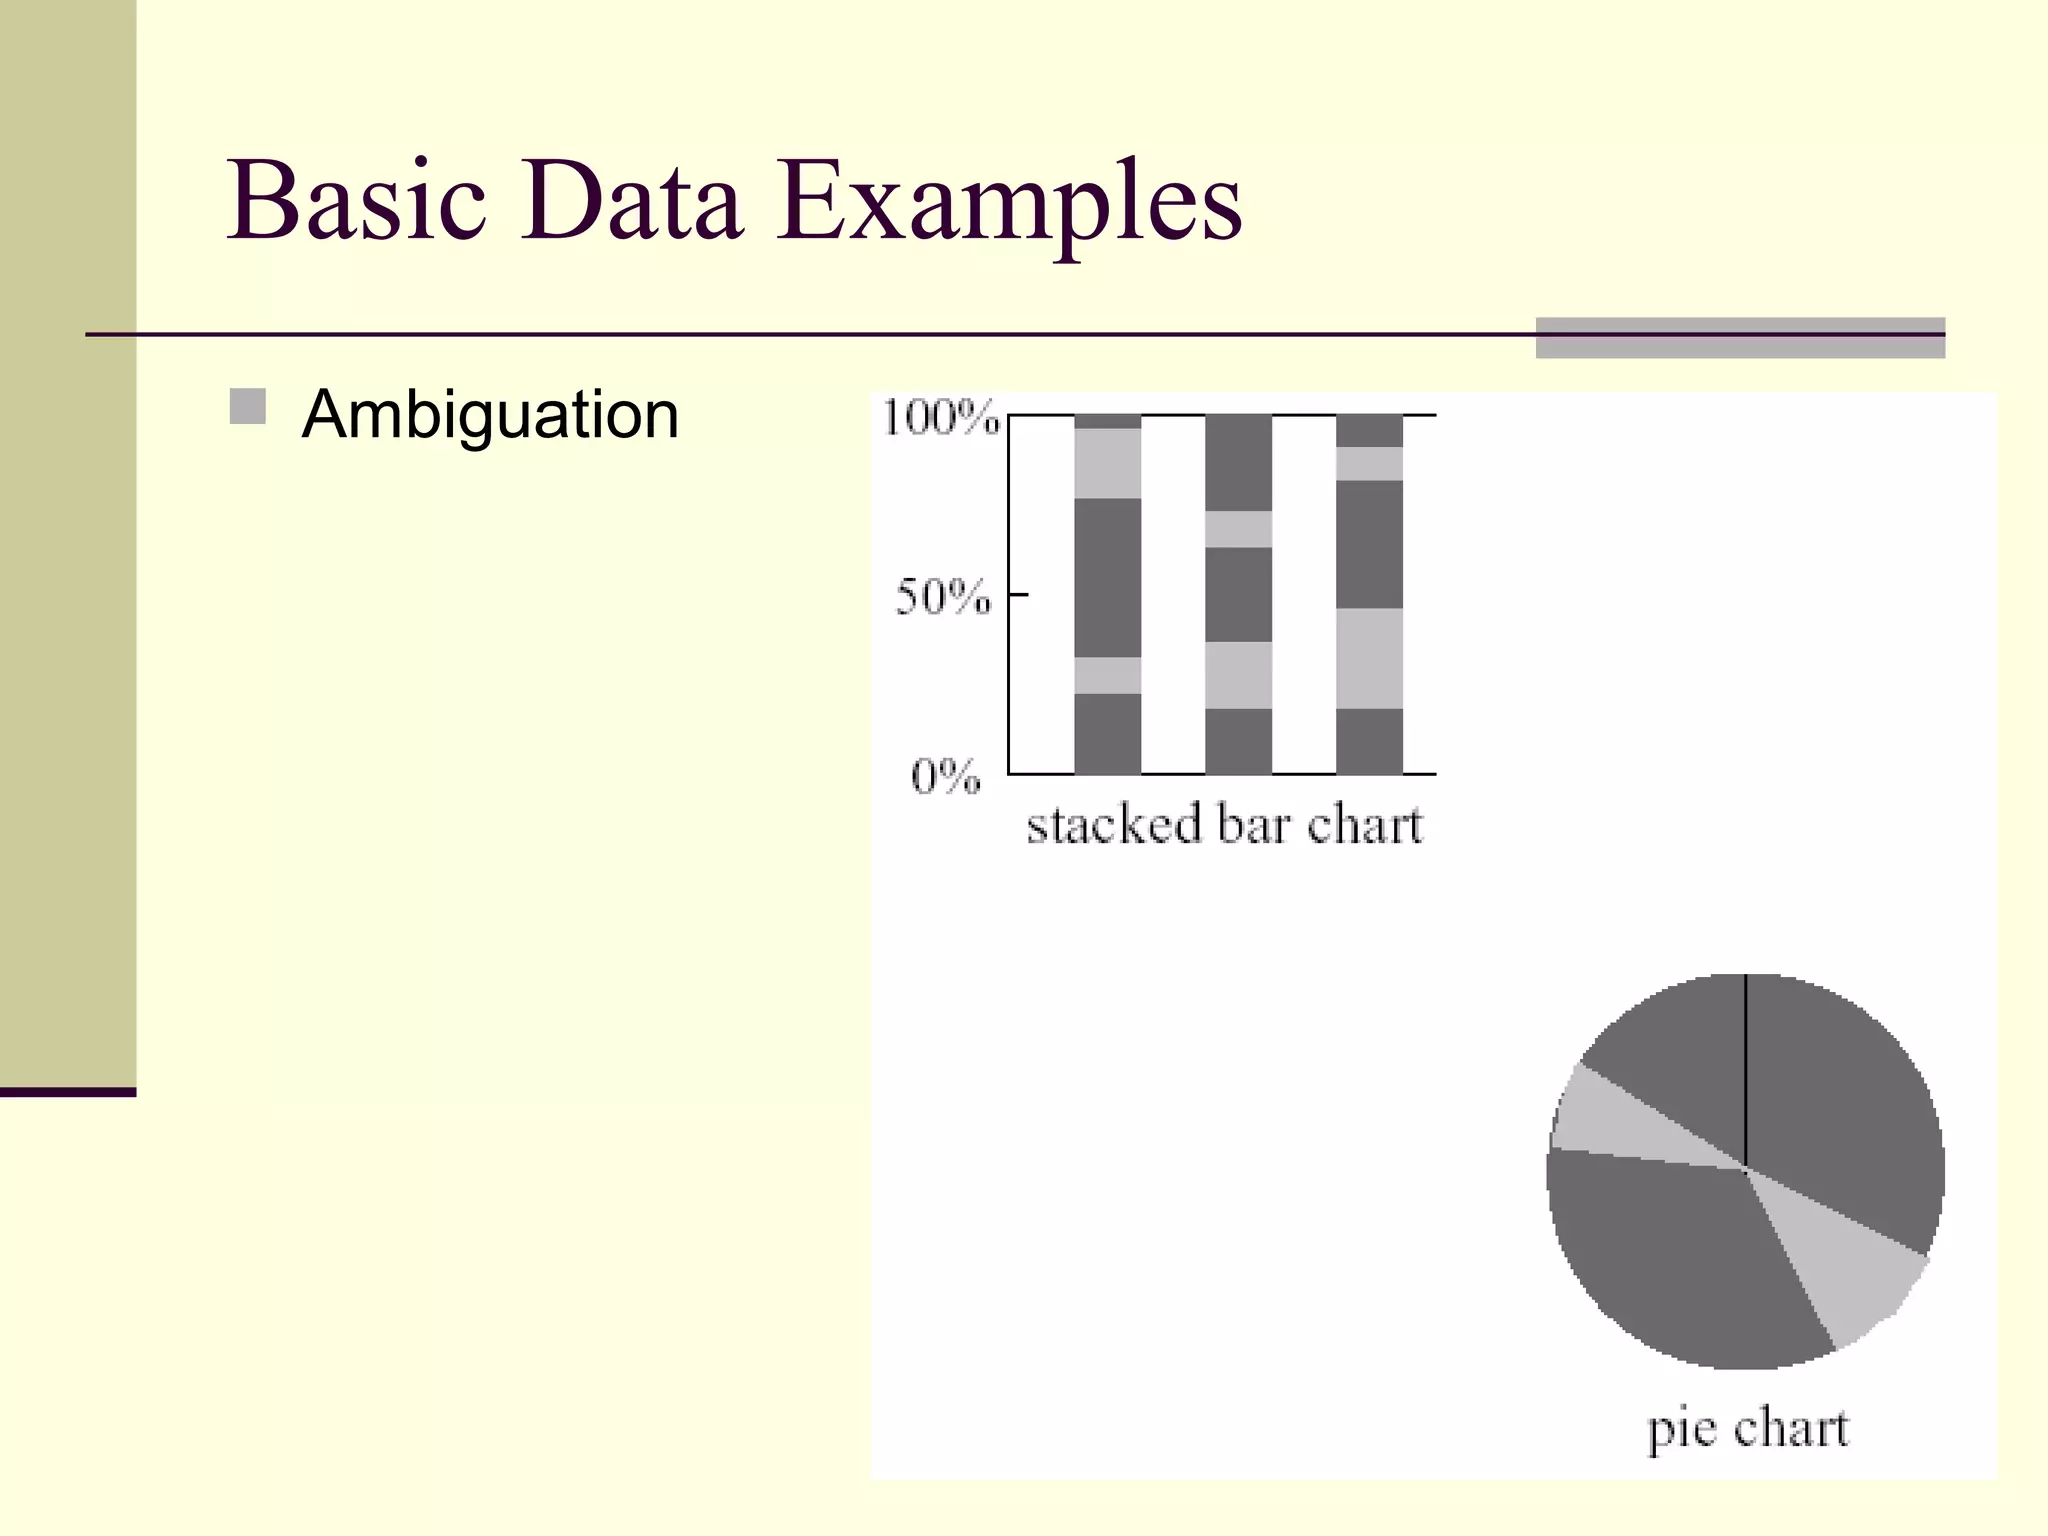
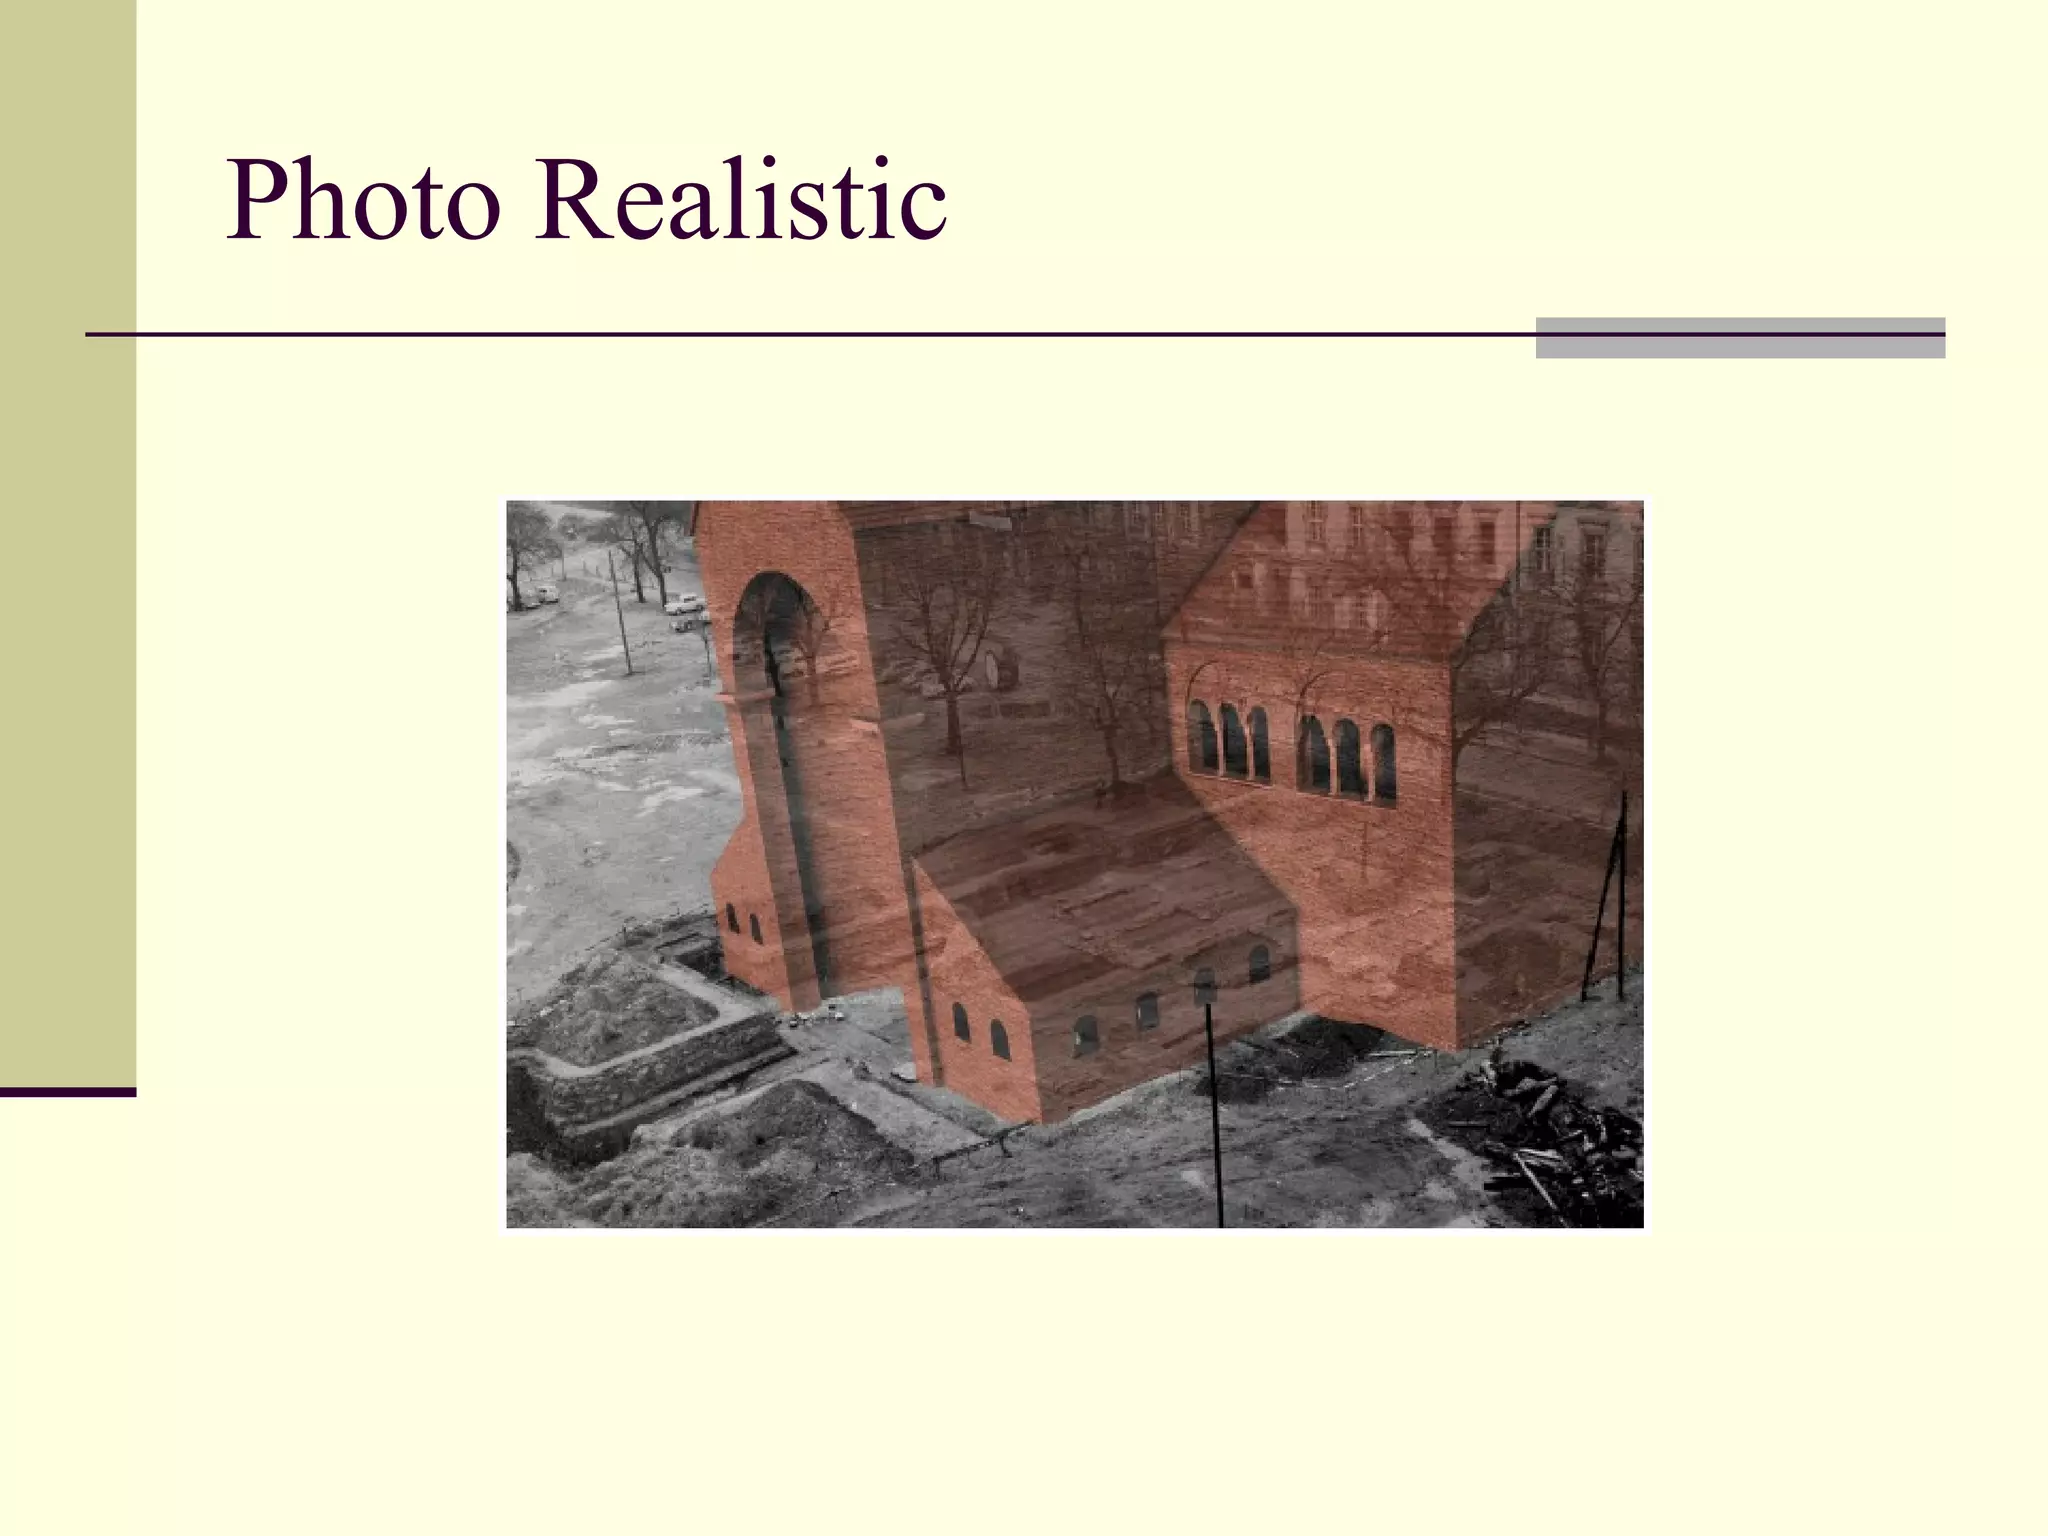
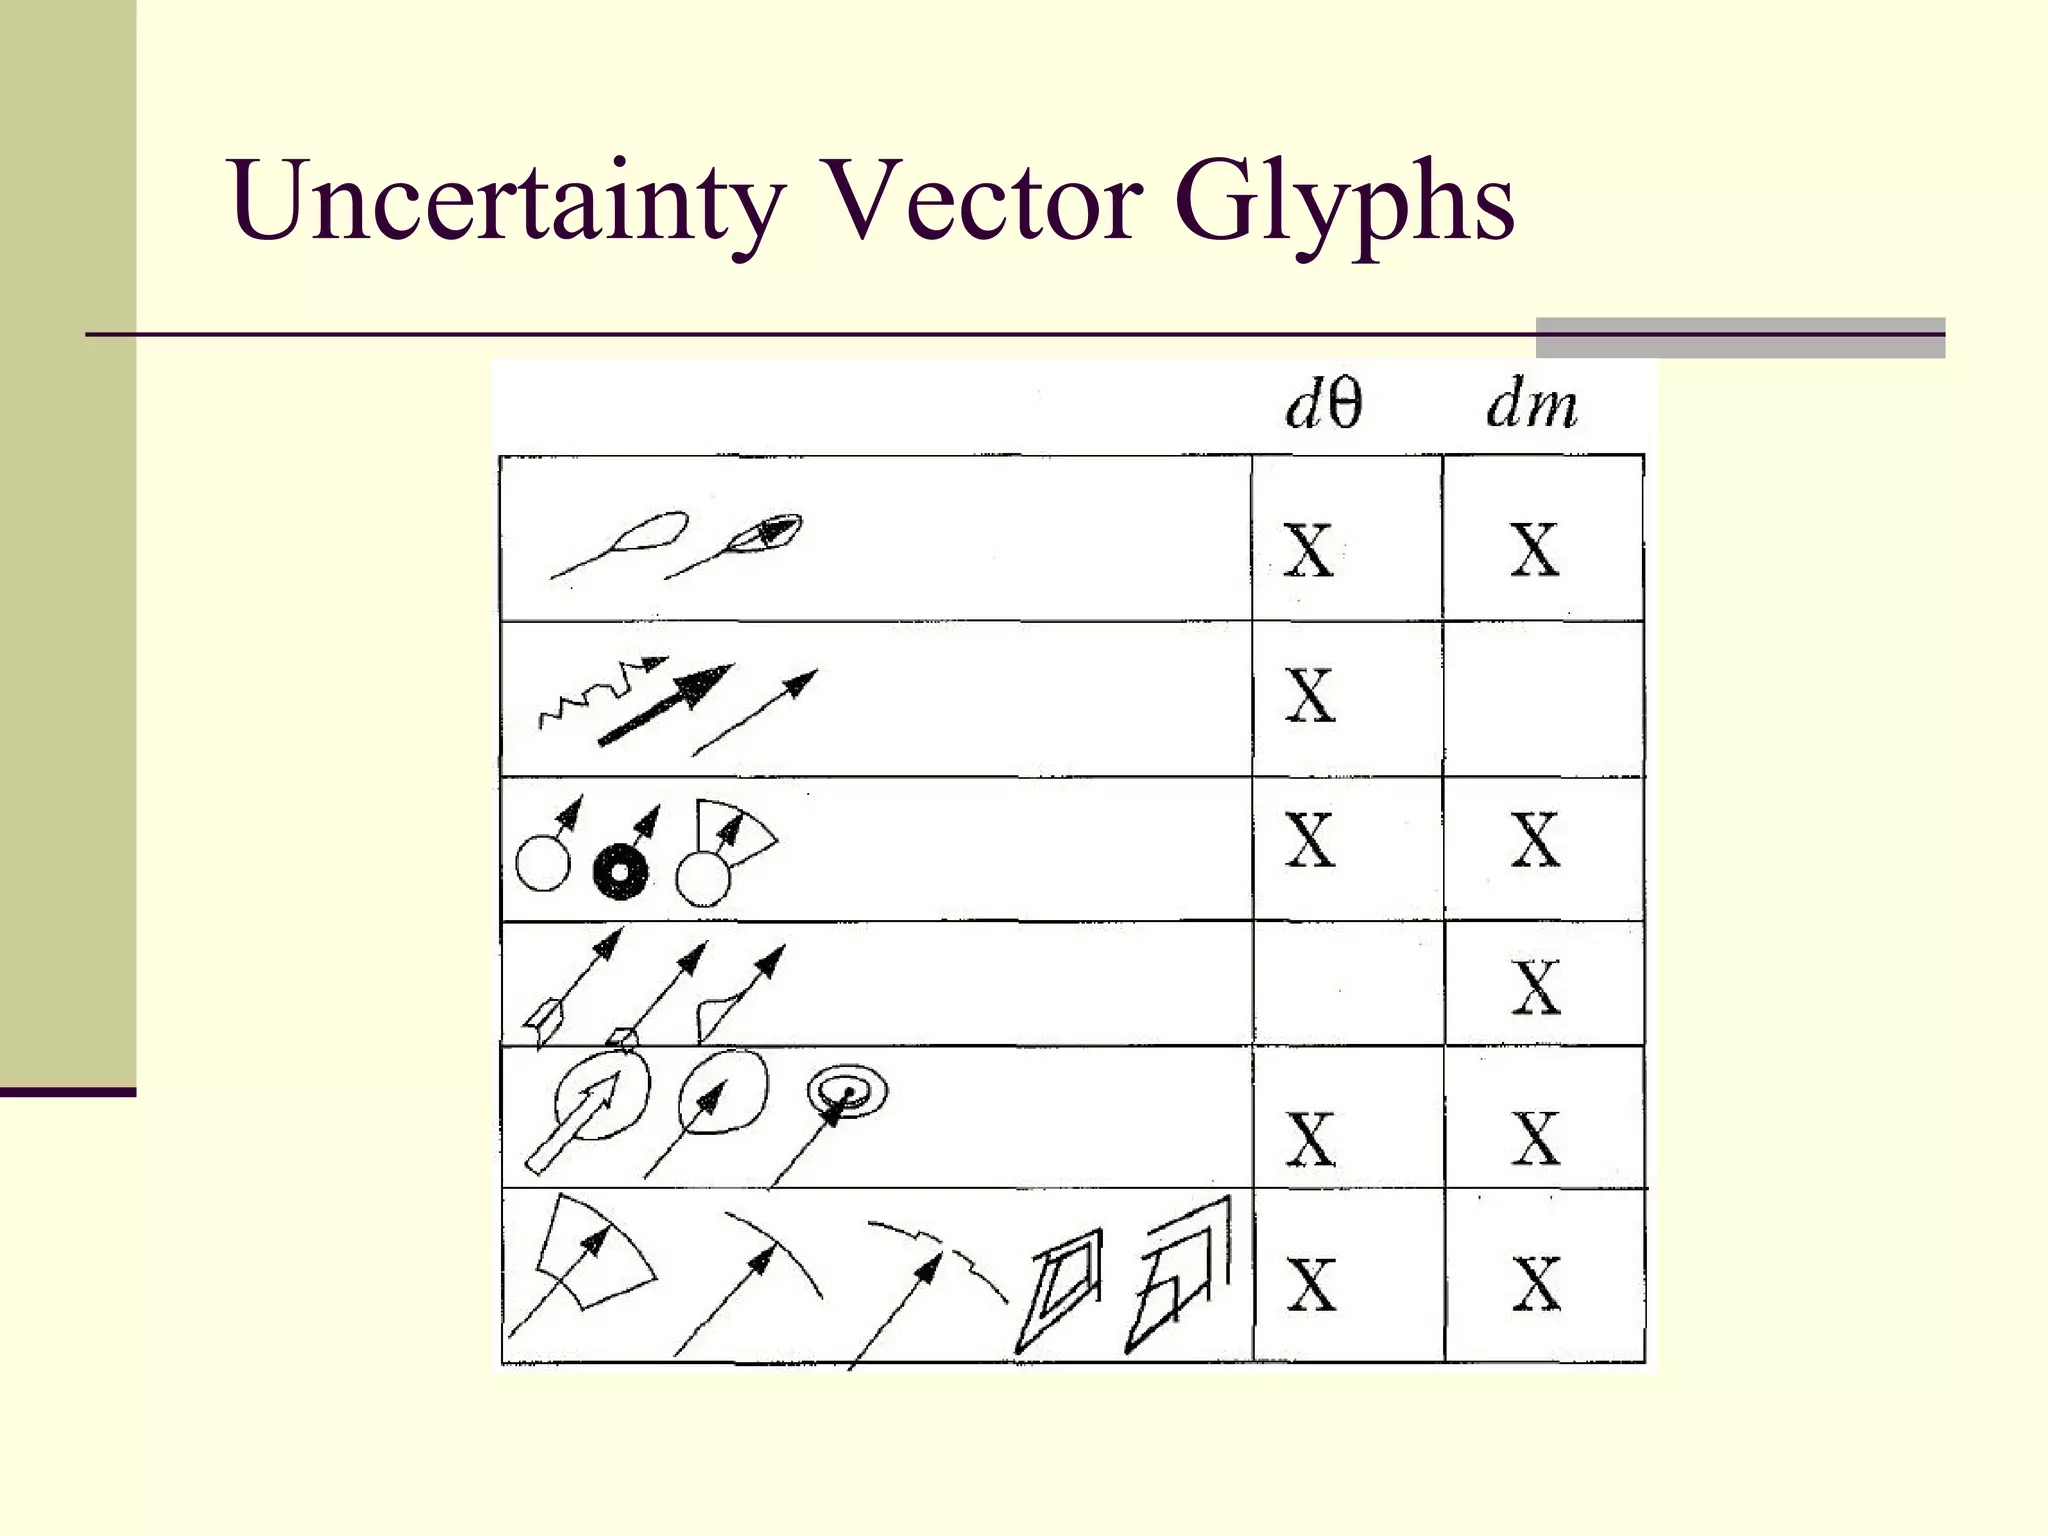
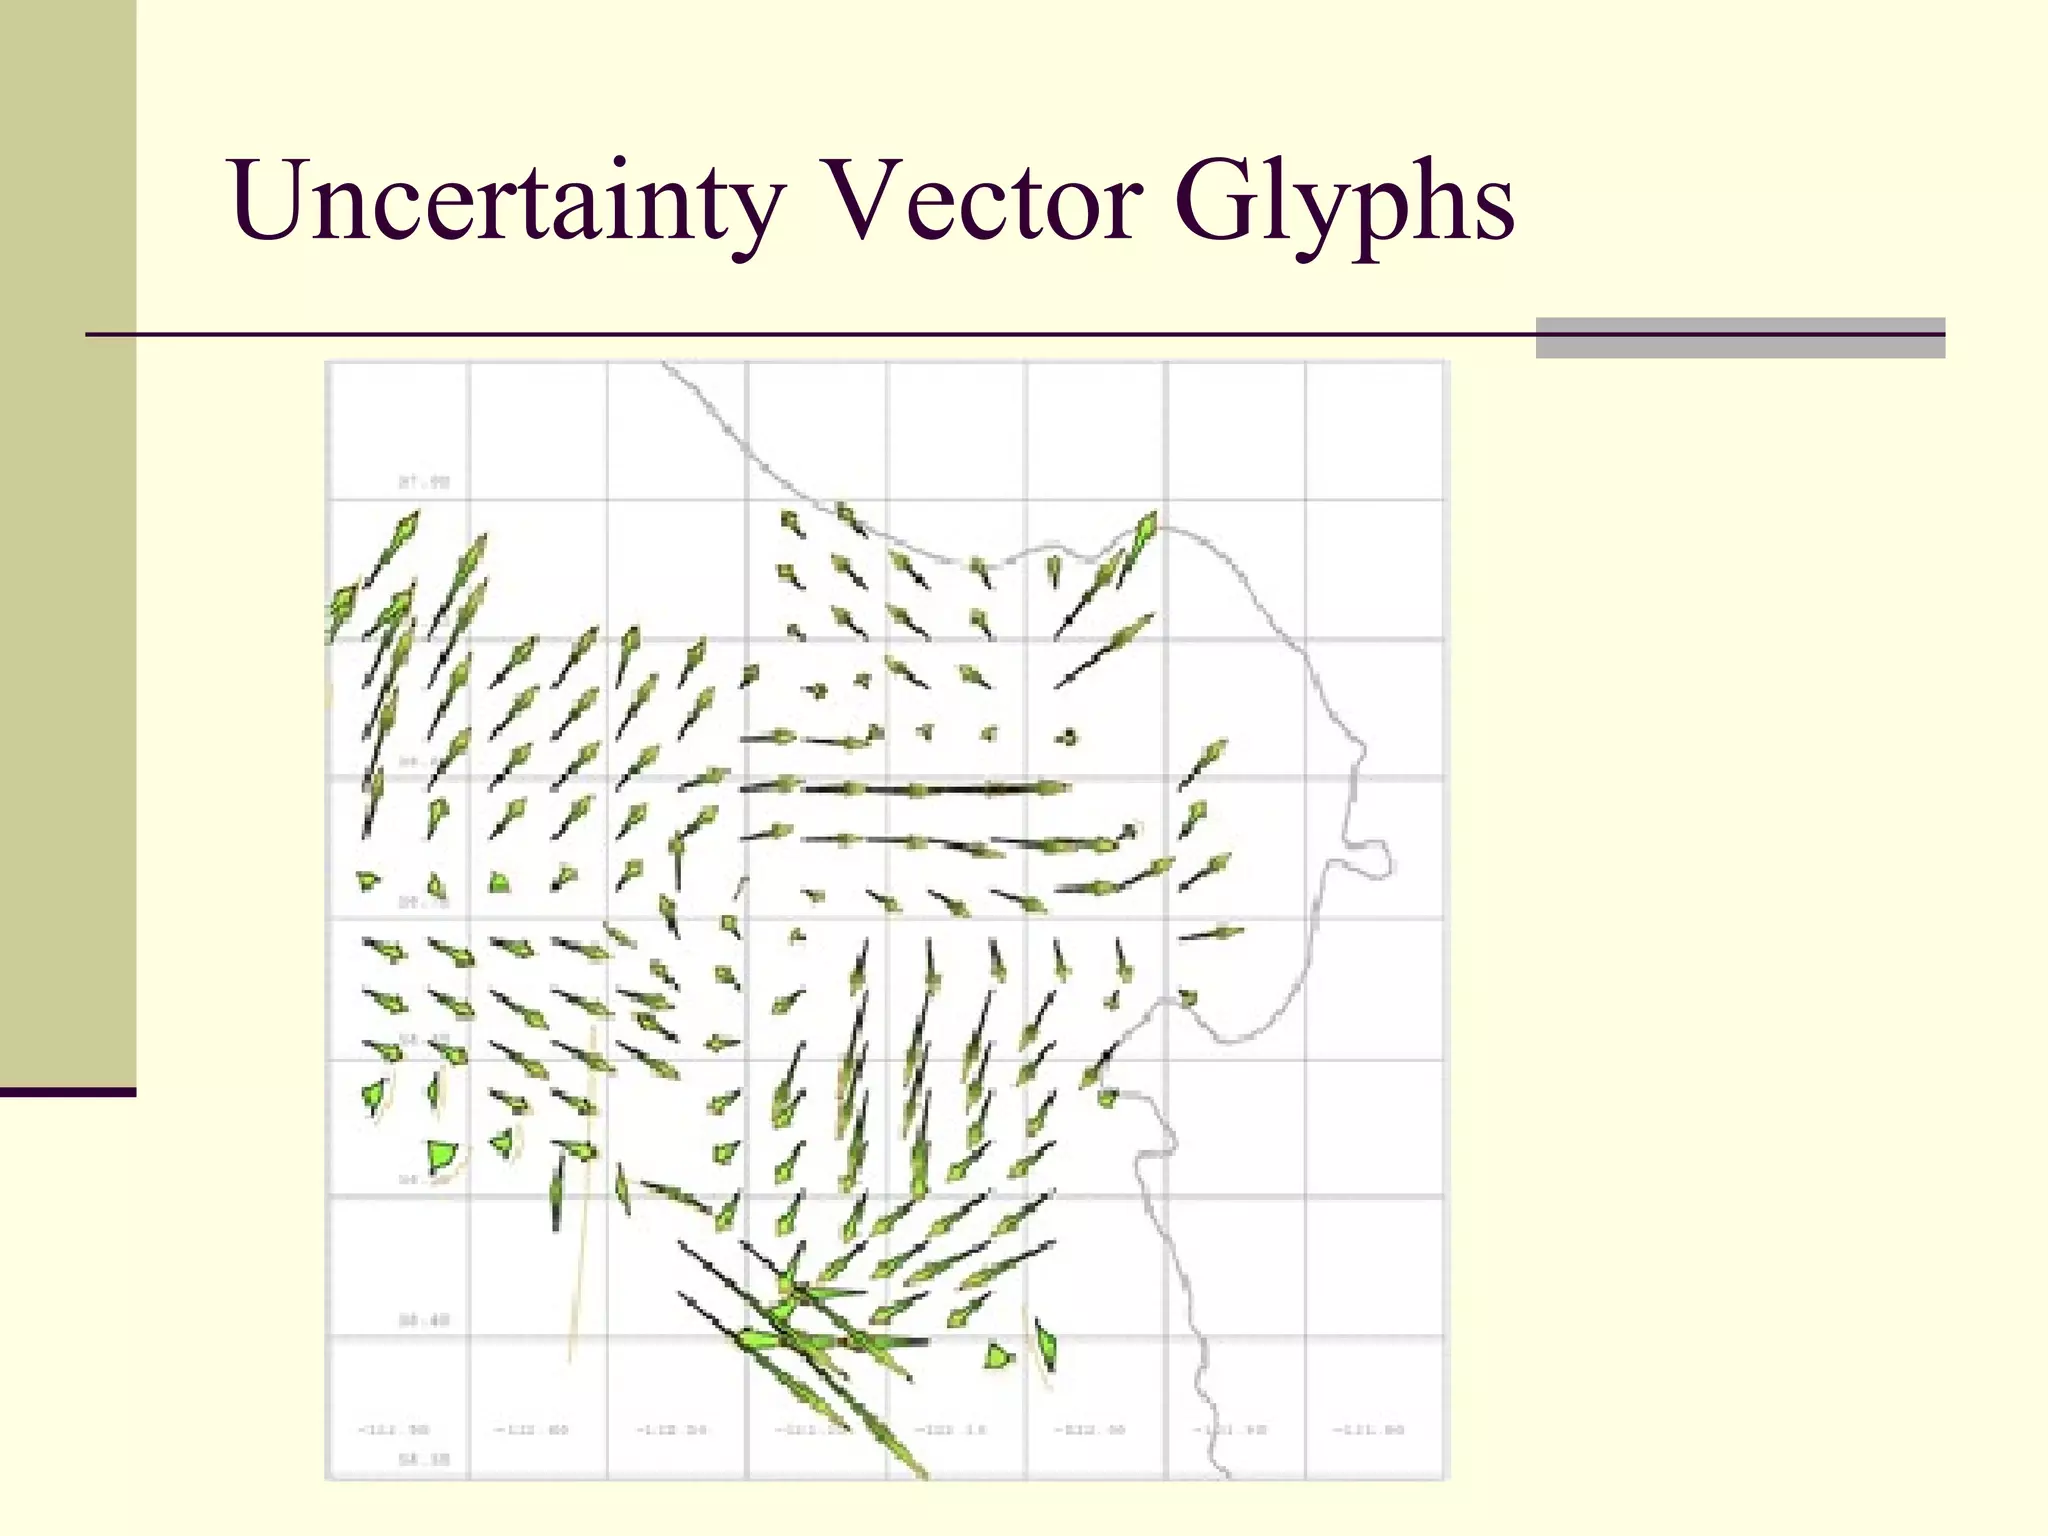
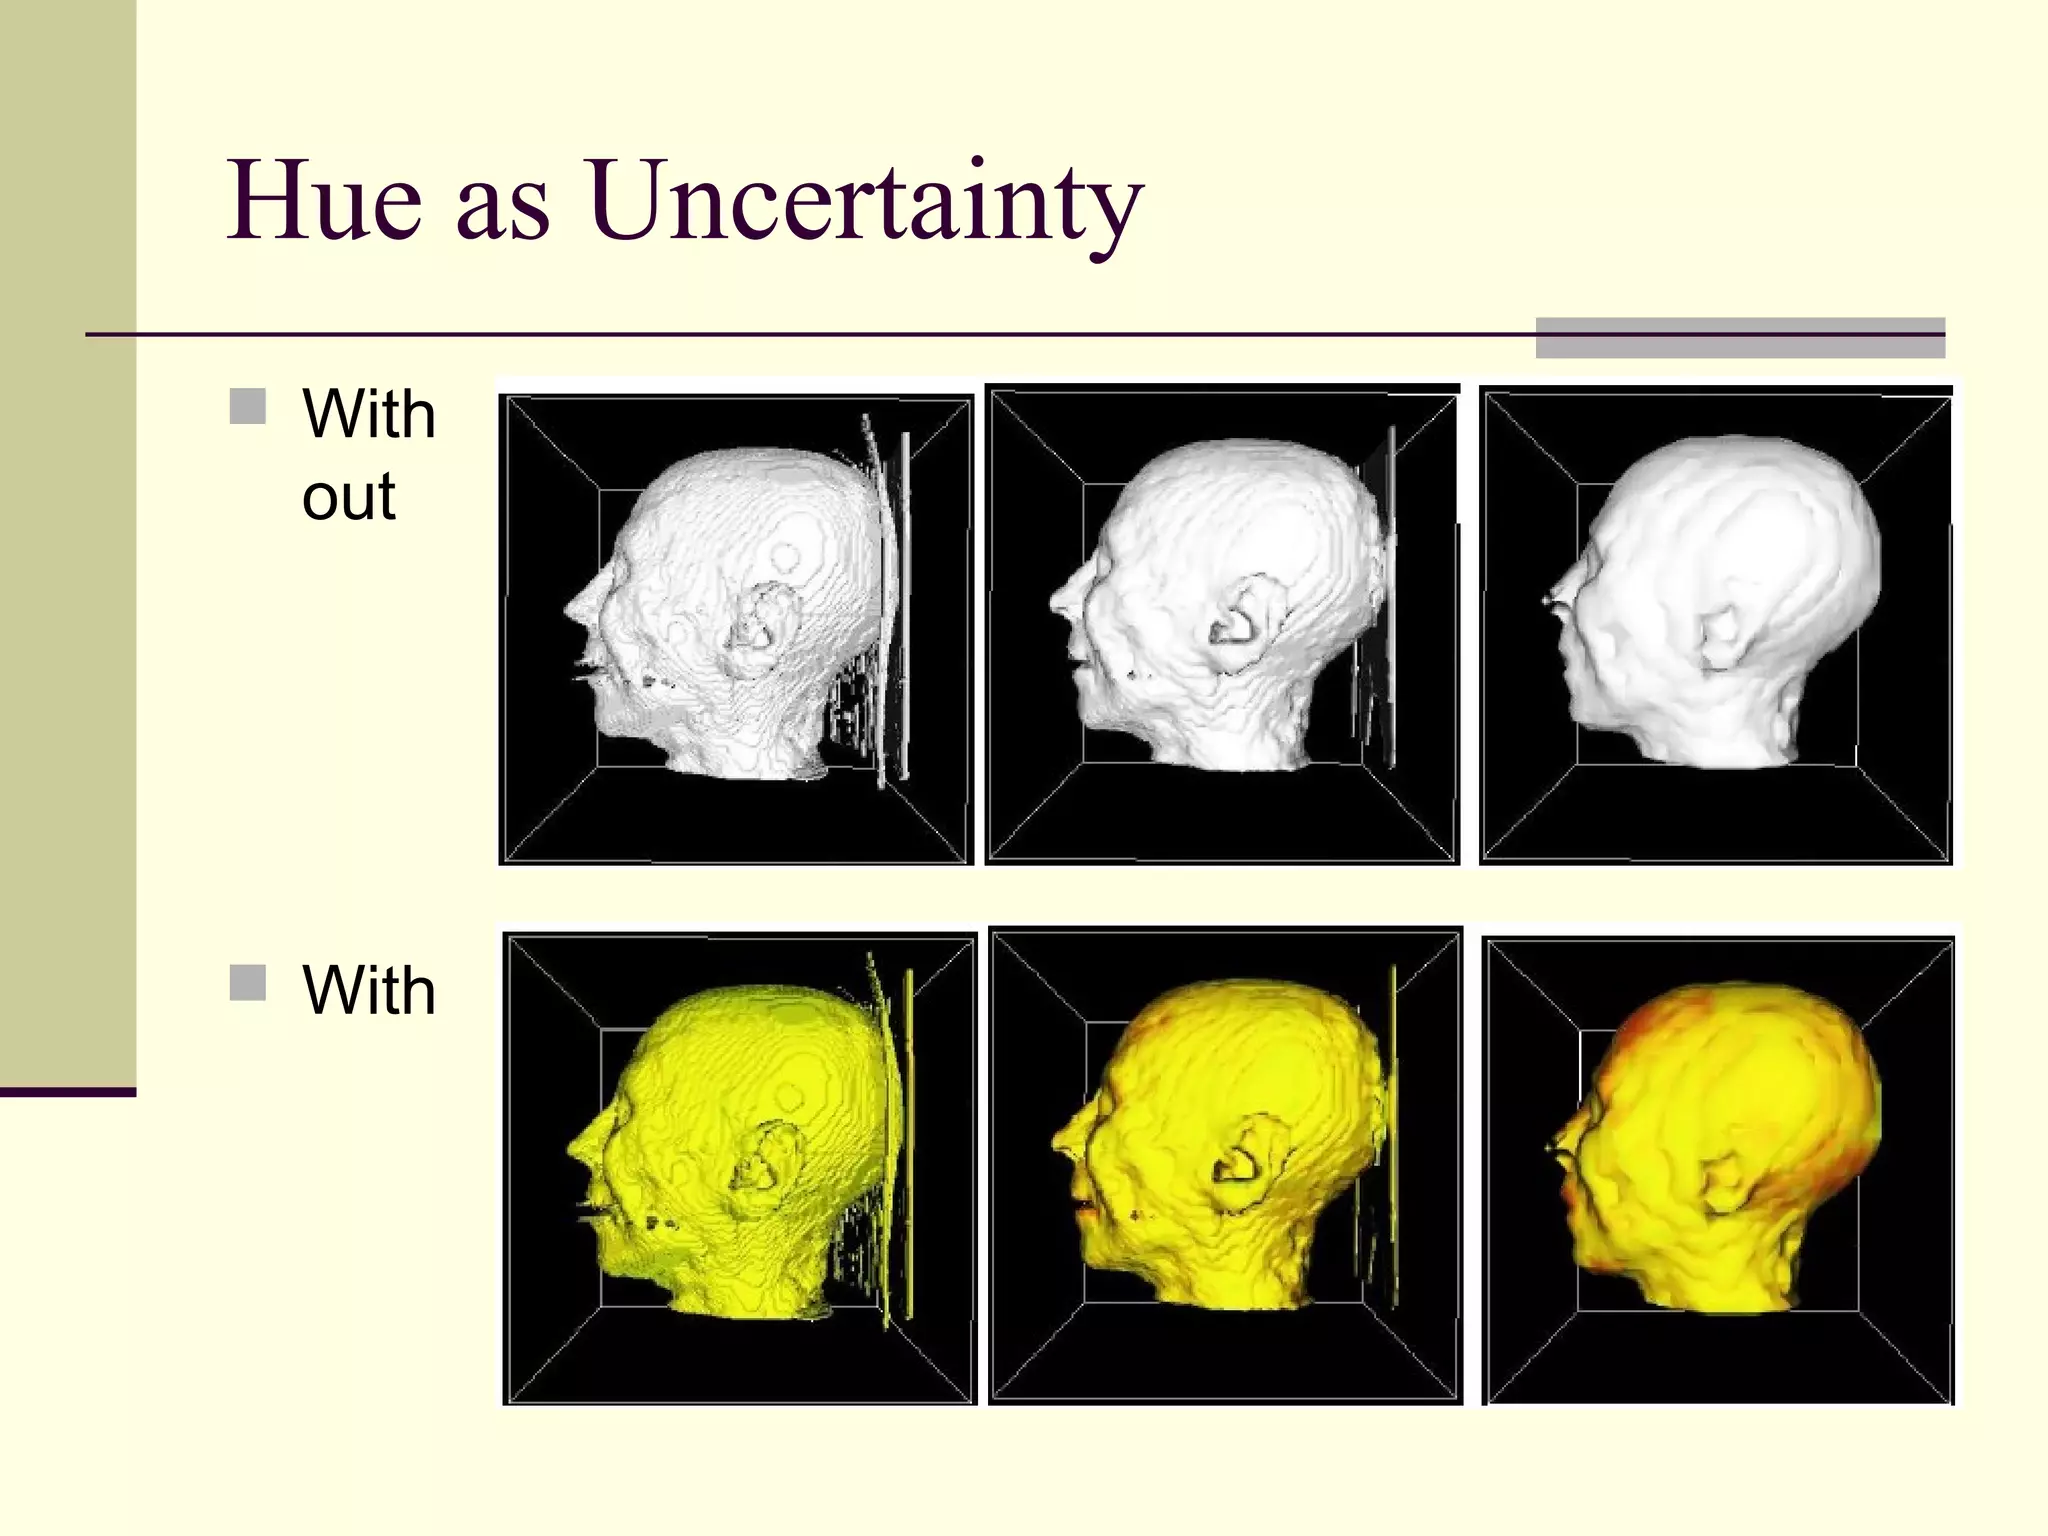
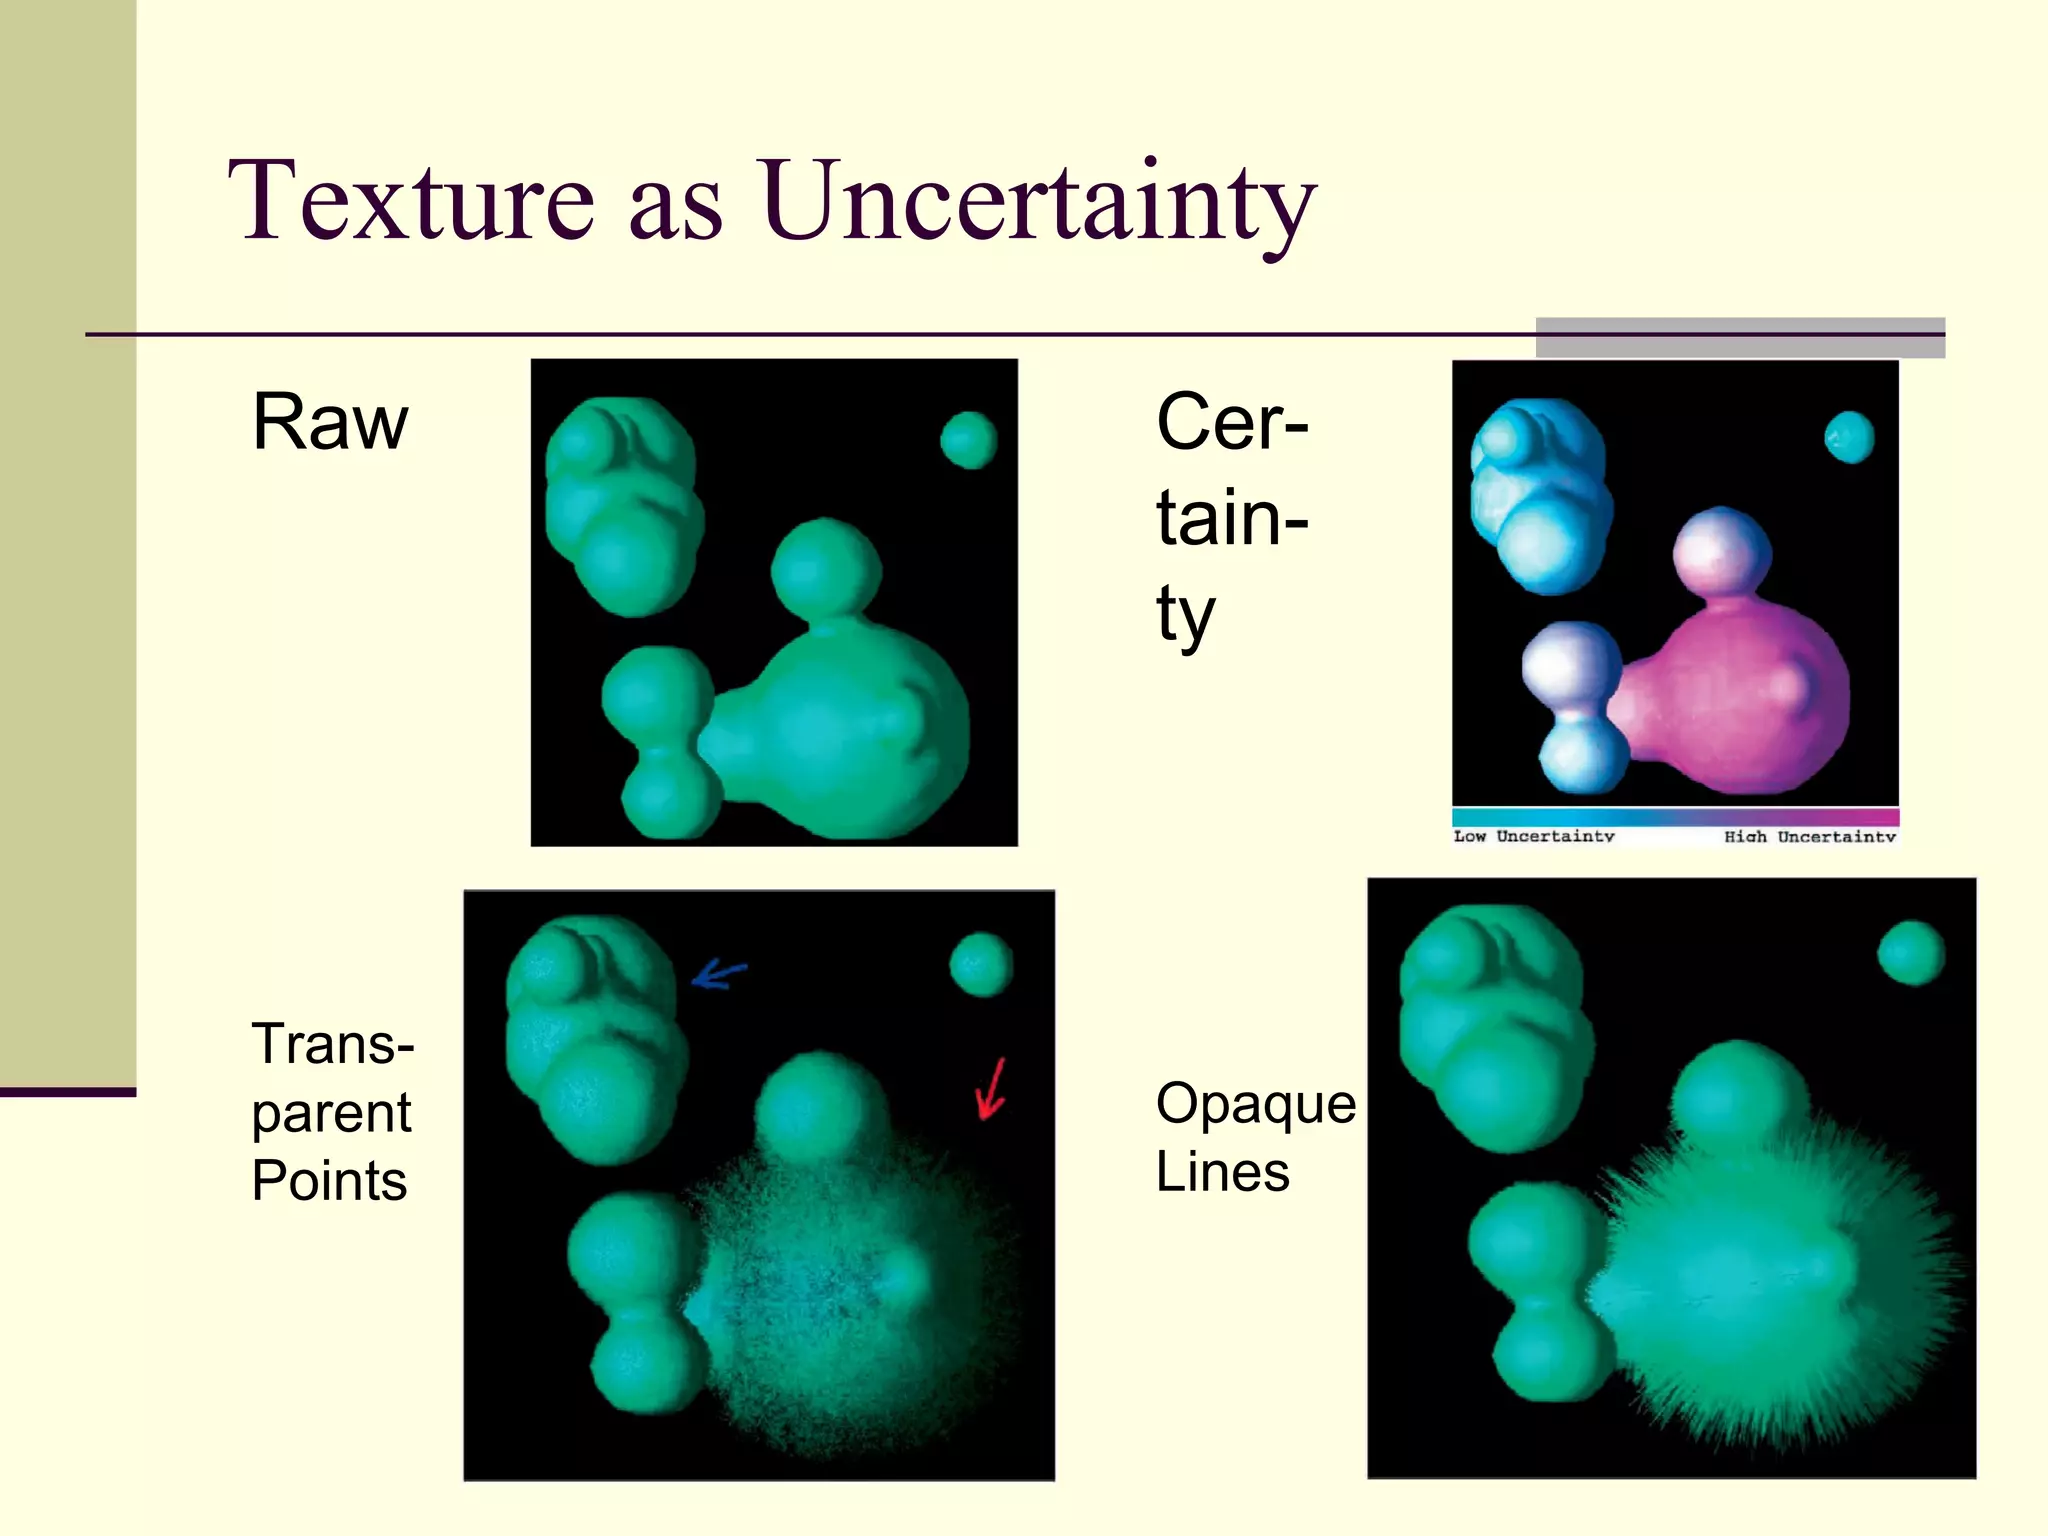
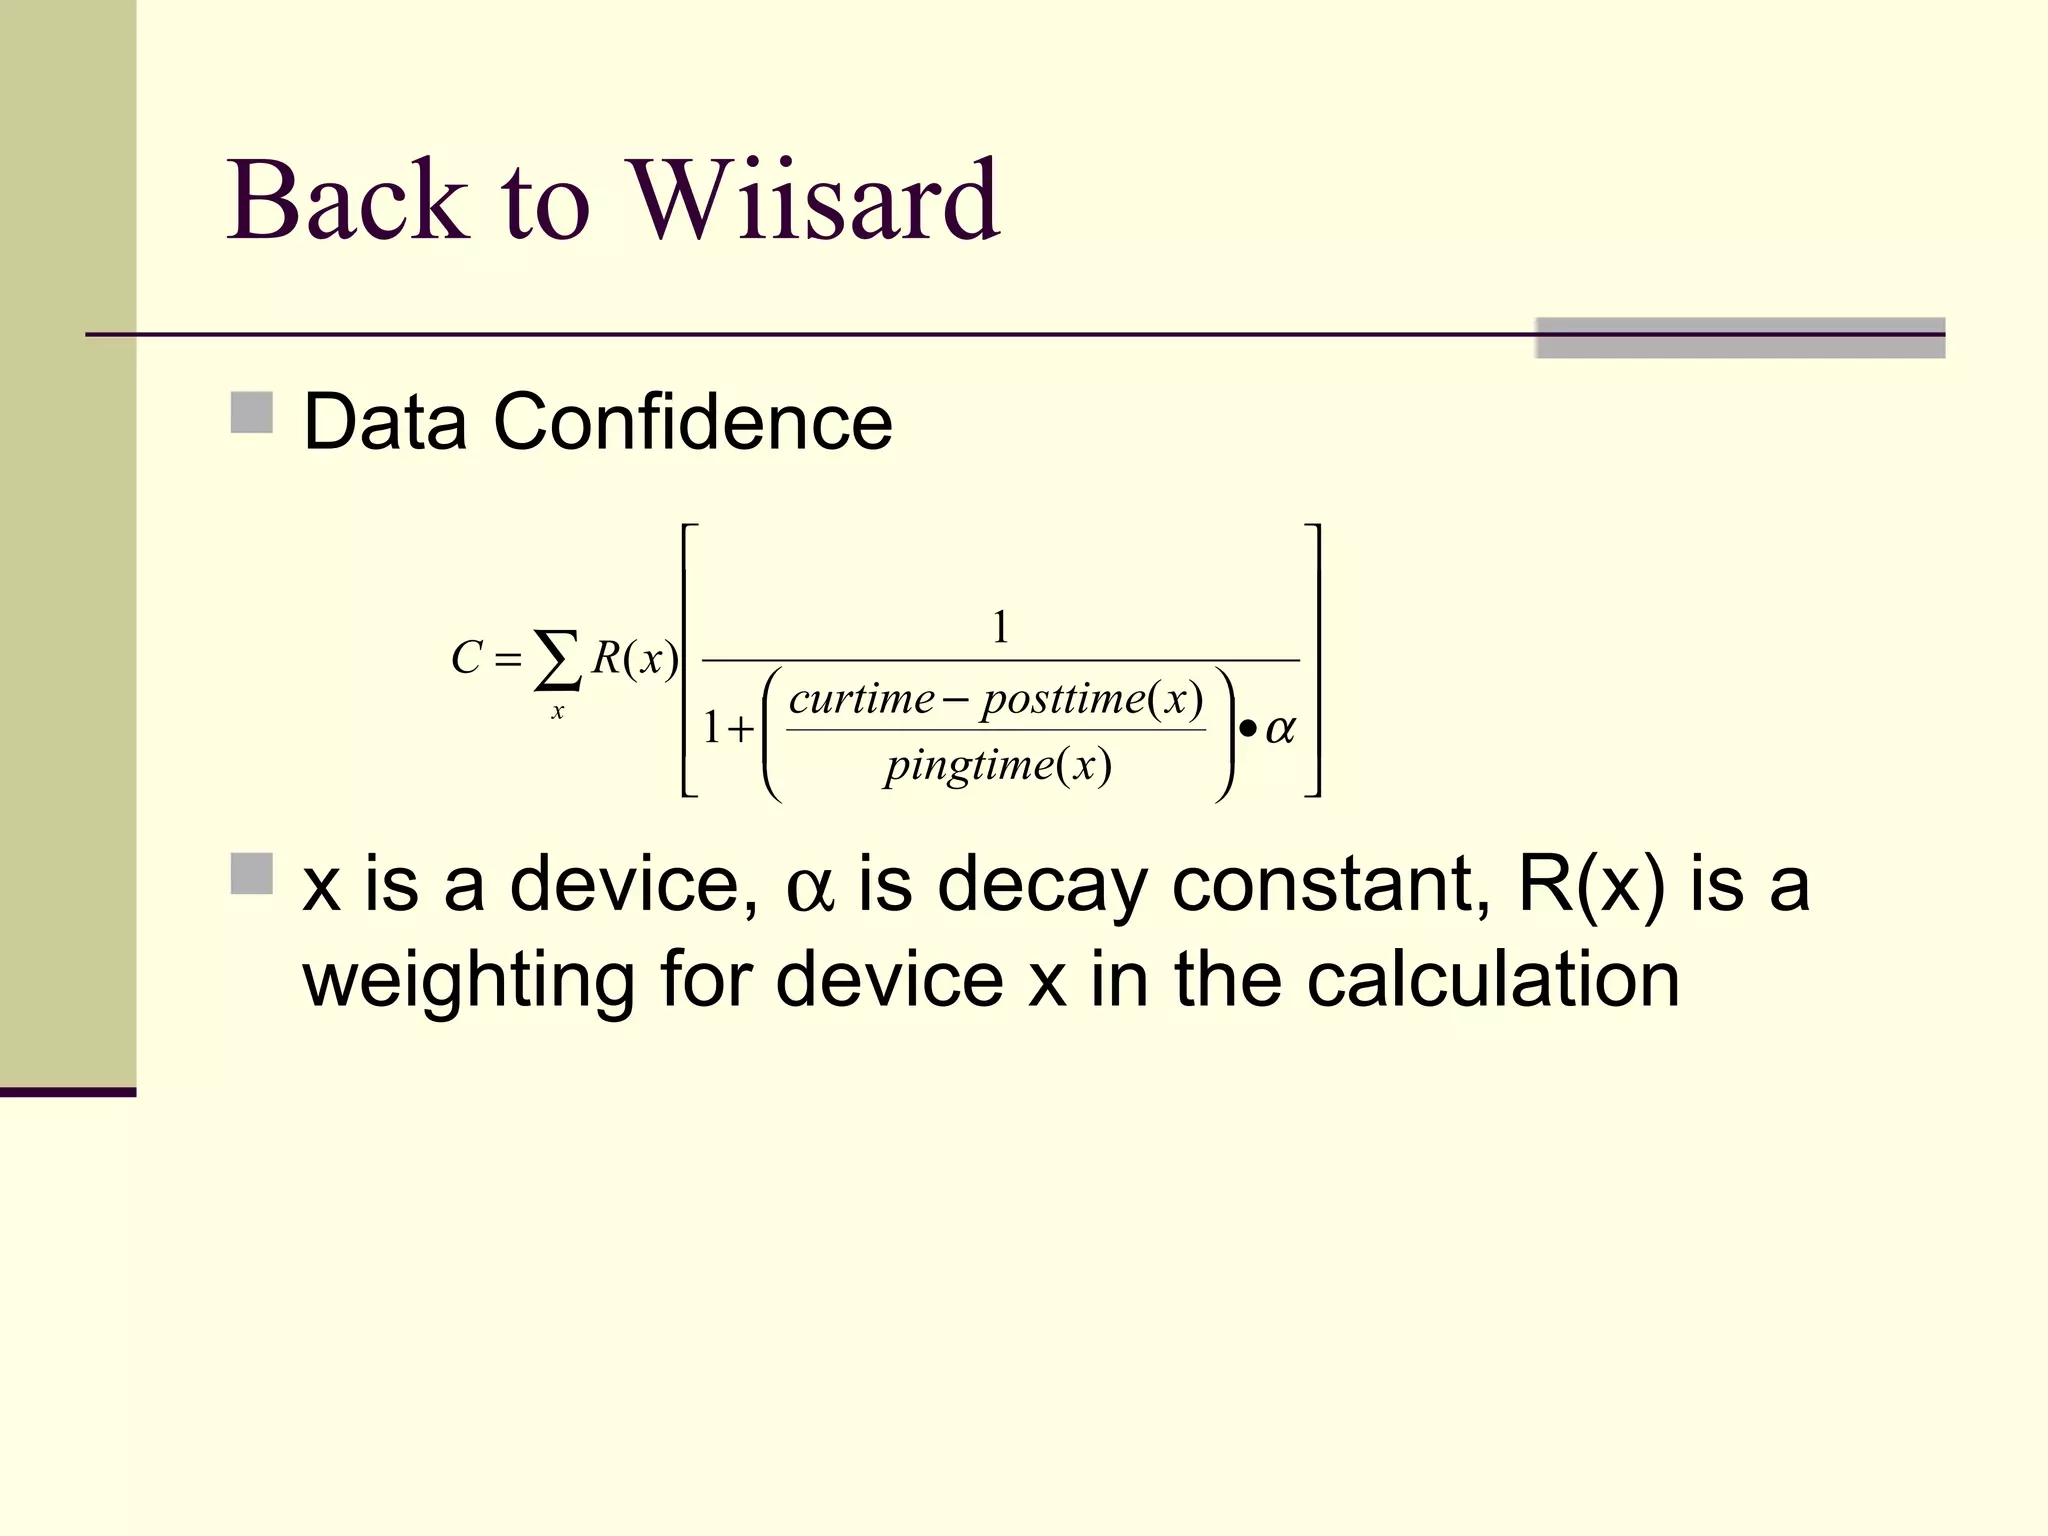
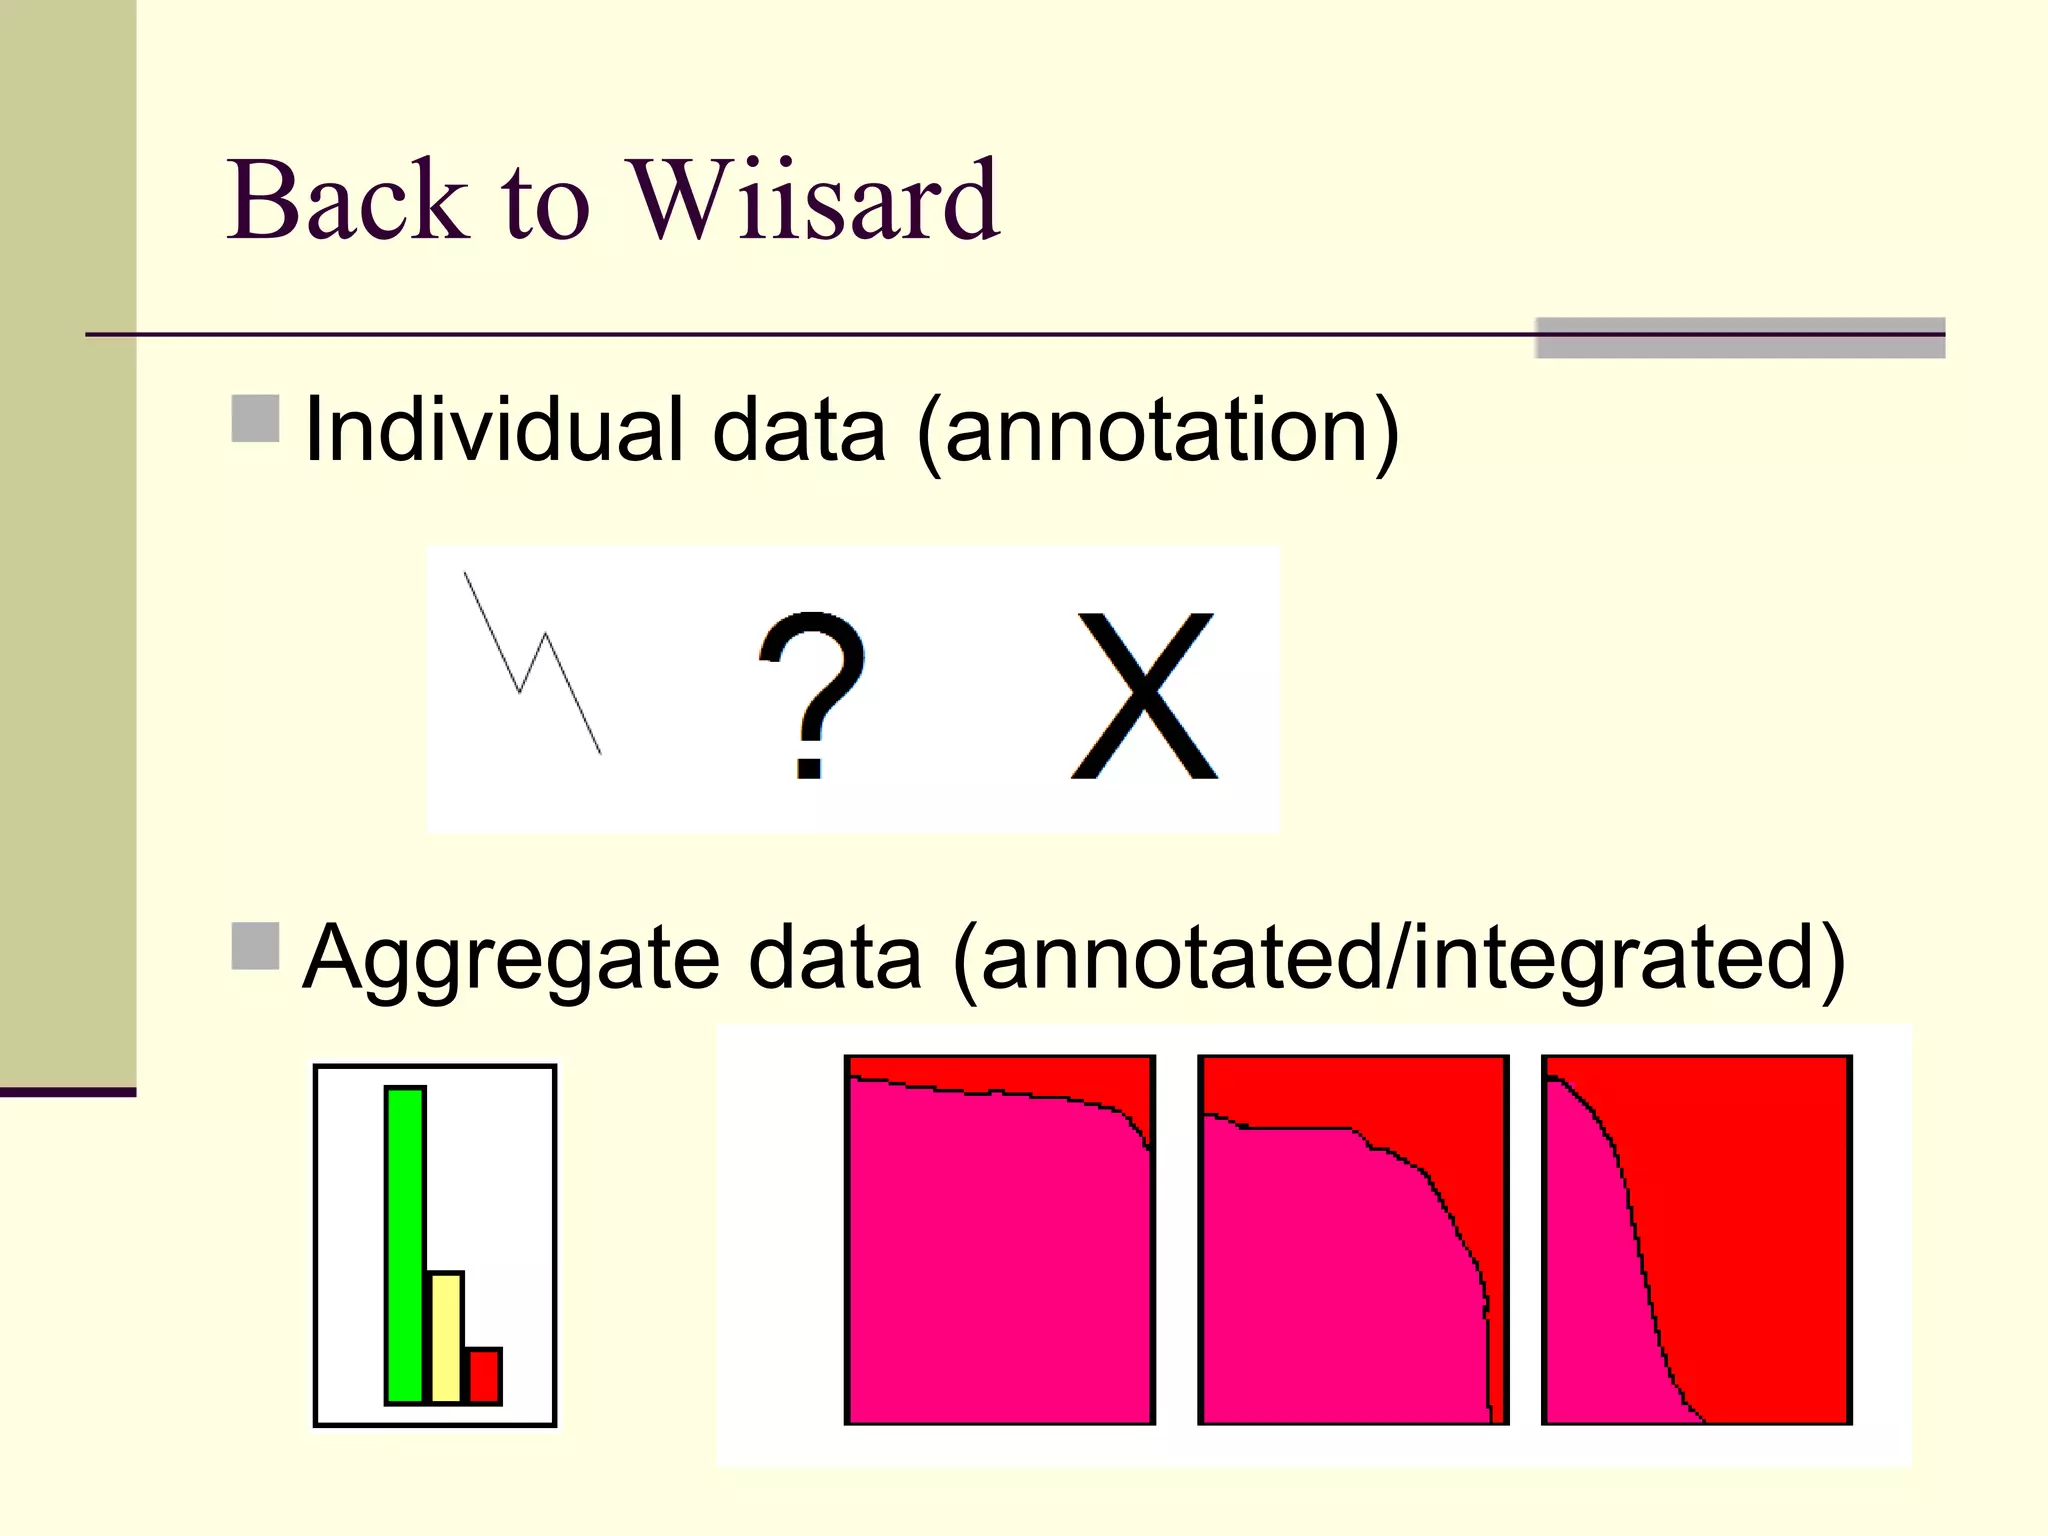
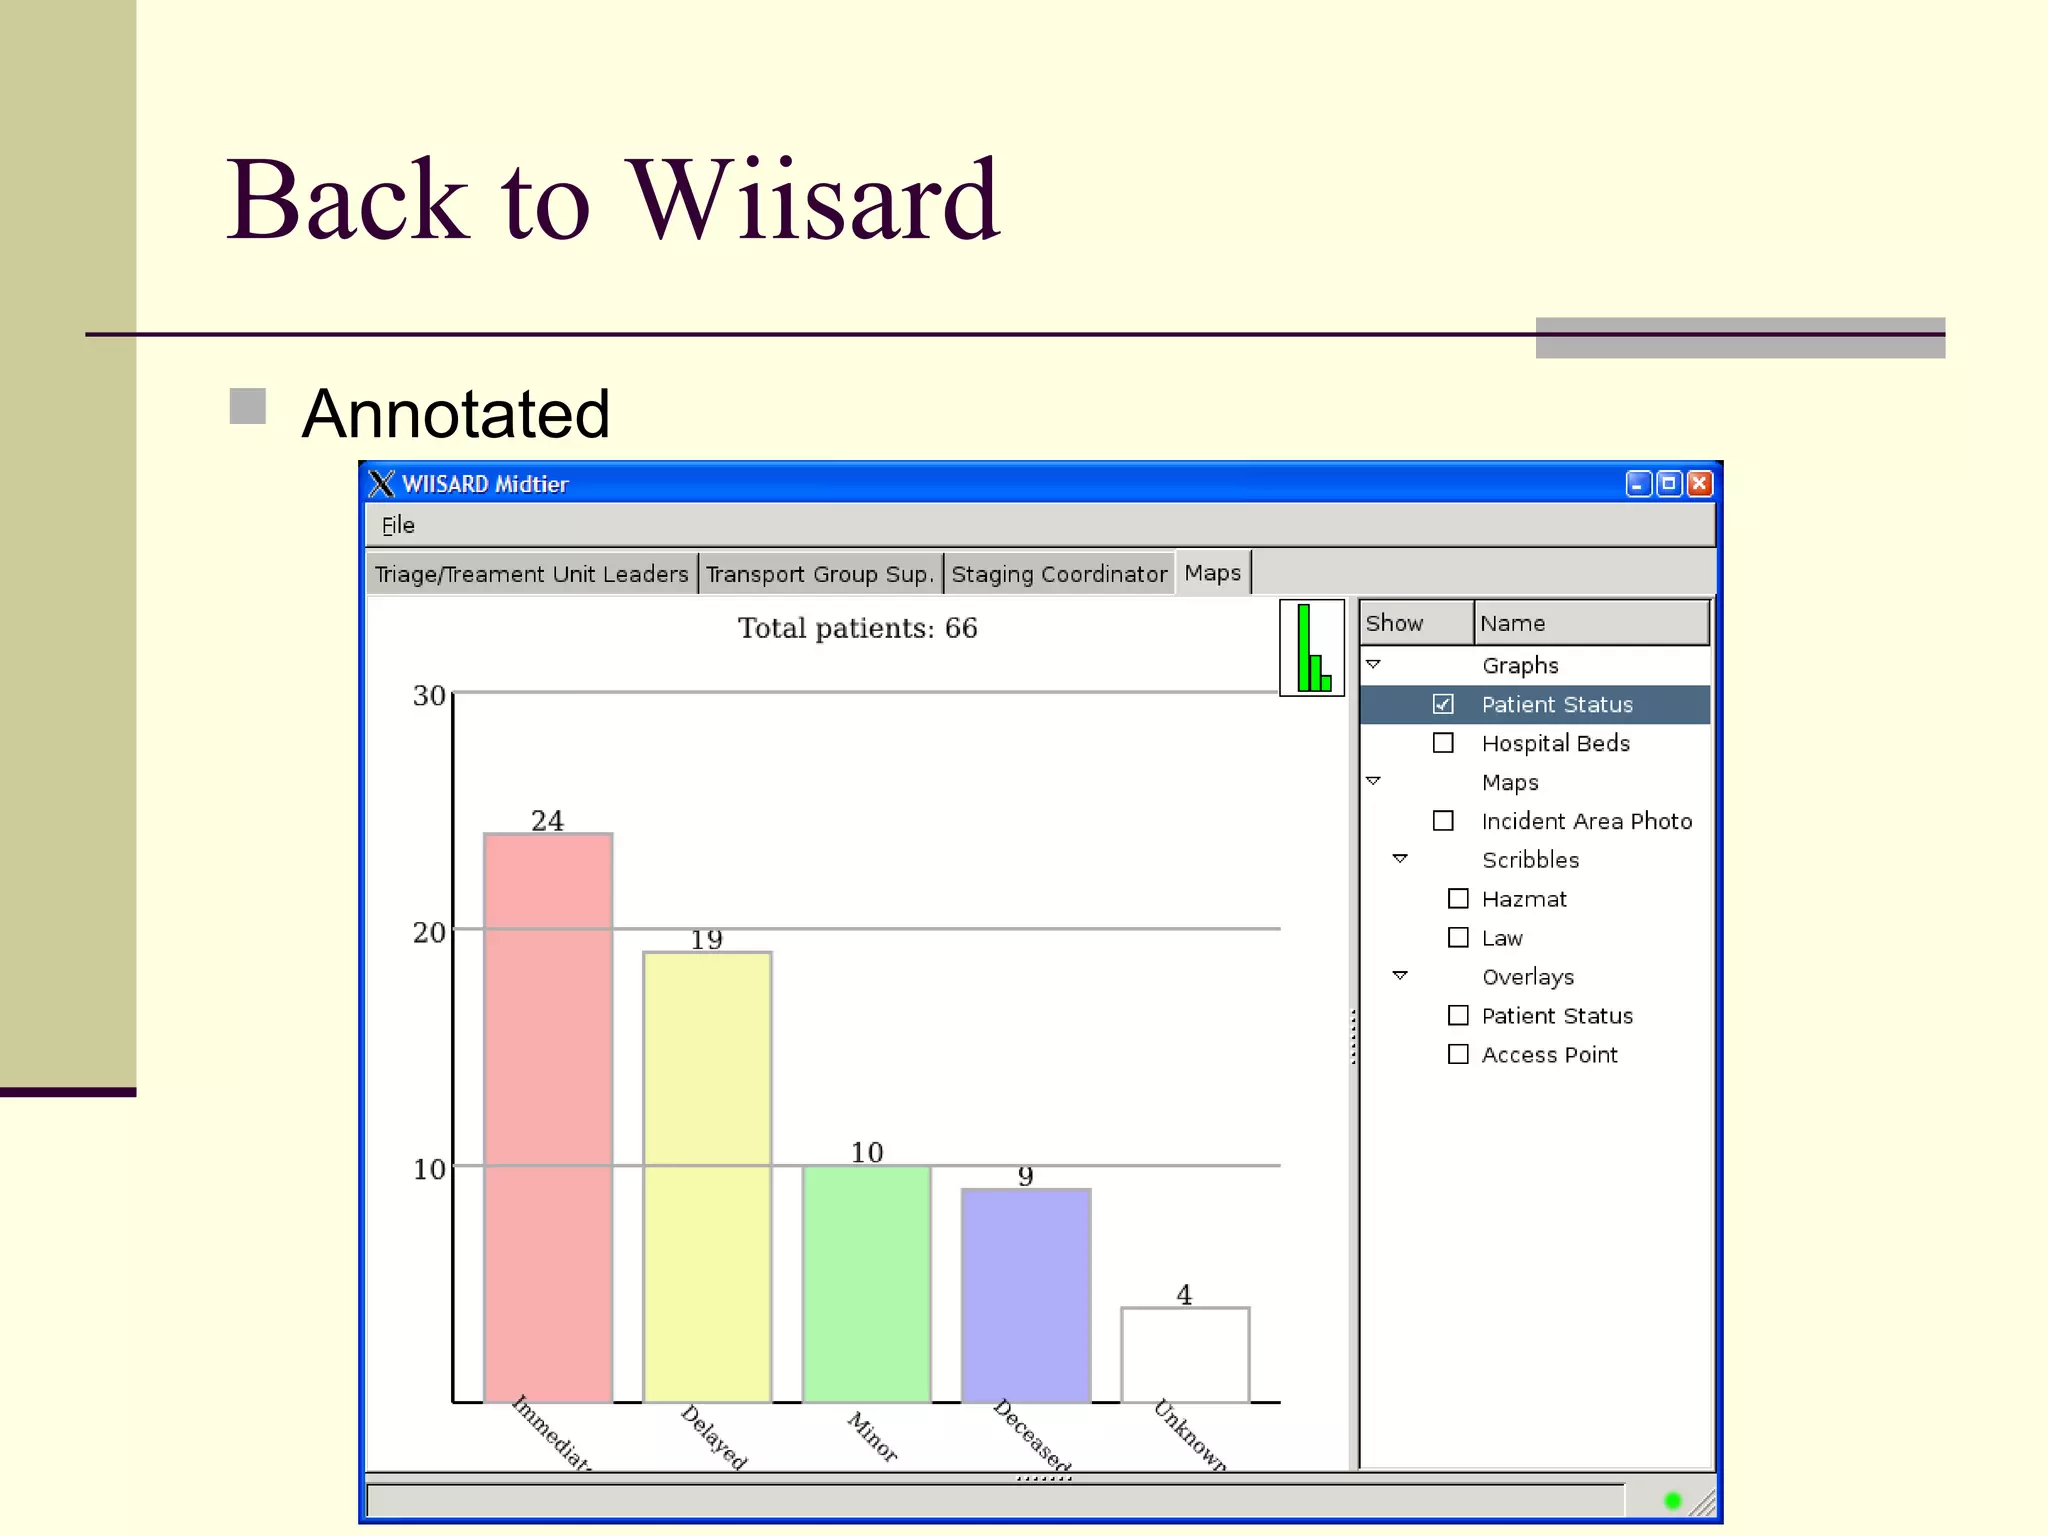
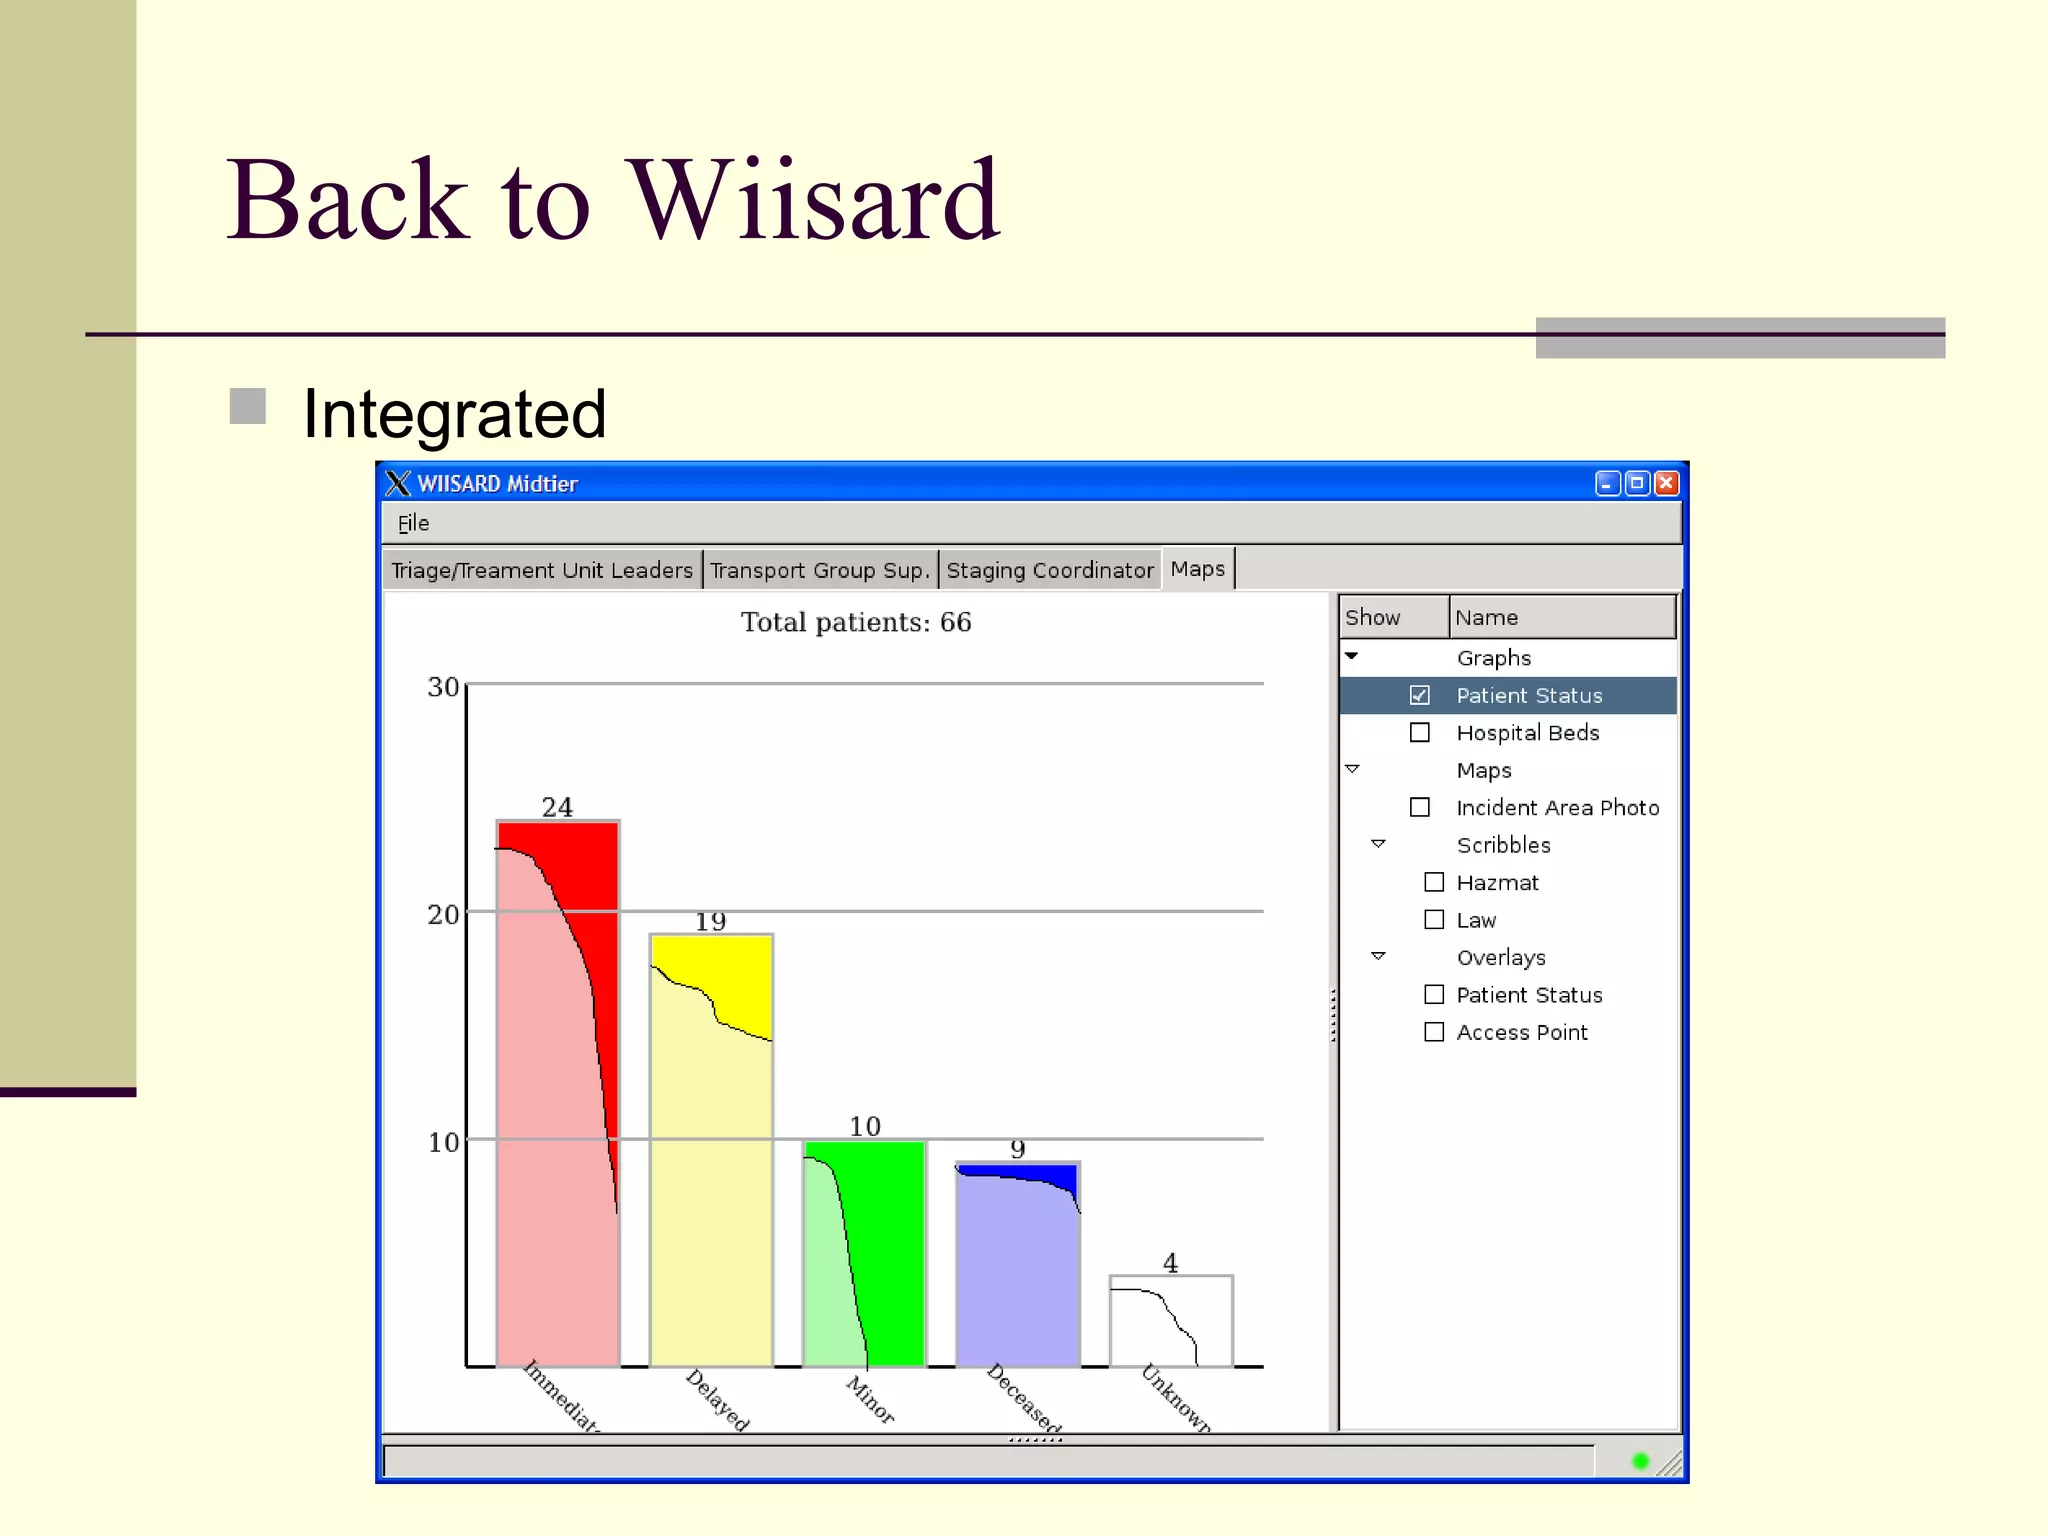
Data Quality and
Uncertainty Visualization
UC San Diego
COGS 220
Winter Quarter 2006
Barry Demchak
Immediate Motivation: Wiisard
 A joint project of Veterans Administration and
UC San Diego, funded by the National Library
of Medicine
 Mass casualty triage and treatment
 Enter patient information via PDAs
 Patient information summarized on tablet PCs
 Command/control for supervisors and incident
comment personnel
 Tied together using 802.11b and store-and-
forward database access
Wiisard – Explosion with Pesticides
Wiisard – Network Deployment
Wiisard – Tablet Display
Wiisard – Command/Control
Wiisard – The Problem
 What if the network becomes partitioned?
 Tablet display shows out-of-date patient
information
 Summary displays are out of date, too
 How does this lead to bad decisions?
 Supervisors may mis-deploy doctors
 Incident command may mis-deploy resources
People may die
DOD Example
 Sensor-to-shooter (STS) Networks – Patrick
Driscoll (USMA), June 2002
DOD Example
DOD Example
 “… our first attempt to get the military
community to realize that there is a degree of
uncertainty involved in (digital) information
systems that cannot be engineered out of the
system.”
 “Ultimately, our concern was an awareness
issue (for the decision maker) …”
 “… woman at MITRE had proposed a system
of tagging intelligence starting at the source
in a way that would reflect the uncertainty of
the data being put into the intel database.”
The Problem
 How to visualize the uncertainty in data so
that humans can exercise judgment in
making the best decision
 Accounting for uncertainty is not the same
thing as visualizing uncertainty
What Labs are Involved
 MIT Sloan School of Management
 Richard Wang (Data Quality)
 Penn State University
 Alan MacEachren (GIS)
 University of Maine
 Kate Beard-Tisdale (GIS)
 University of California, Santa Cruz
 Alex Pang (Scientific Visualization)
 University of Arkansas, Little Rock
 Master of Sciences in Information Quality
What Conferences are There?
 MIT Information Quality (IQatMIT)
 ACM SIGMOD Workshop on Information Quality in
 ACM SIGKDD (Knowledge Discovery and Data M
 MIT International Conference on Information Qual
Semiotic Interpretation
Definition of Data Quality
 From Wand & Wang:
Metrics
 Timeliness
 How up to date relative to intended purpose
 Ballou et al:
 Timeliness = Max(0, 1-(currency/volatility)
 Currency = delivery_time – input_time
 Volatility = length of time data remains valid
 Apply sensitivity factor “s”: Timeliness ^ s
Interplay with Uncertainty
 Metrics are application dependent
 Metrics are data dependent
 Metrics are user dependent
 Question: If a metric describes an individual
data element, what is the effect of
aggregating data elements having
uncertainty??
GIS Examples – NCGIA
 Sample point locations
as overlay
 Sample points and
corresponding contours
using naïve shading
GIS Examples – NCGIA
 Gray shading
uncertainty surface
captures distance
function used by
interpolation method
 Uncertainty encoded in
contour line widths
 Fill Clarity
 Resolution
GIS Techniques
 Contour Crispness
 Fog
Merging Data and Uncertainty
 Risk and
uncertainty
separately
 Risk and
uncertainty
combined
Basic Data Examples
 Errors
Basic Data Examples
 Errors
Basic Data Examples
 Ambiguation
Basic Data Examples
 Ambiguation
Photo Realistic
Uncertainty Vector Glyphs
Hue as Uncertainty
 With
out
 With
Texture as Uncertainty
Raw
Trans-
parent
Points
Cer-
tain-
ty
Opaque
Lines
 Data Confidence
 x is a device, α is decay constant, R(x) is a
weighting for device x in the calculation
Back to Wiisard
∑












•




 −
+
=
x
xpingtime
xposttimecurtime
xRC
α
)(
)(
1
1
)(
Back to Wiisard
 Individual data (annotation)
 Aggregate data (annotated/integrated)
Back to Wiisard
 Annotated
Back to Wiisard
 Integrated
Research Questions
 What are the dimensions of metrics relevant
for determining data quality for medical
providers in a mass casualty context?
 What kind of visualization best conveys the
use suitability for various kinds of data?
 Single data points
 Streaming bioinformation
 Aggregated information
Research Questions
 What kinds of visualizations are best suited to
field personnel?
 Non-IS frenzied technicians
 High glare, small footprint screens
 Low processing power
 What kinds of visualizations are best suited to
incident command?
 Seasoned experts
 Large, high density displays
 Highly connected with high data processing
Conclusion
 Data Quality and Uncertainty Visualization
are like the weather …
… everyone’s talks about it, but no one
does anything about it

Data quality and uncertainty visualization

  • 1.
    Data Quality and UncertaintyVisualization UC San Diego COGS 220 Winter Quarter 2006 Barry Demchak
  • 2.
    Immediate Motivation: Wiisard A joint project of Veterans Administration and UC San Diego, funded by the National Library of Medicine  Mass casualty triage and treatment  Enter patient information via PDAs  Patient information summarized on tablet PCs  Command/control for supervisors and incident comment personnel  Tied together using 802.11b and store-and- forward database access
  • 3.
    Wiisard – Explosionwith Pesticides
  • 4.
  • 5.
  • 6.
  • 7.
    Wiisard – TheProblem  What if the network becomes partitioned?  Tablet display shows out-of-date patient information  Summary displays are out of date, too  How does this lead to bad decisions?  Supervisors may mis-deploy doctors  Incident command may mis-deploy resources People may die
  • 8.
    DOD Example  Sensor-to-shooter(STS) Networks – Patrick Driscoll (USMA), June 2002
  • 9.
  • 10.
    DOD Example  “…our first attempt to get the military community to realize that there is a degree of uncertainty involved in (digital) information systems that cannot be engineered out of the system.”  “Ultimately, our concern was an awareness issue (for the decision maker) …”  “… woman at MITRE had proposed a system of tagging intelligence starting at the source in a way that would reflect the uncertainty of the data being put into the intel database.”
  • 11.
    The Problem  Howto visualize the uncertainty in data so that humans can exercise judgment in making the best decision  Accounting for uncertainty is not the same thing as visualizing uncertainty
  • 12.
    What Labs areInvolved  MIT Sloan School of Management  Richard Wang (Data Quality)  Penn State University  Alan MacEachren (GIS)  University of Maine  Kate Beard-Tisdale (GIS)  University of California, Santa Cruz  Alex Pang (Scientific Visualization)  University of Arkansas, Little Rock  Master of Sciences in Information Quality
  • 13.
    What Conferences areThere?  MIT Information Quality (IQatMIT)  ACM SIGMOD Workshop on Information Quality in  ACM SIGKDD (Knowledge Discovery and Data M  MIT International Conference on Information Qual
  • 14.
  • 15.
    Definition of DataQuality  From Wand & Wang:
  • 16.
    Metrics  Timeliness  Howup to date relative to intended purpose  Ballou et al:  Timeliness = Max(0, 1-(currency/volatility)  Currency = delivery_time – input_time  Volatility = length of time data remains valid  Apply sensitivity factor “s”: Timeliness ^ s
  • 17.
    Interplay with Uncertainty Metrics are application dependent  Metrics are data dependent  Metrics are user dependent  Question: If a metric describes an individual data element, what is the effect of aggregating data elements having uncertainty??
  • 18.
    GIS Examples –NCGIA  Sample point locations as overlay  Sample points and corresponding contours using naïve shading
  • 19.
    GIS Examples –NCGIA  Gray shading uncertainty surface captures distance function used by interpolation method  Uncertainty encoded in contour line widths
  • 20.
     Fill Clarity Resolution GIS Techniques  Contour Crispness  Fog
  • 21.
    Merging Data andUncertainty  Risk and uncertainty separately  Risk and uncertainty combined
  • 22.
  • 23.
  • 24.
  • 25.
  • 26.
  • 27.
  • 28.
  • 29.
    Hue as Uncertainty With out  With
  • 30.
  • 31.
     Data Confidence x is a device, α is decay constant, R(x) is a weighting for device x in the calculation Back to Wiisard ∑             •      − + = x xpingtime xposttimecurtime xRC α )( )( 1 1 )(
  • 32.
    Back to Wiisard Individual data (annotation)  Aggregate data (annotated/integrated)
  • 33.
  • 34.
  • 35.
    Research Questions  Whatare the dimensions of metrics relevant for determining data quality for medical providers in a mass casualty context?  What kind of visualization best conveys the use suitability for various kinds of data?  Single data points  Streaming bioinformation  Aggregated information
  • 36.
    Research Questions  Whatkinds of visualizations are best suited to field personnel?  Non-IS frenzied technicians  High glare, small footprint screens  Low processing power  What kinds of visualizations are best suited to incident command?  Seasoned experts  Large, high density displays  Highly connected with high data processing
  • 37.
    Conclusion  Data Qualityand Uncertainty Visualization are like the weather … … everyone’s talks about it, but no one does anything about it

Editor's Notes

  • #11 Comp Sci folks worry about bits being lost and transmission checking, principally in the data assurance domain. We were thinking more abstractly about the information products floating around such systems. What happens to data uncertainty as data gets integrated/aggregated over and over again? Is there a point at which it becomes useless??
  • #19 National Center for Geographic Information and Analysis: Visualization of the Quality of Spacial Information, May 1994 Visualize interpolation uncertainty in GIS measurements of some phenomenon,
  • #21 Visualizing Uncertain Information – Alan MacEacheren (Penn State), 1992
  • #22 Map of health risks due to air pollutants.
  • #23 From Visualizing Data with Bounded Uncertainty … Jock Mackinlay
  • #24 From Visualizing Data with Bounded Uncertainty … Jock Mackinlay
  • #25 From Visualizing Data with Bounded Uncertainty … Jock Mackinlay
  • #26 From Visualizing Data with Bounded Uncertainty … Jock Mackinlay
  • #27 From Visualizing Uncertainty for Improved Decision Making by Griethe and Schumann, University of Rostock Uncertainty about the true architecture of the medieval Kaiserpfalz is encoded as transparency
  • #28 Craig M. Wittenbrink and Alex T. Pang and Suresh K. Lodha."Glyphs for Visualizing Uncertainty in Vector Fields".In IEEE Transactions on Visualization and Computer Graphics,, vol. 2, no. 3, pp. 266--279, September, 1996. Shows suitability of various types of glyphs for representing anularity and magnitude
  • #29 From Visualizing Uncertainty for Improved Decision Making by Griethe and Schumann, University of Rostock Monterey Bay … magnitude and directional uncertainty in a flow vector field
  • #30 Photos are 3 different resolutions of a CAT scan of a cadaver (highest to lowest) From Uncertainty Visualization Methods in Isosurface Rendering by Rhodes, Laramee, et al (University of New Hampshire and VRVis in Austria … published in Eurographics 2003