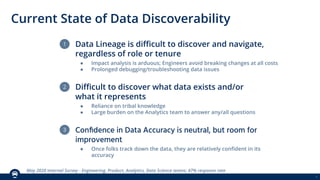
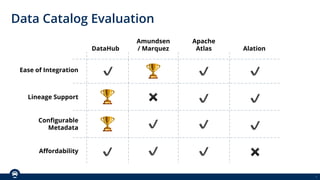
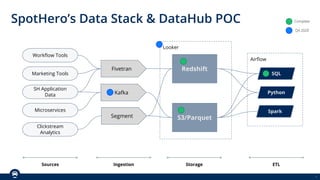
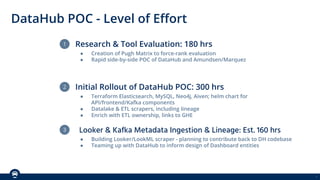
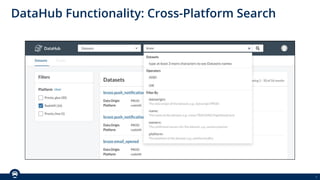
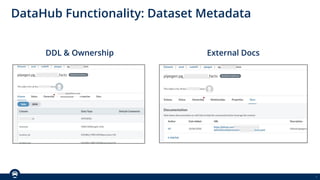
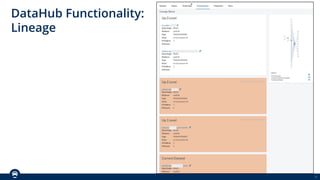
Presented on Data Quality Meetup by Maggie Hays, Senior Product Manager, Data Services @ SpotHero
Learn more about Data Quality Meetup
https://www.datafold.com/blog/data-quality-meetup-2
Citi Global T4I Accelerator Data and Analytics PresentationMarquis Cabrera
Presented on data and analytics for the Citi T4I Global Social Good Accelerator, which is an open innovation initiative seeking to source tech solutions that promote integrity around the world.
The document summarizes the key findings of the 2017 Data Science Survey conducted by Rexer Analytics. The survey received responses from over 1,000 analytic professionals across 91 countries. The survey found that the majority of respondents agree that formal data science training is needed to properly model data. It also found that about one-third of respondents reported difficulties when people at their company used do-it-yourself data tools without proper training. The survey showed that most data scientists use multiple tools for their work, with Python, R, SQL, and Tableau being some of the most commonly used. Deep learning techniques were also increasingly being used, with algorithms like convolutional neural networks being applied successfully across various domains.
Business analytics is the process of examining large volumes of various types of data to discover hidden patterns and correlations. This analysis can provide competitive advantages by helping organizations make more effective marketing and pricing decisions, leading to higher revenues. The data comes from traditional and unstructured sources and is organized and analyzed using statistical tools to make real-time decisions. Descriptive analytics describes past trends while predictive and prescriptive analytics determine future outcomes and best actions. Most data is structured but unstructured and semi-structured data from sources like text is growing.
Rafael Fiorott Oliveira completed the online, non-credit Specialization in Big Data from 2015 consisting of 6 courses taught by experts from various fields including Hadoop, machine learning, graph analytics, and predictive modeling. The specialization equipped Oliveira with skills to process, analyze, and extract meaningful information from large datasets and provided experience applying advanced analytics to real-world problems through a capstone project developed in partnership with Splunk.
Project analytics in Project ManagementKetan Gandhi
Project managers can use this predictive information to make better decisions and keep projects on schedule and on budget. Analytics does more than simply enable project managers to capture data and mark the tasks done when completed.
KDD 2019 IADSS Workshop - Standardizing data science to help hiring - Greg Ma...IADSS
This document discusses standardizing the data science profession to help with hiring. It proposes creating a structured, searchable portfolio for data scientists to document their past projects, models deployed, and skills. This would help hiring managers more easily find candidates that match their needs. The document also suggests developing standardized testing, like other professions have, to assess core and optional data science skills. Privacy-preserving techniques could allow confidential information to be shared between hiring managers reviewing candidates. The goal is to facilitate hiring qualified data scientists by systematically capturing their qualifications and experience.
The document discusses developing a scalable strategy for gathering and reporting analytics. It recommends framing important questions, auditing all potential data collection points, and evaluating which data should be analyzed. An example question is tracking undergraduate research downloads to show the impact of new initiatives. While not possible to track individual student downloads, demographics can provide insight. Developing an effective strategy includes prioritizing top questions, mapping related data points, determining relevant data, and creating visualizations to tell compelling stories with the data.
Data Scientist vs Data Analyst vs Data Engineer - Role & Responsibility, Skil...Simplilearn
In this presentation, we will decode the basic differences between data scientist, data analyst and data engineer, based on the roles and responsibilities, skill sets required, salary and the companies hiring them. Although all these three professions belong to the Data Science industry and deal with data, there are some differences that separate them. Every person who is aspiring to be a data professional needs to understand these three career options to select the right one for themselves. Now, let us get started and demystify the difference between these three professions.
We will distinguish these three professions using the parameters mentioned below:
1. Job description
2. Skillset
3. Salary
4. Roles and responsibilities
5. Companies hiring
This Master’s Program provides training in the skills required to become a certified data scientist. You’ll learn the most in-demand technologies such as Data Science on R, SAS, Python, Big Data on Hadoop and implement concepts such as data exploration, regression models, hypothesis testing, Hadoop, and Spark.
Why be a Data Scientist?
Data scientist is the pinnacle rank in an analytics organization. Glassdoor has ranked data scientist first in the 25 Best Jobs for 2016, and good data scientists are scarce and in great demand. As a data scientist you will be required to understand the business problem, design the analysis, collect and format the required data, apply algorithms or techniques using the correct tools, and finally make recommendations backed by data.
Simplilearn's Data Scientist Master’s Program will help you master skills and tools like Statistics, Hypothesis testing, Clustering, Decision trees, Linear and Logistic regression, R Studio, Data Visualization, Regression models, Hadoop, Spark, PROC SQL, SAS Macros, Statistical procedures, tools and analytics, and many more. The courseware also covers a capstone project which encompasses all the key aspects from data extraction, cleaning, visualisation to model building and tuning. These skills will help you prepare for the role of a Data Scientist.
Who should take this course?
The data science role requires the perfect amalgam of experience, data science knowledge, and using the correct tools and technologies. It is a good career choice for both new and experienced professionals. Aspiring professionals of any educational background with an analytical frame of mind are most suited to pursue the Data Scientist Master’s Program, including:
IT professionals
Analytics Managers
Business Analysts
Banking and Finance professionals
Marketing Managers
Supply Chain Network Managers
Those new to the data analytics domain
Students in UG/ PG Analytics Programs
Learn more at https://www.simplilearn.com/big-data-and-analytics/senior-data-scientist-masters-program-training
Reference Letter - Erica Lai_Cheesecake FactoryErica Lai
Erica Lai worked as a Data Mining Intern at The Cheesecake Factory in 2015. She was involved in projects analyzing price sensitivity and HR attrition. Her duties included exploring data, engineering features, analyzing data, and creating visualizations. She is capable of applying programming and data mining techniques to address problems and provide insights. Her supervisor recommends her without reservation, believing she will be an asset to any company.
KDD 2019 IADSS Workshop - How Data Scientists can bridge the gap between Data...IADSS
This document discusses how data science projects often fail due to a lack of business adoption and the gap between data and business needs. It provides statistics showing that 85% of big data projects fail and 80% of AI projects do not scale within organizations. Common reasons for failure include solving the wrong problem, having the wrong data or skills, and not clearly defining the business purpose. The document then discusses how organizations are addressing these issues through design thinking, design sprints, and focusing on actionable insights and simple, prototype models. It provides an example of a predictive maintenance model that scheduled maintenance to detect HVAC failures and improve customer service.
Data Science Salon: Applying Machine Learning to Modernize Business ProcessesFormulatedby
Next DSS MIA Event - https://datascience.salon/miami/
For most data scientist building models is hard work, but deploying them into production and impacting business processes can be even harder. In fact, research shows that only about 10% of data science models get deployed into production, and those that do can take between 6 to 9 months to be deployed. This session will highlight the challenges that data scientist and organizations alike face when trying to deploy machine learning models and how to overcome these challenges. It will examine several use cases where models built in R and Python have been able to deliver impactful results across several industries.
This document outlines topics related to data analytics including the definition of data analytics, the data analytics process, types of data analytics, steps of data analytics, tools used, trends in the field, techniques and methods, the importance of data analytics, skills required, and benefits. It defines data analytics as the science of analyzing raw data to make conclusions and explains that many analytics techniques and processes have been automated into algorithms. The importance of data analytics includes predicting customer trends, analyzing and interpreting data, increasing business productivity, and driving effective decision-making.
Multisoft Systems is a renowned training organization that focuses on providing quality training programs to the candidates. Their “Data Science with R” training program is designed for Data/Business Analysts and anyone who has an interest in the field of Data Science. You will learn to explore R data structures and syntaxes, work with data and transform them to fit your needs, create functions and use control flow, etc.
https://www.multisoftsystems.com
Implementation of data science in organizationsKoo Ping Shung
Many companies understand the importance of Data Science and the benefits that can be brought to the business. This being a very new field and successful examples are far and few, businesses have no idea how to begin with and start tapping value from the massive amount of data they have collected.
There will be a three-stage process to be shared, and what are the areas of focus that businesses should start working on and begin to gain more value and insights from their data based on past experiences and conversations with various industries.
Big data analytics examines large volumes of data from both traditional and unstructured sources to discover hidden patterns and correlations that can provide competitive advantages. This analysis can be done with traditional tools and techniques like data mining and predictive analytics, but large, unstructured data may not fit traditional data stores. Integrating new big data infrastructures with existing systems and enabling conventional data warehouses to handle large volumes of data at scale are challenges. The big data analytics process involves acquiring data from various sources, organizing the information, performing advanced analysis, and making rapid decisions.
Data Science Salon: Culture, Data Engineering and Hamburger Stands: Thoughts ...Formulatedby
The document discusses culture, data engineering, and approaches to data science at Netflix. It emphasizes that Netflix's data science culture values freedom and responsibility, and providing context rather than control. It also stresses that data engineering is equally as important as data science, as it allows data scientists to scale their work. The document contrasts two paradigms for structuring work - the "hamburger stand" approach of simply fulfilling requests, versus the "butler" approach of anticipating needs. It also overview how Netflix has built collaborative data science ecosystems.
Help Me, Help You: Supporting Your DataData Con LA
Data Con LA 2020
Description
Understand the data product lifecycle and ensure your data is set up for success
In order to get the most out of your data team, understanding the infrastructure needs at every step of the data product lifecycle is imperative. In my presentation we'll cover: - Collect the Right Data: Collect what you want in the future not where you are now - Silo to Warehouse: Consolidating disparate data sources and establish source of truth - Setting Your Team Up for Success: Development Platform and DataOps - Don't Forget to A.I.M. - Thinking about product adoption, implementation, and monitoring - So What? - Tracking impact and making the case for more data
Speaker
Kisa Brostrom, boodleAI, Vice President of Data
Data Scientist: The Sexiest Job in the 21st CenturyLyn Fenex
The document discusses the growing field of data science. It begins by defining data science and explaining how the rise of big data and the internet of things has led to an increasing demand for data scientists. It then examines the skills and qualifications needed for different types of data science roles, including data analysts, engineers, and research scientists. Finally, it provides resources for continuing to learn about data science.
What is this ‘Big Data’?
Introduction and Key words
Any secrets behind big data?
The 4V’s of Big Data
Big Data Analytics
What to do with this data?
Usefulness of Business Intelligence (BI)
Gianfranco Campana has completed a Specialization in Big Data from 2015 consisting of 6 courses: Introduction to Big Data, Hadoop Platform and Application Framework, Introduction to Big Data Analytics, Machine Learning With Big Data, Graph Analytics for Big Data, and a Capstone Project. The Specialization trained students to process, analyze, and extract meaningful information from large, complex data through scalable analysis and advanced analytics. Students applied these skills in a Capstone Project partnered with Splunk to analyze big data in their field of choice.
This document discusses the importance of rapid data integration for data science. It notes that data science requires accurate, up-to-date data to generate insights but requirements are difficult to determine in advance. An iterative, flexible approach is needed to integrate diverse data sources. The Kalido Information Engine supports this approach through business-focused modeling, automated processes, and rapid integration capabilities to provide timely, quality data for analysis and improving business results.
Tips and Tricks to be an Effective Data ScientistLisa Cohen
Data Science is an evolving field, that requires a diverse skill set. From Analytical Techniques to Career Advice, this talk is full of practical tips that you can apply immediately to your job.
The document provides an overview of different career paths in data science, including data scientist, data engineer, and data analyst roles. It summarizes the typical job duties, skills required, tools used, and average salaries for each role. Additionally, it notes the large and growing demand for data science professionals, with over 215,000 open jobs in the US as of January 2017 and top hiring locations of San Francisco, New York, and Seattle.
Make good products great with data and analyticsDavid Mathias
Using data and analytics to supercharge your products is important for all product managers. There are tons of ways to utilize analytics as a product manager whether it is: incorporating analytics into your product to provide more customer value; incorporating into business case or financial reporting to provide more value; utilizing to better understand the voice of the customer; or more effectively pricing your product to name a few. These slides are geared at people making products and how they can utilize data and analytics to make good products great.
Objective Benchmarking for Improved Analytics Health and EffectivenessPersonifyMarketing
Achieving a high state of analytics excellence can be a daunting task. It involves mastering progressive stages of data health, technological capability, and staff readiness, all while putting out countless fires and responding to last-minute requests for analysis. Strategic progress can be slow, and charting that progress for the executive team, cumbersome and uncertain.
Join us as Denny Lengkong from Personify Implementation Partner, IntelliData, and Personify's Solution Director, Bill Connell, present a rational framework for understanding analytics health and effectiveness. This webinar will help you learn how to make targeted investments in analytics over time that everyone in your organization will understand.
The Data Lake - Balancing Data Governance and Innovation Caserta
Joe Caserta gave the presentation "The Data Lake - Balancing Data Governance and Innovation" at DAMA NY's one day mini-conference on May 19th. Speakers covered emerging trends in Data Governance, especially around Big Data.
For more information on Caserta Concepts, visit our website at http://casertaconcepts.com/.
Keeping the Pulse of Your Data: Why You Need Data Observability to Improve D...Precisely
With the explosive growth of DataOps to drive faster and more confident business decisions, proactively understanding the quality and health of your data is more important than ever. Data observability is an emerging discipline within data quality used to expose anomalies in data by continuously monitoring and testing data using artificial intelligence and machine learning to trigger alerts when issues are discovered.
Join Julie Skeen and Shalaish Koul from Precisely, to learn how data observability can be used as part of a DataOps strategy to improve data quality and reliability and to prevent data issues from wreaking havoc on your analytics and ensure that your organization can confidently rely on the data used for advanced analytics and business intelligence.
Topics you will hear addressed in this webinar:
• Data observability – what is it and how it can complement your data quality strategy
• Why now is the time to incorporate data observability into your DataOps strategy
• How data observability helps prevent data issues from impacting downstream analytics
• How integrated data catalog capabilities allow you to understand the context of alerts.
• Examples of how data observability can be used to prevent real-world issues
Predictive Human Capital Analytics (1).pptxSaminaNawaz14
This document discusses predictive human capital analytics. It outlines gathering data from various departments and formats, analyzing descriptive and inferential statistics using tools like graphs and dashboards. Specific examples are provided of using regression, structural equation modeling to predict factors like SAT scores, profitability, and productivity. The document recommends correlation analysis and predictive modeling techniques. It envisions future human capital analytics integrating data from different fields and using big data and automated processes for continuous feedback.
NTEN Your Analytics doesn't have to be dramatic to be usefulAndrew Patricio
My presentation at the 2024 NTEN conference in Portland, OR. I talk about practical approaches and benefits to deploying your analytics and reporting systems. Three high level themes:
1. Focus on people not the system, in particular make sure you start with hiring someone who understands your data before building your system. Data analytics augments human intuition not replaces it.
2. Make sure you start with your organizational vision to define your business outcomes to define your metrics and analytics to define your data. In other words make sure you are tracking relevant data
3. It is more about evolution not revolution. Data science is incremental not sudden.
Joe Caserta, President at Caserta Concepts presented at the 3rd Annual Enterprise DATAVERSITY conference. The emphasis of this year's agenda is on the key strategies and architecture necessary to create a successful, modern data analytics organization.
Joe Caserta presented What Data Do You Have and Where is it?
For more information on the services offered by Caserta Concepts, visit out website at http://casertaconcepts.com/.
In this presentation at DAMA New York, Joe started by asking a key question: why are we doing this? Why analyze and share all these massive amounts of data? Basically, it comes down to the belief that in any organization, in any situation, if we can get the data and make it correct and timely, insights from it will become instantly actionable for companies to function more nimbly and successfully. Enabling the use of data can be a world-changing, world-improving activity and this session presents the steps necessary to get you there. Joe explained the concept of the "data lake" and also emphasizes the role of a strong data governance strategy that incorporates seven components needed for a successful program.
For more information on this presentation or Caserta Concepts, visit our website at http://casertaconcepts.com/.
Data-Ed Webinar: Data Modeling FundamentalsDATAVERSITY
Every organization produces and consumes data. Because data is so important to day to day operations, data trends are hitting the mainstream and businesses are adopting buzzwords such as Big Data, NoSQL, data scientist, etc., to seek solutions for their fundamental issues. Few realize that the importance of any solution, regardless of platform or technology, relies on the data model supporting it. Data modeling is not an optional task for an organization’s data effort. It is a vital activity that supports the solutions driving your business.
This webinar will address fundamental data modeling methodologies, as well as trends around the practice of data modeling itself. We will discuss abstract models and entity frameworks, as well as the general shift from data modeling being segmented to becoming more integrated with business practices.
Learning Objectives:
How are anchor modeling, data vault, etc. different and when should I apply them?
Integrating data models to business models and the value this creates
Application development (Data first, code first, object first)
How do you balance the need for structured and rule-based governance to assure enterprise data quality - with the imperative to innovate in order to stay relevant and competitive in today's business marketplace?
At the recent CDO Summit in NYC, a range of C-Level Executives across a variety of industries came to hear Joe Caserta, president of Caserta Concepts, put it all in perspective.
Joe talked about the challenges of "data sprawl" and the paradigm shift underway in the evolving big data and data-driven world.
For more information or to contact us, visit http://casertaconcepts.com/
Self-Service Data Analysis, Data Wrangling, Data Munging, and Data Modeling –...DATAVERSITY
This document summarizes a presentation on self-service data analysis, data wrangling, data munging, and how they fit together with data modeling. It discusses how these techniques allow business stakeholders and data scientists to prepare and transform data for analysis without extensive technical expertise. While these tools increase flexibility, they can also decrease governance if not used properly. The document advocates finding a balance between managed data assets and exploratory analysis to maximize insights while maintaining data quality.
Workshop with Joe Caserta, President of Caserta Concepts, at Data Summit 2015 in NYC.
Data science, the ability to sift through massive amounts of data to discover hidden patterns and predict future trends and actions, may be considered the "sexiest" job of the 21st century, but it requires an understanding of many elements of data analytics. This workshop introduced basic concepts, such as SQL and NoSQL, MapReduce, Hadoop, data mining, machine learning, and data visualization.
For notes and exercises from this workshop, click here: https://github.com/Caserta-Concepts/ds-workshop.
For more information, visit our website at www.casertaconcepts.com
This document discusses building a "DataScienceStein" team by combining existing staff members with different skills, rather than hiring a single data scientist. It recommends assembling a team with skills in data integration, analytics, visualization, industry expertise, communication, and programming. Key roles include a visualization specialist to communicate results and a subject matter expert to ensure the analysis makes sense. The advantages are broadening the hiring pool, fostering cross-training, and disseminating knowledge. Strong leadership is needed to direct the team's work and secure resources and support across departments.
Joe Caserta, President at Caserta Concepts, presented "Setting Up the Data Lake" at a DAMA Philadelphia Chapter Meeting.
For more information on the services offered by Caserta Concepts, visit our website at http://casertaconcepts.com/.
The data architecture of solutions is frequently not given the attention it deserves or needs. Frequently, too little attention is paid to designing and specifying the data architecture within individual solutions and their constituent components. This is due to the behaviours of both solution architects ad data architects.
Solution architecture tends to concern itself with functional, technology and software components of the solution
Data architecture tends not to get involved with the data aspects of technology solutions, leaving a data architecture gap. Combined with the gap where data architecture tends not to get involved with the data aspects of technology solutions, there is also frequently a solution architecture data gap. Solution architecture also frequently omits the detail of data aspects of solutions leading to a solution data architecture gap. These gaps result in a data blind spot for the organisation.
Data architecture tends to concern itself with post-individual solutions. Data architecture needs to shift left into the domain of solutions and their data and more actively engage with the data dimensions of individual solutions. Data architecture can provide the lead in sealing these data gaps through a shift-left of its scope and activities as well providing standards and common data tooling for solution data architecture
The objective of data design for solutions is the same as that for overall solution design:
• To capture sufficient information to enable the solution design to be implemented
• To unambiguously define the data requirements of the solution and to confirm and agree those requirements with the target solution consumers
• To ensure that the implemented solution meets the requirements of the solution consumers and that no deviations have taken place during the solution implementation journey
Solution data architecture avoids problems with solution operation and use:
• Poor and inconsistent data quality
• Poor performance, throughput, response times and scalability
• Poorly designed data structures can lead to long data update times leading to long response times, affecting solution usability, loss of productivity and transaction abandonment
• Poor reporting and analysis
• Poor data integration
• Poor solution serviceability and maintainability
• Manual workarounds for data integration, data extract for reporting and analysis
Data-design-related solution problems frequently become evident and manifest themselves only after the solution goes live. The benefits of solution data architecture are not always evident initially.
This document provides an overview of big data and how to get started with it. It introduces key concepts like what big data is, the different technology choices available and how to make an impact with data science. Specific topics covered include Hadoop and NoSQL databases, challenges of big data, sample use cases like customer churn analysis and the Expedia case study. The presentation emphasizes that big data is an evolving field and recommends taking a scientific approach to data analysis to drive business insights and impact.
Experience unparalleled data-driven success with our cutting-edge Data Scienc...proitbridgePvtLtd
This presentation will equip you with the knowledge and skills to navigate the Data Science Institute at Proitbridge For More info Call Us:9740230130 Visit Our Website:www.proitbridge.com
#datasciencecoursesinbangalore #dataanalystcourseinbangalore #datascienceinstituteinbangalore #bestinstitutefordatascienceinbangalore #datascienceinbangalore#proitbridge
Are you getting the most out of your data?SAS Canada
Data is an organizations most valuable asset, but raw data by itself has little value. To drive data’s worth, it must be managed and processed to extract value and information that decision makers can leverage and turn into actionable insights. It is the ways in which a company choses to put that information to use that will determine the true value of its data.
Through business intelligence and business analytic tools, businesses are enabling themselves to make more strategic, accurate decisions, while optimizing business processes. Hear from Info-Tech Research Group and learn what you need to consider when choosing an analytics solution provider. The webinar will highlight Info-Tech Research Group’s recently published vendor landscape for selecting and implementing Business Intelligence and Business Analytics solutions. The report positions SAS as the only leader across all four categories of Enterprise BI, Mid-Market BI, Enterprise BA and Mid-Market BA.
How to find new ways to add value to your auditsCaseWare IDEA
Past Presentation at IIA GAM
Aaron Boor, IT Audit & Project Automation Manager talks about how he uses technology and data analytics to deliver more value to his organization.
SLIDESHARE: www.slideshare.net/CaseWare_Analytics
WEBSITE: www.casewareanalytics.com
BLOG: www.casewareanalytics.com/blog
TWITTER: www.twitter.com/CW_Analytic
STATATHON: Unleashing the Power of Statistics in a 48-Hour Knowledge Extravag...sameer shah
"Join us for STATATHON, a dynamic 2-day event dedicated to exploring statistical knowledge and its real-world applications. From theory to practice, participants engage in intensive learning sessions, workshops, and challenges, fostering a deeper understanding of statistical methodologies and their significance in various fields."
Predictably Improve Your B2B Tech Company's Performance by Leveraging DataKiwi Creative
Harness the power of AI-backed reports, benchmarking and data analysis to predict trends and detect anomalies in your marketing efforts.
Peter Caputa, CEO at Databox, reveals how you can discover the strategies and tools to increase your growth rate (and margins!).
From metrics to track to data habits to pick up, enhance your reporting for powerful insights to improve your B2B tech company's marketing.
- - -
This is the webinar recording from the June 2024 HubSpot User Group (HUG) for B2B Technology USA.
Watch the video recording at https://youtu.be/5vjwGfPN9lw
Sign up for future HUG events at https://events.hubspot.com/b2b-technology-usa/
Learn SQL from basic queries to Advance queriesmanishkhaire30
Dive into the world of data analysis with our comprehensive guide on mastering SQL! This presentation offers a practical approach to learning SQL, focusing on real-world applications and hands-on practice. Whether you're a beginner or looking to sharpen your skills, this guide provides the tools you need to extract, analyze, and interpret data effectively.
Key Highlights:
Foundations of SQL: Understand the basics of SQL, including data retrieval, filtering, and aggregation.
Advanced Queries: Learn to craft complex queries to uncover deep insights from your data.
Data Trends and Patterns: Discover how to identify and interpret trends and patterns in your datasets.
Practical Examples: Follow step-by-step examples to apply SQL techniques in real-world scenarios.
Actionable Insights: Gain the skills to derive actionable insights that drive informed decision-making.
Join us on this journey to enhance your data analysis capabilities and unlock the full potential of SQL. Perfect for data enthusiasts, analysts, and anyone eager to harness the power of data!
#DataAnalysis #SQL #LearningSQL #DataInsights #DataScience #Analytics
State of Artificial intelligence Report 2023kuntobimo2016
Artificial intelligence (AI) is a multidisciplinary field of science and engineering whose goal is to create intelligent machines.
We believe that AI will be a force multiplier on technological progress in our increasingly digital, data-driven world. This is because everything around us today, ranging from culture to consumer products, is a product of intelligence.
The State of AI Report is now in its sixth year. Consider this report as a compilation of the most interesting things we’ve seen with a goal of triggering an informed conversation about the state of AI and its implication for the future.
We consider the following key dimensions in our report:
Research: Technology breakthroughs and their capabilities.
Industry: Areas of commercial application for AI and its business impact.
Politics: Regulation of AI, its economic implications and the evolving geopolitics of AI.
Safety: Identifying and mitigating catastrophic risks that highly-capable future AI systems could pose to us.
Predictions: What we believe will happen in the next 12 months and a 2022 performance review to keep us honest.
ViewShift: Hassle-free Dynamic Policy Enforcement for Every Data LakeWalaa Eldin Moustafa
Dynamic policy enforcement is becoming an increasingly important topic in today’s world where data privacy and compliance is a top priority for companies, individuals, and regulators alike. In these slides, we discuss how LinkedIn implements a powerful dynamic policy enforcement engine, called ViewShift, and integrates it within its data lake. We show the query engine architecture and how catalog implementations can automatically route table resolutions to compliance-enforcing SQL views. Such views have a set of very interesting properties: (1) They are auto-generated from declarative data annotations. (2) They respect user-level consent and preferences (3) They are context-aware, encoding a different set of transformations for different use cases (4) They are portable; while the SQL logic is only implemented in one SQL dialect, it is accessible in all engines.
#SQL #Views #Privacy #Compliance #DataLake
4th Modern Marketing Reckoner by MMA Global India & Group M: 60+ experts on W...Social Samosa
The Modern Marketing Reckoner (MMR) is a comprehensive resource packed with POVs from 60+ industry leaders on how AI is transforming the 4 key pillars of marketing – product, place, price and promotions.
06-04-2024 - NYC Tech Week - Discussion on Vector Databases, Unstructured Data and AI
Discussion on Vector Databases, Unstructured Data and AI
https://www.meetup.com/unstructured-data-meetup-new-york/
This meetup is for people working in unstructured data. Speakers will come present about related topics such as vector databases, LLMs, and managing data at scale. The intended audience of this group includes roles like machine learning engineers, data scientists, data engineers, software engineers, and PMs.This meetup was formerly Milvus Meetup, and is sponsored by Zilliz maintainers of Milvus.
1. Data Discoverability with DataHub
Maggie Hays
Senior Product Manager -- Data Services
Data Quality Meetup -- November 19, 2020
2. 2
Agenda
● Overview of Teams
● Current State of Data Discoverability
● Data Catalog Evaluation
● DataHub POC - Progress & Level of Effort
● Highlight: DataHub Functionality
3. 3
SpotHero’s Data-Focused Teams
Data Engineering
3 Engineers
SpotHero IQ
2 Engineers
3 Data Scientists
Analytics
3 Business Analysts
(We’re hiring!!)
4. 4
1
2
3
Current State of Data Discoverability
Data Lineage is difficult to discover and navigate,
regardless of role or tenure
● Impact analysis is arduous; Engineers avoid breaking changes at all costs
● Prolonged debugging/troubleshooting data issues
Difficult to discover what data exists and/or
what it represents
● Reliance on tribal knowledge
● Large burden on the Analytics team to answer any/all questions
Confidence in Data Accuracy is neutral, but room for
improvement
● Once folks track down the data, they are relatively confident in its
accuracy
May 2020 Internal Survey - Engineering, Product, Analytics, Data Science teams; 47% response rate
7. 7
1
2
3
DataHub POC - Level of Effort
Research & Tool Evaluation: 180 hrs
● Creation of Pugh Matrix to force-rank evaluation
● Rapid side-by-side POC of DataHub and Amundsen/Marquez
Initial Rollout of DataHub POC: 300 hrs
● Terraform Elasticsearch, MySQL, Neo4j, Aiven; helm chart for
API/frontend/Kafka components
● Datalake & ETL scrapers, including lineage
● Enrich with ETL ownership, links to GHE
Looker & Kafka Metadata Ingestion & Lineage: Est. 160 hrs
● Building Looker/LookML scraper - planning to contribute back to DH codebase
● Teaming up with DataHub to inform design of Dashboard entities