The document provides guidance on effectively discussing data in three main areas:
1. It outlines important verbs, adverbs, and prepositions to use when describing trends in data.
2. It presents a checklist for data description and phrases to use for data interpretation.
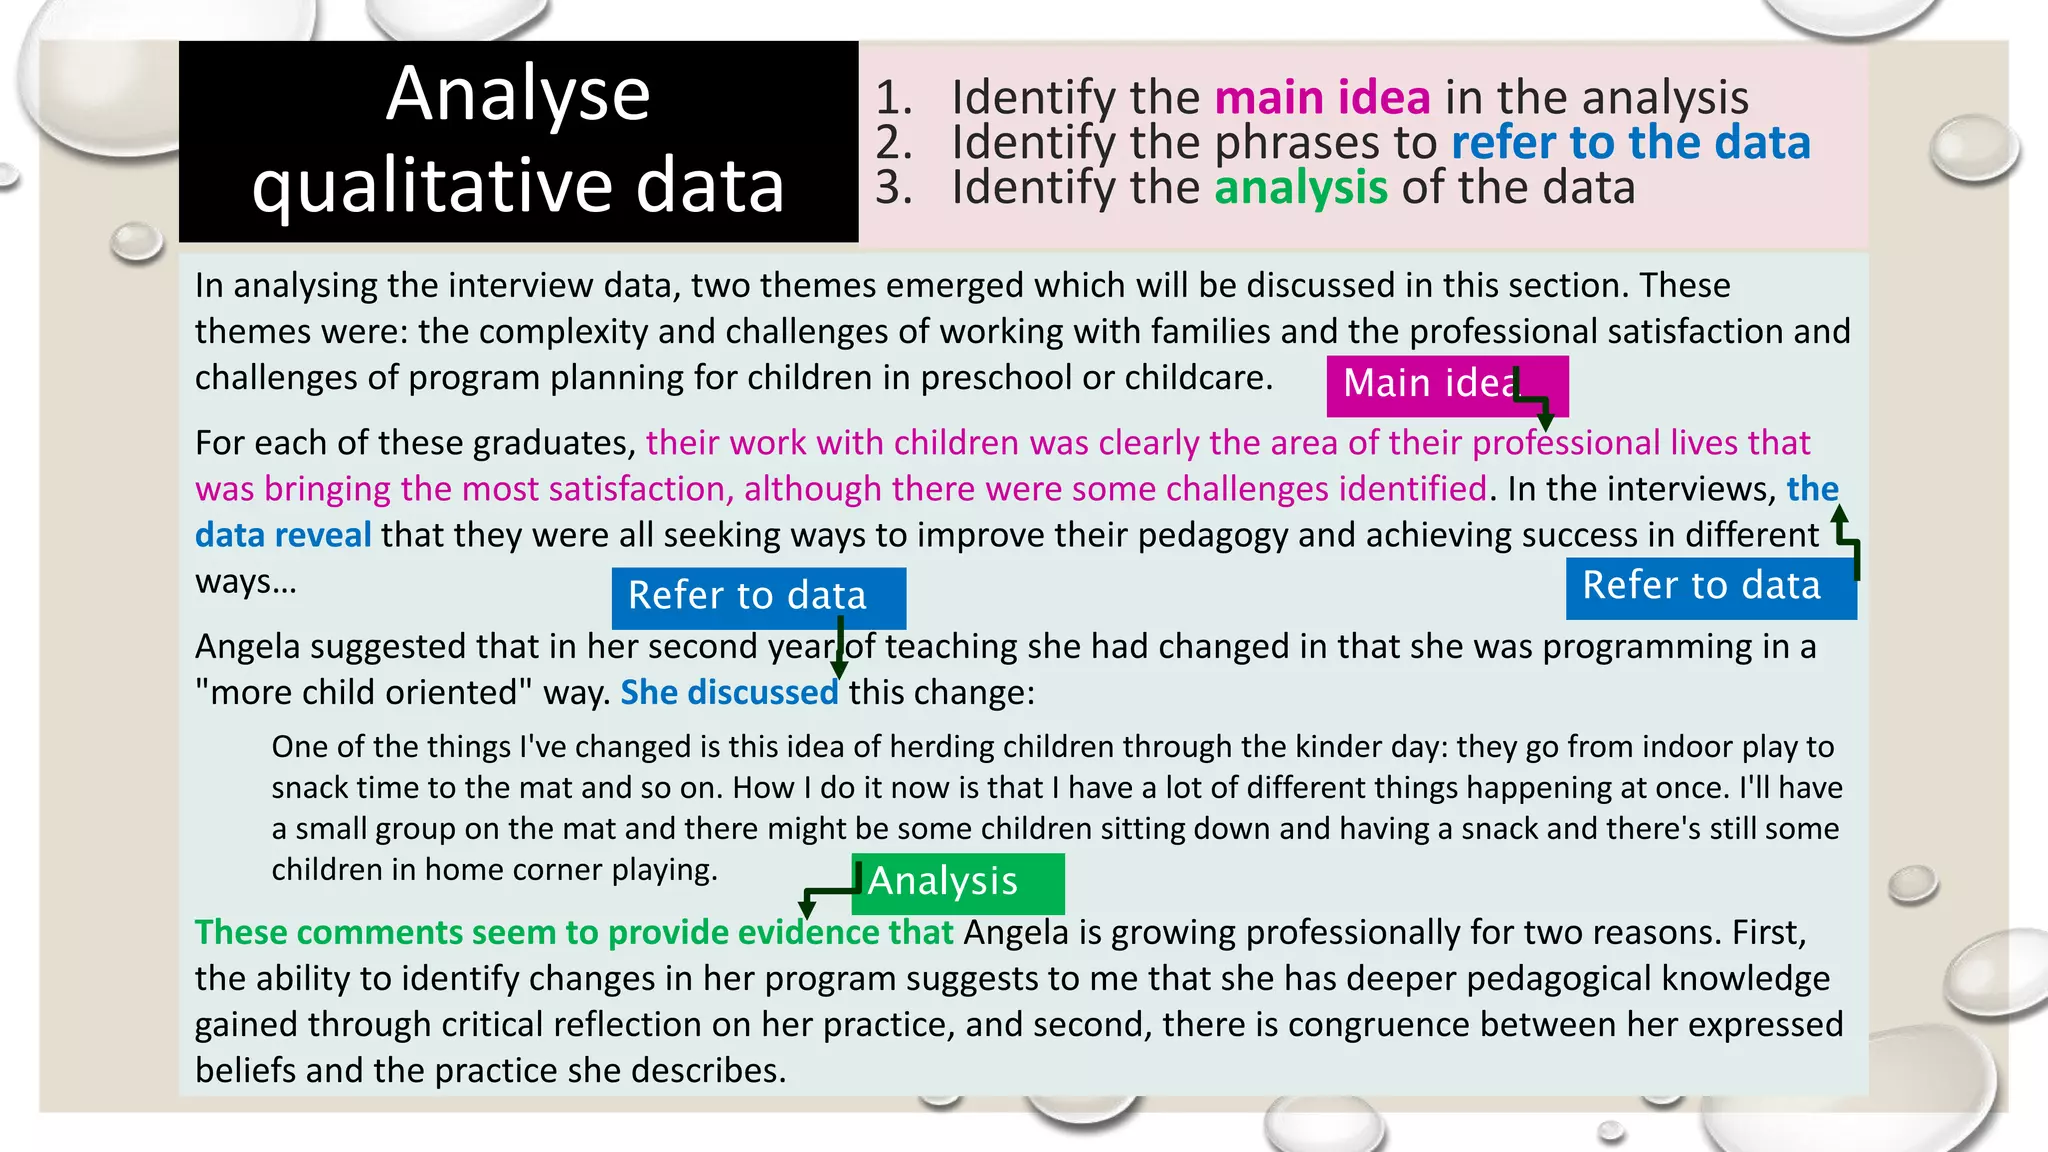
3. It demonstrates the steps to take in data discussion, including introducing the data, describing trends, comparing trends, and analyzing qualitative data.