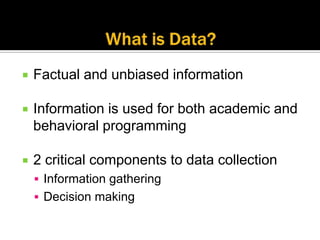
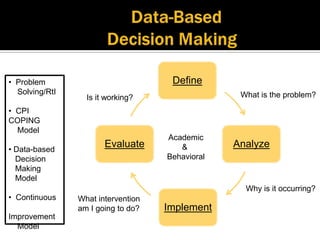
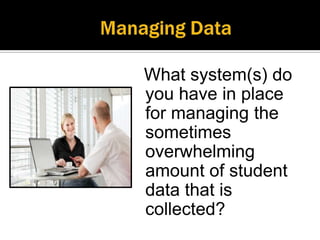
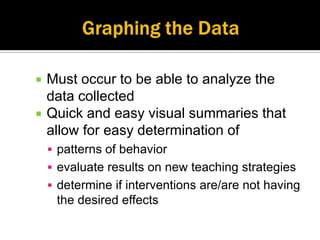
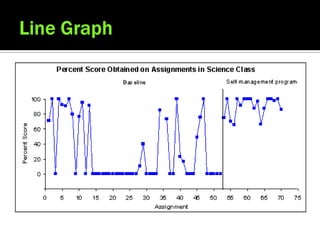
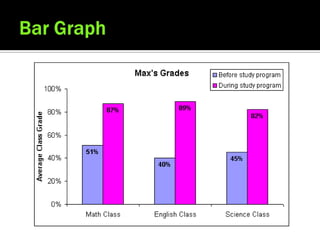
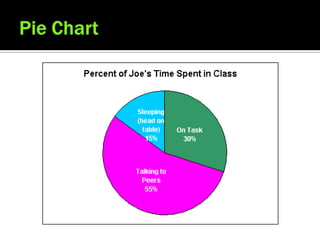
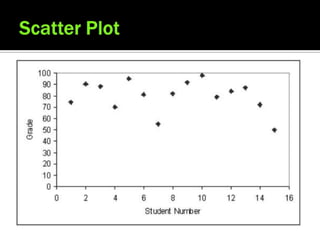
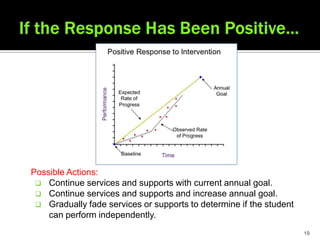
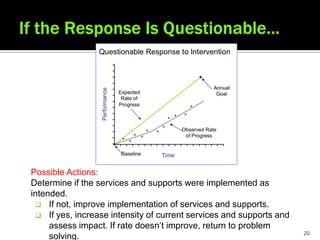
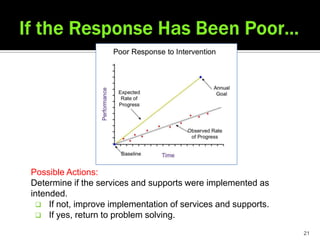
This document discusses the importance of data collection and analysis in providing educational services to students. It outlines several key components: collecting objective, measurable data; using various data collection methods; ensuring consistent and proper data collection; analyzing data visually through graphs and charts; and using data to make instructional decisions by evaluating progress and determining if interventions are working or need to be modified. The goal is to use a continuous improvement model to monitor student response and appropriately support students.
Andrea Williams of Conwy County Council delivered this workshop to provide participants at the All Wales Residential Participation Network 2012 with ideas to develop an action plan after engagement using a real life case study.
Participants identified best practice in developing action plans, developed actions from engagement data using participatory techniques and identified the key components of an action plan to ensure delivery.
Fe wnaeth Andrea Williams o Gyngor Sir Conwy darparu'r gweithdy yma i gyfranogwyr o Rwydwaith Cyfranogaeth Preswyl Cymru Gyfan 2012 i roi syniadau ar datblygu cynllun gweithredu ar ôl ymgysylltu gan ddefnyddio astudiaeth achos bywyd go iawn.
Fe wnaeth cyfranogwyr canfod arferion gorau mewn datblygu cynlluniau gweithredu, datblygu gweithredu o ddata ymgysylltu gan ddefnyddio technegau cyfranogol a chlustnodi prif gydrannau cynllun gweithredu er mwyn sicrhau darpariaeth.
FIGURE 1SUMMARY INFORMATION1. Discuss the overall purpose of this.docxssuser454af01
FIGURE 1SUMMARY INFORMATION1. Discuss the overall purpose of this data and how it should be used in analyzing the effectiveness of the program.2. Using the data contained in this figure, discuss the implications with regard to the effectiveness of the program. FIGURE 1: SUMMARY OF PATHWAY'S STAFF FEEDBACKStaff were provided with anonymous written surveys and asked to comment on specific aspects of the current interventions in place. Below are a sample of questions and responses to staff.Question 1. How successful are the current intervention plans?Responses: Very successful. All the kids inappropriate behavior has decreasedStill a lot of inappropriate behavior.I do not understand how to implement the new behavior plans. They take too much time and do not work.Question 2. What did you learn from the staff training provided by Acme?Responses:How to identify the functions of behavior.That behavior can get worse when given attention.I did not learn anything new.
FIGURE 2SUMMARY INFORMATION1. Use visual analysis and discuss the level, trend, and variability of the challenging behavior incidents reported during baseline (before) and treatment (after the intervention). 2. Using the data, describe the effect that the intervention had on the frequency of behavior incidents within Pathways.3. Considering the level of data, as well as any trends in the data, discuss the effectiveness of the program.FIGURE 2: FREQUENCY OF CHALLENGING BEHAVIORSBaseline (No Program)Intervention (Program Implemented)MonthSEPTOCTNOVDECJANFEBMARAPRMAYJunefx of challenging behavior incidents2482702902502902401501008030
Figure 2
SEPT OCT NOV DEC JAN FEB MAR APR MAY June 248 270 290 250 290 240 150 100 80 30
Month
fx of challenging behavior incidents
Figure 2
SEPT OCT NOV DEC JAN FEB MAR APR MAY June 248 270 290 250 290 240 150 100 80 30
Month
fx of challenging behavior incidents
before program (Baseline)
Figure 2
SEPT OCT NOV DEC JAN FEB MAR APR MAY June 248 270 290 250 290 240 150 100 80 30
Month
fx of challenging behavior incidents
FIGURE 3SUMMARY INFORMATION1. Calculate the total frequency of physical aggression for each observer. 2. Using the total count method of IOA, calculate the percentage of Inter-observer Agreement.3. Discuss the result of IOA.
- Is the IOA percentage within the acceptable range?
- Discuss what changes should be considered in relation to increase the IOA percentage. If changes are not necessary discuss what factors contribute to high percentage of Inter-observer agreement.
4. Discuss how IOA measures can be used to assist with determining the effectiveness of the program.FIGURE 3: OBSERVER DATA ON FREQUENCY OF PHYSICAL AGGRESSIOON DURING 10 MIN OBSERVATIONIntervalObserver 1Observer 21112223124445336117218219221012NotesEach interval represents 1 minute of observation.Both observers were presented with the same defintion for physical aggression and told to mark down the frequency of the behavior for each 1 minute interval.The ...
Learning Analytics Primer: Getting Started with Learning and Performance Anal...Watershed
Navigating the scope of disruptive analytics solutions to deliver maximum impact. Learn more about the importance of scalable learning in organizations that want to embrace an environment of continuous improvement. Mike Rustici provides a workshop on the five steps to get started with learning and performance analytics. Ranging from gathering your data using methods like experience API, to setting metrics and evaluating impact of learning programs.
Why limit ourselves to traditional quantitative metrics like visitor count, page weight, conversion, and revenue when there is so much valuable qualitative data available? We can turn qualitative data into quantitative data and use the same rigorous analysis techniques to help lead us to better designs, products, services, and experiences.
In Chuck Norris we trust - A3 thinking introHanno Jarvet
How to get rid of assumptions, egos and opinions and base your change initiatives on data instead. A3 thinking allows you to craft strategies for change and improvement. Here is a short overview of how to do it.
Data analytics experts Metageni briefly explain how global information giant LexisNexis models user success from user analytics data using machine learning. A Moo.com tech talk for analysts and engineers with an interest in data science, covering the high level classifier method used in support of LexisNexis, working with their global digital team.
2. Assessment
Measurement
Legal Accountability
Collaboration
Documentation
Problem Solving
Monitoring
Provide Feedback
Diana Ferreira, Amy Rowe and
Ann Cacciatore, OCPS
3. Factual and unbiased information
Information is used for both academic and
behavioral programming
2 critical components to data collection
Information gathering
Decision making
4. • Problem Define
Solving/RtI What is the problem?
Is it working?
• CPI
COPING
Model
Academic
• Data-based
Evaluate & Analyze
Decision Behavioral
Making
Model
Why is it occurring?
• Continuous What intervention
am I going to do? Implement
Improvement
Model
5. SUBJECTIVE (UN-
OBJECTIVE (MEASURABLE)
MEASURABLE)
Logan throws a tantrum Logan cries and kicks
when he does not get his objects/people when he
way. is denied access to the
computer.
Angelina will identify When given a verbal
numbers. prompt “touch the
number ___”, Angelina
will expressively identify
the requested number
given an array of 3
choices.
6. Is objective and non-judgmental
Helps to define the problem
Original data (before any intervention has
taken place)
Is used to compare and evaluate the
effectiveness of the intervention
7. Event Recording / Frequency Record how many times a behavior occurs Green
Duration Used to document the amount of time a student Blue
spends in engaging in a behavior
A-B-C Antecedent – Behavior – Consequence Purple
Documents what occurs before/after a behavior
Percent Correct Number of correct responses divided by the total Pink
number of opportunities to respond
Latency Documents how long it takes for a behavior begin Orange
after a demand or event occurs
Diana Ferreira, Amy Rowe
and
8. Be consistent in the type of data
collected
Ensure that all who are taking data
have been trained and understand
the data collection tool being used.
Does intervention/data collection
plan pass the “Stranger Test”?
12. What system(s) do
you have in place
for managing the
sometimes
overwhelming
amount of student
data that is
collected?
13. Must occur to be able to analyze the
data collected
Quick and easy visual summaries that
allow for easy determination of
patterns of behavior
evaluate results on new teaching strategies
determine if interventions are/are not having
the desired effects
14.
15.
16.
17.
18. Review data points every 3 sessions
Ask yourself is the data…
Improving?
Staying the same (flattening)?
Worsening?
Make a decision!
19. Possible Actions:
Continue services and supports with current annual goal.
Continue services and supports and increase annual goal.
Gradually fade services or supports to determine if the student
can perform independently.
19
20. Possible Actions:
Determine if the services and supports were implemented as
intended.
If not, improve implementation of services and supports.
If yes, increase intensity of current services and supports and
assess impact. If rate doesn’t improve, return to problem
20
solving.
21. Possible Actions:
Determine if the services and supports were implemented as
intended.
If not, improve implementation of services and supports.
If yes, return to problem solving.
21
Editor's Notes
Sketch your classroom
Assessment-objective assessment of behavior changeMeasurement-student making progressLegal accountability-Communication-Across settings and peopleDocumentation-Prevents relying on memoryProblem solving-Difficulties in progressMonitor-Determine effectivenessProvide feedback-To students parents and staffAt a meeting, rather than saying Michael never does any work. It would be much better to pull data which shows that Michael is only on task 50% of each class period.The IEP will drive your data collection and makes you responsible for providing information about behavior and social skills in a logical, precise, tangible method.
Props: index card file folder, post-it note folder, ring w/ cards, binders, etc.
In reviewing the IEP, the student’s rate of progress and the likelihood of achieving the annual goals should be the first indicator of how well the IEP is working for the student.The student’s progress towards the annual goal is measured through ongoing data collection. To determine if the response has been positive, the teacher or the IEP team will look at the data to see if the gap between current and expected student performance is closing. The expected performance is the target set in the annual goal. Take a look at this graph of student progress. The green line shows the expected rate of progress for the student to reach the goal. The dotted line shows the student’s actual progress. Does the gap between the two appear to be closing? Yes!If the response has been positive, the following actions are possible:Continue services and supports with current annual goal.Continue services and supports and increase annual goal.Gradually fade services or supports to determine if the student can perform independently.This may look familiar to you. This decision rule is from the PS-RtI framework. The progress-monitoring data charts and descriptions of possible actions are adapted from the book Guiding Tools for Instructional Problem Solving (GTIPS) (2011). Hold up the GTIPS Book.Note: If participants inquire about where to find graphing programs, mention that progress-monitoring software is sometimes available with their reading and mathematics curricula. If not, they can create progress-monitoring graphs using database software such as Excel. Graphing programs for progress monitoring are also available for download online.
A questionable response is when the rate of progress is not sufficient to close the gap, as shown in this graph.If the response is questionable, the following actions are possible:Determine if the services and supports were implemented as intended. This is where monitoring with integrity comes into play. If not, improve the implementation of services and supports.If yes, increase intensity of current services and supports and assess impact. If the rate of progress doesn’t improve, return to problemsolving.
A poorresponse is when the gap continues to widen with no change or improvement in the rate of progress.If the response is poor, the following actions are possible:Determine if the services and supports were implemented as intended, including instruction, accommodations, etc.If not, improve implementation of services and supports.If yes, return to problemsolving. Review student data to make sure the correct problem is identified and/or change the instructional strategy or supports as needed (e.g., change an accommodation that does not appear to be enabling the student to perform as anticipated).