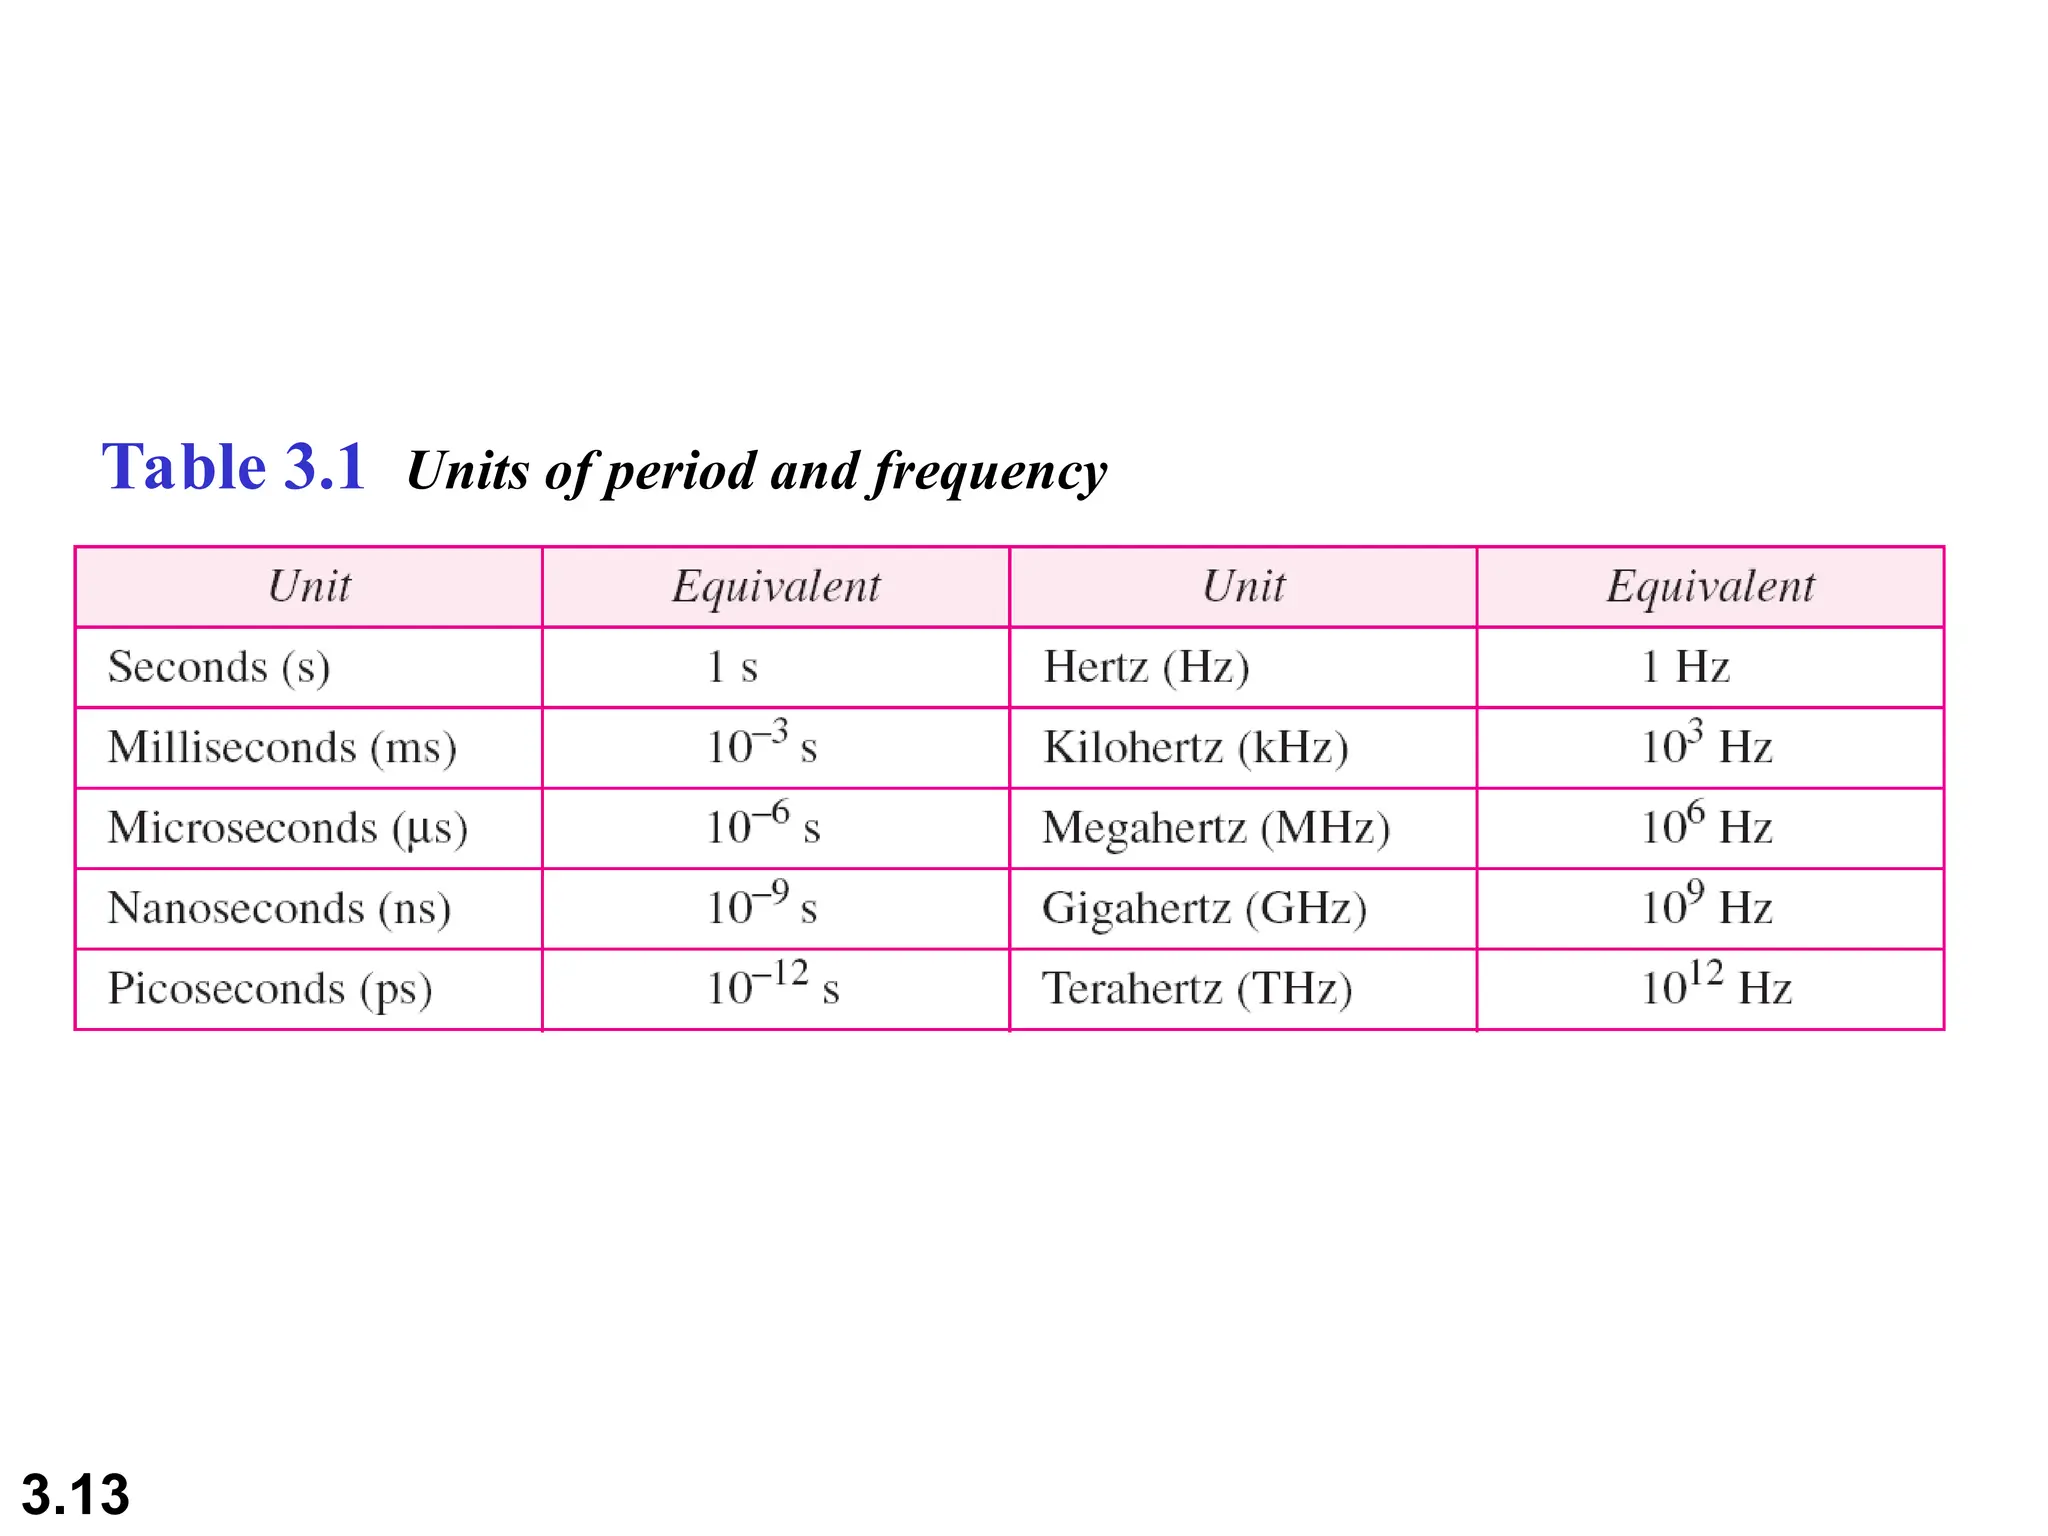
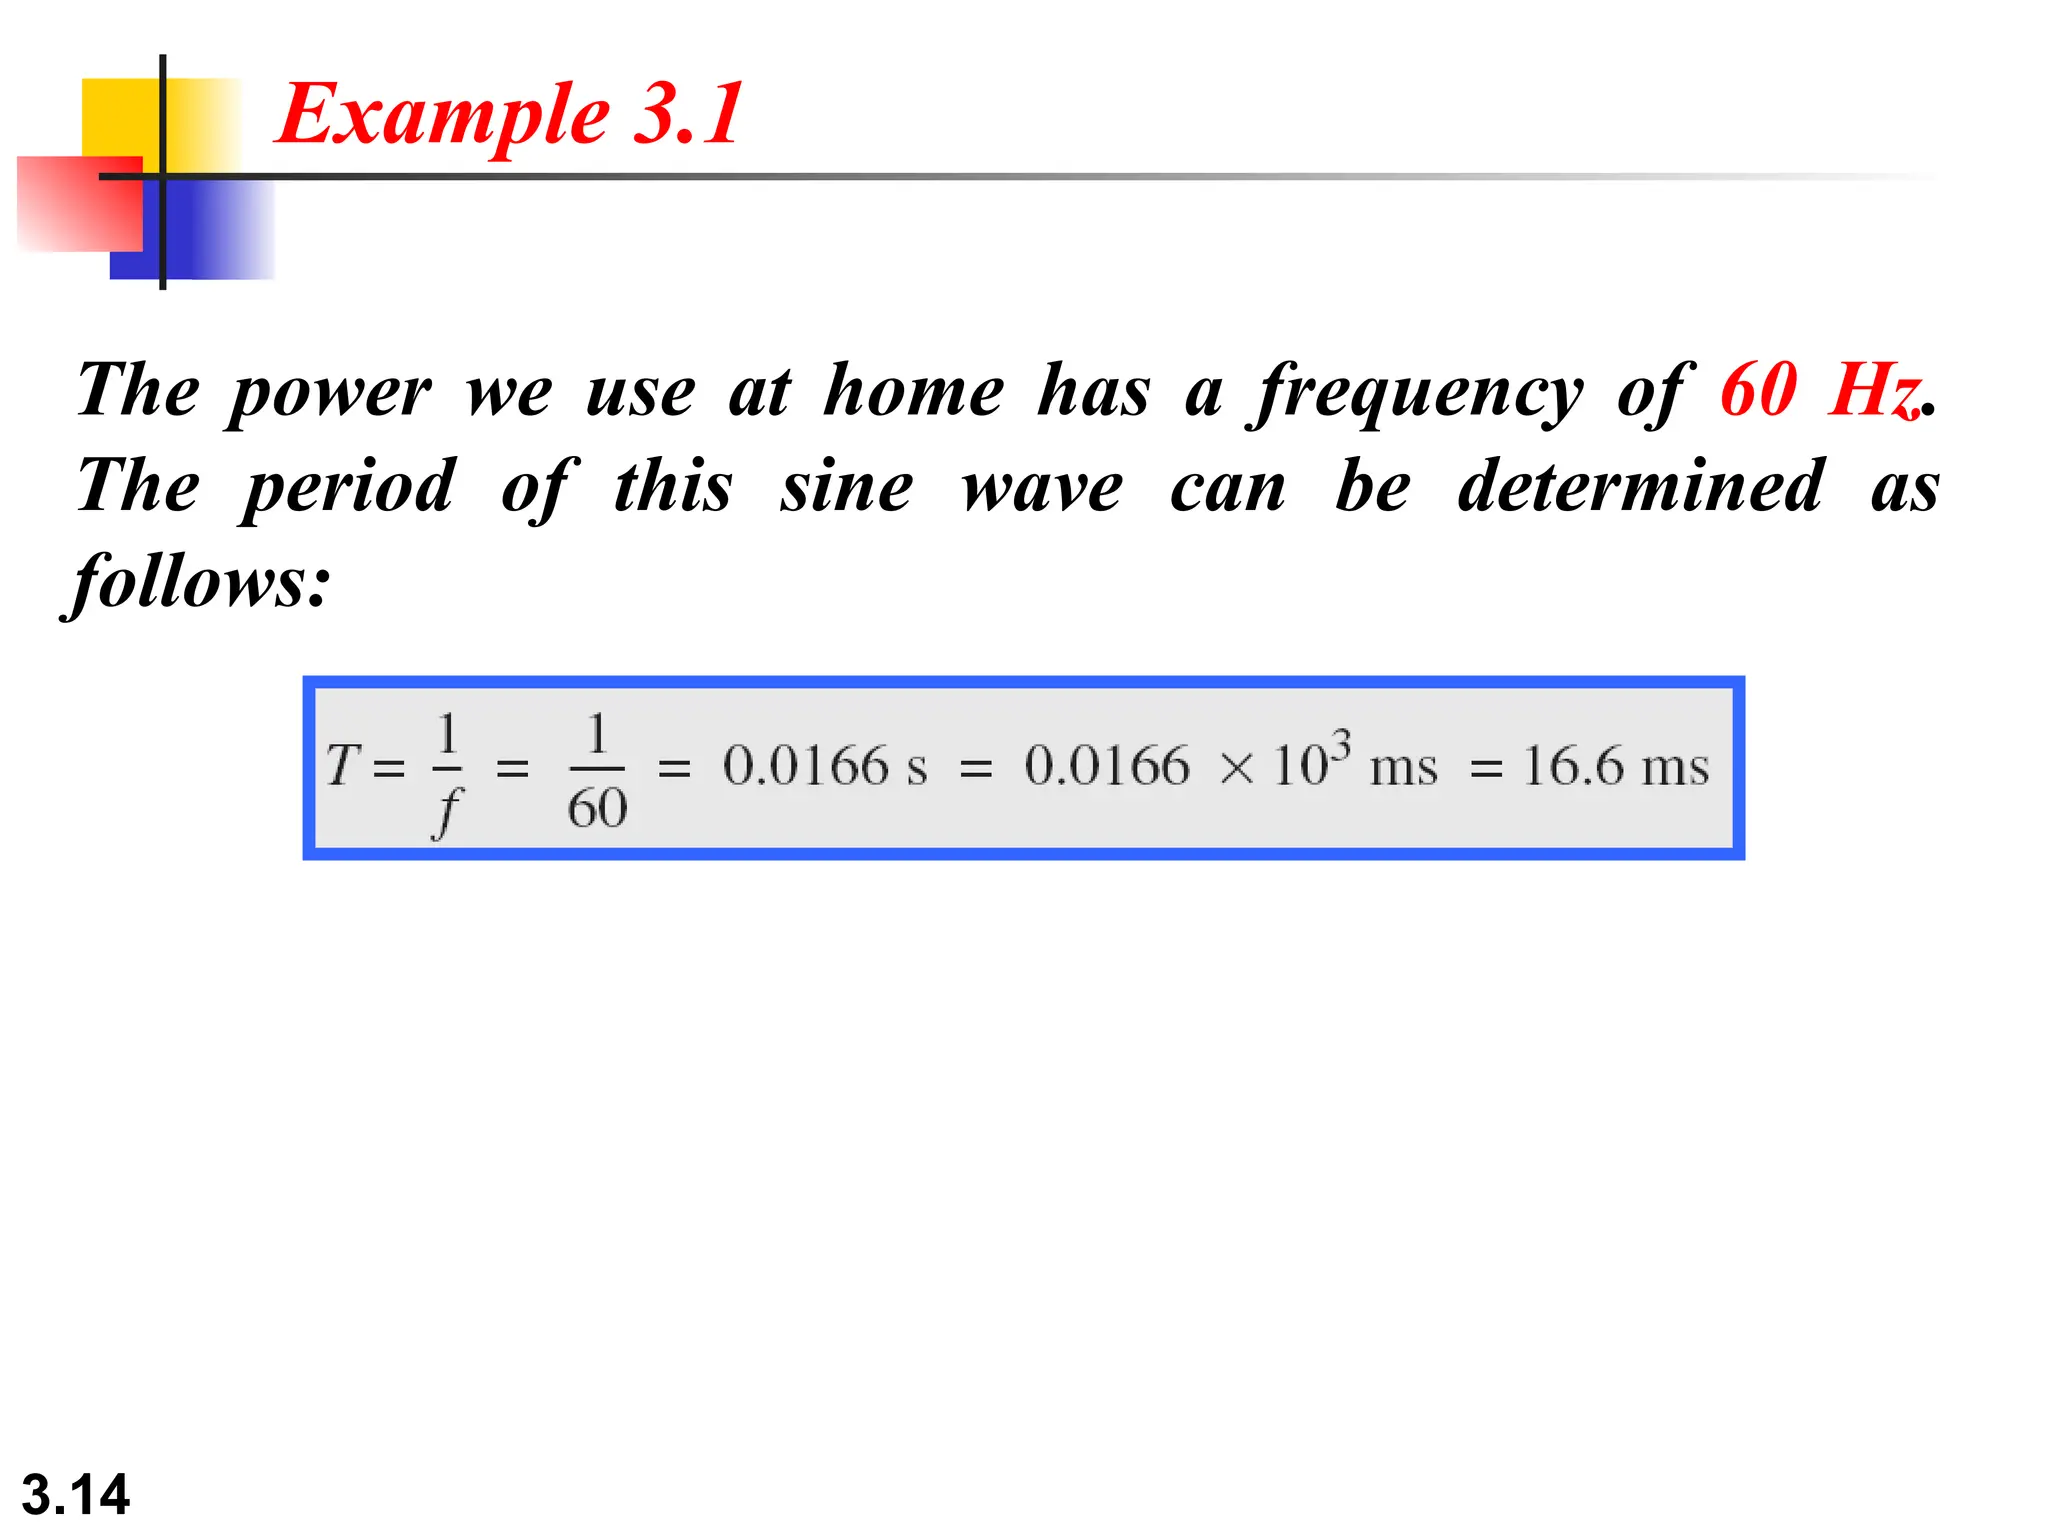
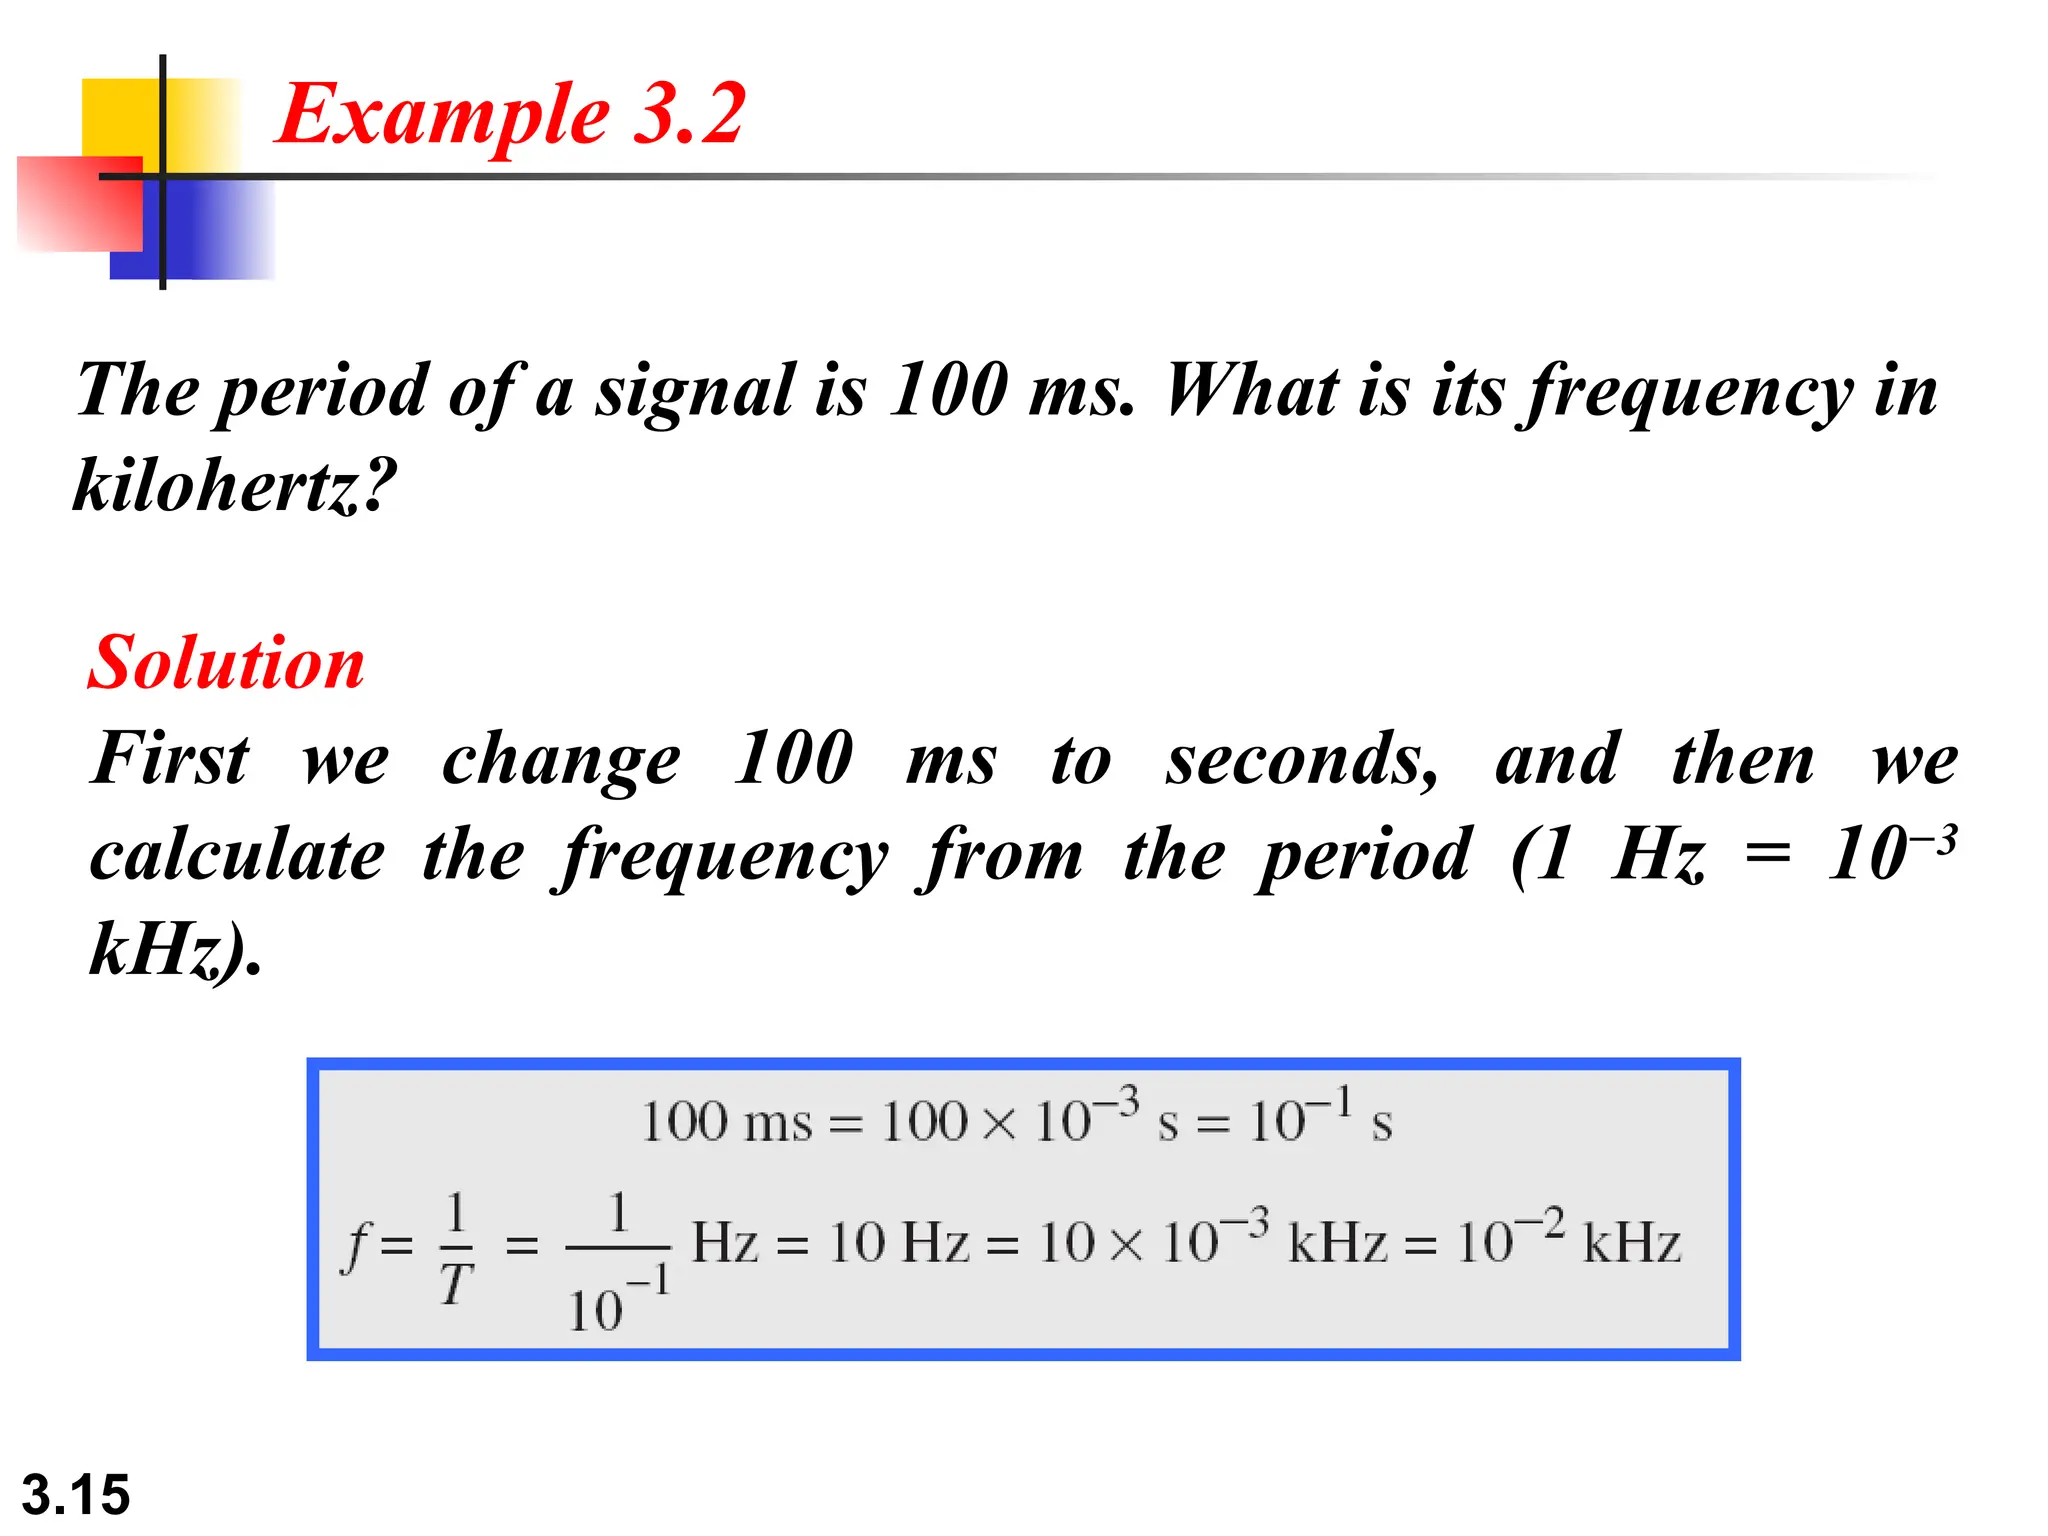
3.1
Chapter 3
Data and Signals
Copyright © The McGraw-Hill Companies, Inc. Permission required for reproduction or display.
3.2
To be transmitted, data must be
transformed to electromagnetic signals.
Note
3.3
3-1 ANALOG AND DIGITAL
Data can be
Data can be analog
analog or
or digital
digital. The term
. The term analog data
analog data refers
refers
to information that is continuous;
to information that is continuous; digital data
digital data refers to
refers to
information that has discrete states. Analog data take on
continuous values. Digital data take on discrete values.
 Analog and Digital Data
 Analog and Digital Signals
 Periodic and Nonperiodic Signals
Topics discussed in this section:
3.4
Analog and Digital Data
 Data can be analog or digital.
 Analog data are continuous and take
continuous values.
 Digital data have discrete states and take
discrete values.
3.5
Analog and Digital Signals
• Signals can be analog or digital.
• Analog signals can have an infinite number
of values in a range.
• Digital signals can have only a limited
number of values.
3.6
Figure 3.1 Comparison of analog and digital signals
3.7
3-1-3 PERIODIC and NONPERIODIC
Both analog and digital signals can take one of two forms: periodic
or nonperiodic (sometimes referred to as aperiodic; the prefix a in
Greek means “non”).
•A periodic signal completes a pattern within a measurable time
frame, called a period, and repeats that pattern over subsequent
identical periods.
•The completion of one full pattern is called a cycle.
•A nonperiodic signal changes without exhibiting a pattern or cycle
that repeats over time.
Both analog and digital signals can be periodic or nonperiodic. In
data communications, we commonly use periodic analog signals and
nonperiodic digital signals
3.8
3-2 PERIODIC ANALOG SIGNALS
In data communications, we commonly use periodic
analog signals and nonperiodic digital signals.
Periodic analog signals can be classified as
Periodic analog signals can be classified as simple
simple or
or
composite
composite. A simple periodic analog signal, a
. A simple periodic analog signal, a sine wave
sine wave,
,
cannot be decomposed into simpler signals. A composite
periodic analog signal is composed of multiple sine
waves.
waves.
 Sine Wave
 Wavelength
 Time and Frequency Domain
 Composite Signals
 Bandwidth
Topics discussed in this section:
3.9
Figure 3.2 A sine wave
3.10
Figure 3.3 Two signals with the same phase and frequency,
but different amplitudes
3.11
Frequency and period are the inverse of
each other.
Note
3.12
Figure 3.4 Two signals with the same amplitude and phase,
but different frequencies
3.13
Table 3.1 Units of period and frequency
3.14
The power we use at home has a frequency of 60 Hz.
The period of this sine wave can be determined as
follows:
Example 3.1
3.15
The period of a signal is 100 ms. What is its frequency in
kilohertz?
Example 3.2
Solution
First we change 100 ms to seconds, and then we
calculate the frequency from the period (1 Hz = 10−3
kHz).
3.16
Frequency
• Frequency is the rate of change with respect
to time.
• Change in a short span of time means high
frequency.
• Change over a long span of
time means low frequency.
3.17
If a signal does not change at all, its
frequency is zero.
If a signal changes instantaneously, its
frequency is infinite.
Note
3.18
Phase describes the position of the
waveform relative to time 0.
Note
3.19
Figure 3.5 Three sine waves with the same amplitude and frequency,
but different phases
3.20
A sine wave is offset 1/6 cycle with respect to time 0.
What is its phase in degrees and radians?
Example 3.3
Solution
We know that 1 complete cycle is 360°. Therefore, 1/6
cycle is
3.21
Figure 3.6 Wavelength and period
3.22
Figure 3.7 The time-domain and frequency-domain plots of a sine wave
3.23
A complete sine wave in the time
domain can be represented by one
single spike in the frequency domain.
Note
3.24
The frequency domain is more compact and
useful when we are dealing with more than one
sine wave. For example, Figure 3.8 shows three
sine waves, each with different amplitude and
frequency. All can be represented by three
spikes in the frequency domain.
Example 3.7
3.25
Figure 3.8 The time domain and frequency domain of three sine waves
3.26
Signals and Communication
 A single-frequency sine wave is not
useful in data communications
 We need to send a composite signal, a
signal made of many simple sine waves.
 According to Fourier analysis, any
composite signal is a combination of
simple sine waves with different
frequencies, amplitudes, and phases.
3.27
Composite Signals and
Periodicity
 If the composite signal is periodic, the
decomposition gives a series of signals
with discrete frequencies.
 If the composite signal is nonperiodic, the
decomposition gives a combination of
sine waves with continuous frequencies.
3.28
Figure 3.11 The time and frequency domains of a nonperiodic signal
3.29
Bandwidth and Signal
Frequency
 The bandwidth of a composite signal is
the difference between the highest and
the lowest frequencies contained in that
signal.
3.30
Figure 3.12 The bandwidth of periodic and nonperiodic composite signals
3.31
If a periodic signal is decomposed into five sine waves
with frequencies of 100, 300, 500, 700, and 900 Hz, what
is its bandwidth? Draw the spectrum, assuming all
components have a maximum amplitude of 10 V.
Solution
Let fh be the highest frequency, fl the lowest frequency,
and B the bandwidth. Then
Example 3.6
The spectrum has only five spikes, at 100, 300, 500, 700,
and 900 Hz (see Figure 3.13).
3.32
Figure 3.13 The bandwidth for Example 3.6
3.33
A periodic signal has a bandwidth of 20 Hz. The highest
frequency is 60 Hz. What is the lowest frequency? Draw
the spectrum if the signal contains all frequencies of the
same amplitude.
Solution
Let fh be the highest frequency, fl the lowest frequency,
and B the bandwidth. Then
Example 3.7
The spectrum contains all integer frequencies. We show
this by a series of spikes (see Figure 3.14).
3.34
Figure 3.14 The bandwidth for Example 3.7
3.35
Figure 3.15 The bandwidth for Example 3.8

Data and Signals ppt in physical layersn

  • 1.
    3.1 Chapter 3 Data andSignals Copyright © The McGraw-Hill Companies, Inc. Permission required for reproduction or display.
  • 2.
    3.2 To be transmitted,data must be transformed to electromagnetic signals. Note
  • 3.
    3.3 3-1 ANALOG ANDDIGITAL 3-1 ANALOG AND DIGITAL Data can be Data can be analog analog or or digital digital. The term . The term analog data analog data refers refers to information that is continuous; to information that is continuous; digital data digital data refers to refers to information that has discrete states. Analog data take on information that has discrete states. Analog data take on continuous values. Digital data take on discrete values. continuous values. Digital data take on discrete values.  Analog and Digital Data  Analog and Digital Signals  Periodic and Nonperiodic Signals Topics discussed in this section: Topics discussed in this section:
  • 4.
    3.4 Analog and DigitalData  Data can be analog or digital.  Analog data are continuous and take continuous values.  Digital data have discrete states and take discrete values.
  • 5.
    3.5 Analog and DigitalSignals • Signals can be analog or digital. • Analog signals can have an infinite number of values in a range. • Digital signals can have only a limited number of values.
  • 6.
    3.6 Figure 3.1 Comparisonof analog and digital signals
  • 7.
    3.7 3-1-3 PERIODIC andNONPERIODIC 3-1-3 PERIODIC and NONPERIODIC Both analog and digital signals can take one of two forms: periodic or nonperiodic (sometimes referred to as aperiodic; the prefix a in Greek means “non”). •A periodic signal completes a pattern within a measurable time frame, called a period, and repeats that pattern over subsequent identical periods. •The completion of one full pattern is called a cycle. •A nonperiodic signal changes without exhibiting a pattern or cycle that repeats over time. Both analog and digital signals can be periodic or nonperiodic. In data communications, we commonly use periodic analog signals and nonperiodic digital signals
  • 8.
    3.8 3-2 PERIODIC ANALOGSIGNALS 3-2 PERIODIC ANALOG SIGNALS In data communications, we commonly use periodic analog signals and nonperiodic digital signals. Periodic analog signals can be classified as Periodic analog signals can be classified as simple simple or or composite composite. A simple periodic analog signal, a . A simple periodic analog signal, a sine wave sine wave, , cannot be decomposed into simpler signals. A composite cannot be decomposed into simpler signals. A composite periodic analog signal is composed of multiple sine periodic analog signal is composed of multiple sine waves. waves.  Sine Wave  Wavelength  Time and Frequency Domain  Composite Signals  Bandwidth Topics discussed in this section: Topics discussed in this section:
  • 9.
  • 10.
    3.10 Figure 3.3 Twosignals with the same phase and frequency, but different amplitudes
  • 11.
    3.11 Frequency and periodare the inverse of each other. Note
  • 12.
    3.12 Figure 3.4 Twosignals with the same amplitude and phase, but different frequencies
  • 13.
    3.13 Table 3.1 Unitsof period and frequency
  • 14.
    3.14 The power weuse at home has a frequency of 60 Hz. The period of this sine wave can be determined as follows: Example 3.1
  • 15.
    3.15 The period ofa signal is 100 ms. What is its frequency in kilohertz? Example 3.2 Solution First we change 100 ms to seconds, and then we calculate the frequency from the period (1 Hz = 10−3 kHz).
  • 16.
    3.16 Frequency • Frequency isthe rate of change with respect to time. • Change in a short span of time means high frequency. • Change over a long span of time means low frequency.
  • 17.
    3.17 If a signaldoes not change at all, its frequency is zero. If a signal changes instantaneously, its frequency is infinite. Note
  • 18.
    3.18 Phase describes theposition of the waveform relative to time 0. Note
  • 19.
    3.19 Figure 3.5 Threesine waves with the same amplitude and frequency, but different phases
  • 20.
    3.20 A sine waveis offset 1/6 cycle with respect to time 0. What is its phase in degrees and radians? Example 3.3 Solution We know that 1 complete cycle is 360°. Therefore, 1/6 cycle is
  • 21.
  • 22.
    3.22 Figure 3.7 Thetime-domain and frequency-domain plots of a sine wave
  • 23.
    3.23 A complete sinewave in the time domain can be represented by one single spike in the frequency domain. Note
  • 24.
    3.24 The frequency domainis more compact and useful when we are dealing with more than one sine wave. For example, Figure 3.8 shows three sine waves, each with different amplitude and frequency. All can be represented by three spikes in the frequency domain. Example 3.7
  • 25.
    3.25 Figure 3.8 Thetime domain and frequency domain of three sine waves
  • 26.
    3.26 Signals and Communication A single-frequency sine wave is not useful in data communications  We need to send a composite signal, a signal made of many simple sine waves.  According to Fourier analysis, any composite signal is a combination of simple sine waves with different frequencies, amplitudes, and phases.
  • 27.
    3.27 Composite Signals and Periodicity If the composite signal is periodic, the decomposition gives a series of signals with discrete frequencies.  If the composite signal is nonperiodic, the decomposition gives a combination of sine waves with continuous frequencies.
  • 28.
    3.28 Figure 3.11 Thetime and frequency domains of a nonperiodic signal
  • 29.
    3.29 Bandwidth and Signal Frequency The bandwidth of a composite signal is the difference between the highest and the lowest frequencies contained in that signal.
  • 30.
    3.30 Figure 3.12 Thebandwidth of periodic and nonperiodic composite signals
  • 31.
    3.31 If a periodicsignal is decomposed into five sine waves with frequencies of 100, 300, 500, 700, and 900 Hz, what is its bandwidth? Draw the spectrum, assuming all components have a maximum amplitude of 10 V. Solution Let fh be the highest frequency, fl the lowest frequency, and B the bandwidth. Then Example 3.6 The spectrum has only five spikes, at 100, 300, 500, 700, and 900 Hz (see Figure 3.13).
  • 32.
    3.32 Figure 3.13 Thebandwidth for Example 3.6
  • 33.
    3.33 A periodic signalhas a bandwidth of 20 Hz. The highest frequency is 60 Hz. What is the lowest frequency? Draw the spectrum if the signal contains all frequencies of the same amplitude. Solution Let fh be the highest frequency, fl the lowest frequency, and B the bandwidth. Then Example 3.7 The spectrum contains all integer frequencies. We show this by a series of spikes (see Figure 3.14).
  • 34.
    3.34 Figure 3.14 Thebandwidth for Example 3.7
  • 35.
    3.35 Figure 3.15 Thebandwidth for Example 3.8