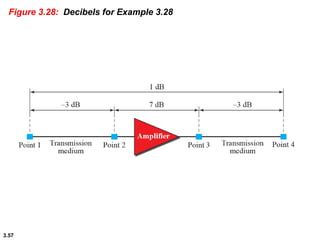
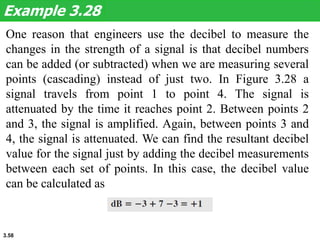
Chapter 3
Introduction
To
Physical
Layer
Copyright © The McGraw-Hill Companies, Inc. Permission required for reproduction or display.
Chapter 3: Outline
3.1 DATA AND SIGNALS
3.2 PERIODIC ANALOG SIGNALS
3.3 DIGITAL SIGNALS
3.4 TRANSMISSION IMPAIRMENT
3.5 DATA RATE LIMITS
3.6 PERFORMANCE
3.3
3.1.1 Analog and Digital Data
Data can be analog or digital. The term analog data
refers to information that is continuous; digital data
refers to information that has discrete states. For
example, an analog clock that has hour, minute, and
second hands gives information in a continuous
form; the movements of the hands are continuous.
On the other hand, a digital clock that reports the
hours and the minutes will change suddenly from
8:05 to 8:06.
3.4
3.1.2 Analog and Digital Signals
Like the data they represent, signals can be either
analog or digital. An analog signal has infinitely
many levels of intensity over a period of time. As the
wave moves from value A to value B, it passes
through and includes an infinite number of values
along its path. A digital signal, on the other hand,
can have only a limited number of defined values.
Although each value can be any number, it is often
as simple as 1 and 0.
3.5
Figure 3.2: Comparison of analog and digital signals
3.6
3.1.3 Periodic and Nonperiodic
A periodic signal completes a pattern within a
measurable time frame, called a period, and repeats
that pattern over subsequent identical periods. The
completion of one full pattern is called a cycle. A
nonperiodic signal changes without exhibiting a
pattern or cycle that repeats over time. Both analog
and digital signals.
3.7
3.2.1 Sine Wave
The sine wave is the most fundamental form of a
periodic analog signal. When we visualize it as a
simple oscillating curve, its change over the course
of a cycle is smooth and consistent, a continuous,
rolling flow. Figure 3.3 shows a sine wave. Each
cycle consists of a single arc above the time axis
followed by a single arc below it.
3.8
Figure 3.3: A sine wave
Time
Value
• • •
3.9
Figure 3.4: Two signals with two different amplitudes
Peak
amplitude
Peak
amplitude
Peak
amplitude
Peak
amplitude
3.10
Figure 3.5: Two signals with same phase, different amplitudes and
frequency
3.11
Table 3.1: Units of period and frequency
3.12
Express a period of 100 ms in microseconds.
Example 3.4
Solution
From Table 3.1 we find the equivalents of 1 ms (1 ms is 10–
3 s) and 1 s (1 s is 106 μs). We make the following
substitutions:
3.13
The power we use at home has a frequency of 60 Hz (50 Hz
in Europe). The period of this sine wave can be determined
as follows:
Example 3.3
This means that the period of the power for our lights at
home is 0.0116 s, or 16.6 ms. Our eyes are not sensitive
enough to distinguish these rapid changes in amplitude.
3.14
The period of a signal is 100 ms. What is its frequency in
kilohertz?.
Example 3.5
Solution
First we change 100 ms to seconds, and then we calculate
the frequency from the period (1 Hz = 10–3 kHz).
3.15
3.2.2 Phase
The term phase, or phase shift, describes the
position of the waveform relative to time 0. If we
think of the wave as something that can be shifted
backward or forward along the time axis, phase
describes the amount of that shift. It indicates the
status of the first cycle.
3.16
Figure 3.6: Three sine waves with different phases
3.17
A sine wave is offset 1/6 cycle with respect to time 0. What
is its phase in degrees and radians?
Example 3.6
Solution
We know that 1 complete cycle is 360°. Therefore, 1/6 cycle
is
3.18
3.2.3 Wavelength
Wavelength is another characteristic of a signal
traveling through a transmission medium.
Wavelength binds the period or the frequency of a
simple sine wave to the propagation speed of the
medium (see Figure 3.7).
3.19
Figure 3.7: Wavelength and period
Direction of
propagation
3.20
3.2.4 Time and Frequency Domains
A sine wave is comprehensively defined by its
amplitude, frequency, and phase. We have been
showing a sine wave by using what is called a time
domain plot. The time-domain plot shows changes
in signal amplitude with respect to time (it is an
amplitude-versus-time plot). Phase is not explicitly
shown on a time-domain plot.
3.21
Figure 3.8: The time and frequency-domain plots of a sine wave
3.22
The frequency domain is more compact and useful when we
are dealing with more than one sine wave. For example,
Figure 3.9 shows three sine waves, each with different
amplitude and frequency. All can be represented by three
spikes in the frequency domain.
Example 3.7
3.23
Figure 3.9: The time and frequency domain of three sine waves
3.24
3.2.5 Composite Signals
So far, we have focused on simple sine waves.
Simple sine waves have many applications in daily
life. We can send a single sine wave to carry electric
energy from one place to another. For example, the
power company sends a single sine wave with a
frequency of 60 Hz to distribute electric energy to
houses and businesses. As another example, we can
use a single sine wave to send an alarm to a security
center when a burglar opens a door or window in
the house. In the first case, the sine wave is carrying
energy; in the second, the sine wave is a signal of
danger.
3.25
Figure 3.10 shows a periodic composite signal with
frequency f. This type of signal is not typical of those found
in data communications. We can consider it to be three
alarm systems, each with a different frequency. The analysis
of this signal can give us a good understanding of how to
decompose signals. It is very difficult to manually
decompose this signal into a series of simple sine waves.
However, there are tools, both hardware and software, that
can help us do the job. We are not concerned
about how it is done; we are only interested in the result.
Figure 3.11 shows the result of decomposing the above
signal in both the time and frequency domains.
Example 3.8
3.26
Figure 3.10: A composite periodic signal
3.27
Figure 3.11: Decomposition of a composite periodic signal
Time
Amplitude
• • •
Amplitude
f 3f 9f
b. Frequency-domain decomposition of the composite signal
Frequency
3.28
Figure 3.12 shows a nonperiodic composite signal. It can be
the signal created by a microphone or a telephone set when a
word or two is pronounced. In this case, the composite
signal cannot be periodic, because that implies that we are
repeating the same word or words with exactly the
same tone.
Example 3.9
3.29
Figure 3.12: Time and frequency domain of a non-periodic signal
3.30
3.2.6 Bandwidth
The range of frequencies contained in a composite
signal is its bandwidth. The bandwidth is normally a
difference between two numbers. For example, if a
composite signal contains frequencies between 1000
and 5000, its bandwidth is 5000 − 1000, or 4000.
3.31
Figure 3.13: The bandwidth of periodic and nonperiodic composite
signals
3.32
If a periodic signal is decomposed into five sine waves with
frequencies of 100, 300, 500, 700, and 900 Hz, what is its
bandwidth? Draw the spectrum, assuming all components
have a maximum amplitude of 10 V.
Example 3.10
Solution
Let fh be the highest frequency, fl the lowest frequency, and
B the bandwidth. Then
3.33
Figure 3.14: The bandwidth for example 3.10
3.34
A periodic signal has a bandwidth of 20 Hz. The highest
frequency is 60 Hz. What is the lowest frequency? Draw the
spectrum if the signal contains all frequencies of the same
amplitude.
Example 3.11
Solution
Let fh be the highest frequency, fl the lowest frequency, and
B the bandwidth. Then
The spectrum contains all integer frequencies. We show this
by a series of spikes (see Figure 3.15).
3.35
Figure 3.15: The bandwidth for example 3.11
3.36
A nonperiodic composite signal has a bandwidth of 200
kHz, with a middle frequency of 140 kHz and peak
amplitude of 20 V. The two extreme frequencies have an
amplitude of 0. Draw the frequency domain of the signal.
Example 3.12
Solution
The lowest frequency must be at 40 kHz and the highest at
240 kHz. Figure 3.16 shows the frequency domain and the
bandwidth.
3.37
Figure 3.16: The bandwidth for example 3.12
3.38
Another example of a nonperiodic composite signal is the
signal received by an old-fashioned analog black-and-white
TV. A TV screen is made up of pixels (picture elements)
with each pixel being either white or black. The screen is
scanned 30 times per second. If we assume a resolution of
525 × 700 (525 vertical lines and 700 horizontal lines),
which is a ratio of 3:4, we have 367,500 pixels per screen. If
we scan the screen 30 times per second, this is 367,500 × 30
= 11,025,000 pixels per second. The worst-case scenario is
alternating black and white pixels. In this case, we need to
represent one color by the minimum amplitude and the other
color by the maximum amplitude. We can send 2 pixels per
cycle.
Example 3.15
3.39
Therefore, we need 11,025,000 / 2 = 5,512,500 cycles per
second, or Hz. The bandwidth needed is 5.5124 MHz. This
worst-case scenario has such a low probability of occurrence
that the assumption is that we need only 70 percent of this
bandwidth, which is 3.85 MHz. Since audio and
synchronization signals are also needed, a 4-MHz
bandwidth has been set aside for each black and white TV
channel. An analog color TV channel has a 6-MHz
bandwidth.
Example 3.15 (continued)
3.40
3-3 DIGITAL SIGNALS
In addition to being represented by an
analog signal, information can also be
represented by a digital signal. For example,
a 1 can be encoded as a positive voltage
and a 0 as zero voltage. A digital signal can
have more than two levels. In this case, we
can send more than 1 bit for each level.
Figure 3.17 shows two signals, one with two
levels
and the other with four.
3.41
Figure 3.17: Two digital signals: one with two signal levels and the
other with four signal levels
3.42
A digital signal has eight levels. How many bits are needed
per level? We calculate the number of bits from the
following formula. Each signal level is represented by 3 bits.
Example 3.16
3.43
A digital signal has nine levels. How many bits are needed
per level? We calculate the number of bits by using the
formula. Each signal level is represented by 3.17 bits.
However, this answer is not realistic. The number of bits
sent per level needs to be an integer as well as a power of 2.
For this example, 4 bits can represent one level.
Example 3.17
3.44
3.3.1 Bit Rate
Most digital signals are nonperiodic, and thus period
and frequency are not appropriate characteristics.
Another term—bit rate (instead of frequency)—is
used to describe digital signals. The bit rate is the
number of bits sent in 1s, expressed in bits per
second (bps). Figure 3.17 shows the bit rate for two
signals.
3.45
Assume we need to download text documents at the rate of
100 pages per second. What is the required bit rate of the
channel?
Example 3.18
Solution
From Table 3.1 we find the equivalents of 1 ms (1 ms is 10–
3 s) and 1 s (1 s is 106 μs). We make the following
substitutions:
3.46
A digitized voice channel, as we will see in Chapter 4, is
made by digitizing a 4-kHz bandwidth analog voice signal.
We need to sample the signal at twice the highest frequency
(two samples per hertz). We assume that each sample
requires 8 bits. What is the required bit rate?
Example 3.19
Solution
A page is an average of 24 lines with 80 characters in each
line. If we assume that one character requires 8 bits, the bit
rate is
3.47
What is the bit rate for high-definition TV (HDTV)?
Example 3.20
Solution
HDTV uses digital signals to broadcast high quality video
signals. The HDTV screen is normally a ratio of 16 : 9 (in
contrast to 4 : 3 for regular TV), which means the screen is
wider. There are 1920 by 1080 pixels per screen, and the
screen is renewed 30 times per second. Twenty-four bits
represents one color pixel. We can calculate the bit rate as
The TV stations reduce this rate to 20 to 40 Mbps through
compression.
3.48
•A digital signal is a composite analog
signal with an infinite bandwidth.
•Limited by the bandwidth of the medium
3.51
3-4 TRANSMISSION IMPAIRMENT
Signals travel through transmission
media, which are not perfect. The
imperfection causes signal impairment.
This means that the signal at the
beginning of the medium is not the same
as the signal at the end of the medium.
What is sent is not what is received.
Three causes of impairment are
attenuation, distortion, and noise (see
Figure 3.26).
3.52
Figure 3.26: Causes of impairment
3.53
3.4.1 Attenuation
Attenuation means a loss of energy. When a signal,
simple or composite, travels through a medium, it
loses some of its energy in overcoming the resistance
of the medium. That is why a wire carrying electric
signals gets warm, if not hot, after a while. Some of
the electrical energy in the signal is converted to
heat. To compensate for this loss, amplifiers are
used to amplify the signal. Figure 3.27 shows the
effect of attenuation and amplification..
3.54
Figure 3.27: Attenuation and amplification
3.55
Suppose a signal travels through a transmission medium and
its power is reduced to one half. This means that P2 = 0.5
P1. In this case, the attenuation (loss of power) can be
calculated as
Example 3.26
A loss of 3 dB (−3 dB) is equivalent to losing one-half the
power.
3.56
A signal travels through an amplifier, and its power is
increased 10 times. This means that P2 = 10P1. In this case,
the amplification (gain of power) can be calculated as
Example 3.27
3.57
Figure 3.28: Decibels for Example 3.28
3.58
One reason that engineers use the decibel to measure the
changes in the strength of a signal is that decibel numbers
can be added (or subtracted) when we are measuring several
points (cascading) instead of just two. In Figure 3.28 a
signal travels from point 1 to point 4. The signal is
attenuated by the time it reaches point 2. Between points 2
and 3, the signal is amplified. Again, between points 3 and
4, the signal is attenuated. We can find the resultant decibel
value for the signal just by adding the decibel measurements
between each set of points. In this case, the decibel value
can be calculated as
Example 3.28
3.59
Sometimes the decibel is used to measure signal power in
milliwatts. In this case, it is referred to as dBm and is
calculated as dBm = 10 log10 Pm, where Pm is the power in
milliwatts. Calculate the power of a signal if its dBm = −30.
Example 3.29
Solution
We can calculate the power in the signal as
3.60
The loss in a cable is usually defined in decibels per
kilometer (dB/km). If the signal at the beginning of a cable
with −0.3 dB/km has a power of 2 mW, what is the power of
the signal at 5 km?
Example 3.30
Solution
The loss in the cable in decibels is 5 × (−0.3) = −1.5 dB. We
can calculate the power as
3.61
3.4.2 Distortion
Distortion means that the signal changes its form or
shape. Distortion can occur in a composite signal
made of different frequencies. Each signal
component has its own propagation speed (see the
next section) through a medium and, therefore, its
own delay in arriving at the final destination.
Differences in delay may create a difference in
phase if the delay is not exactly the same as the
period duration.
3.62
Figure 3.29: Distortion
3.63
3.4.3 Noise
Noise is another cause of impairment. Several types
of noise, such as thermal noise, induced noise,
crosstalk, and impulse noise, may corrupt the signal.
Thermal noise is the random motion of electrons in
a wire, which creates an extra signal not originally
sent by the transmitter. Induced noise comes from
sources such as motors. Crosstalk is the effect of one
wire on the other.
3.64
Figure 3.30: Noise
3.65
Figure 3.31: Two cases of SNR: a high SNR and a low SNR
3.66
The power of a signal is 10 mW and the power of the noise
is 1 μW; what are the values of SNR and SNRdB?
Example 3.31
Solution
The values of SNR and SNRdB can be calculated as follows:
3.67
The values of SNR and SNRdB for a noiseless channel are
Example 3.32
Solution
The values of SNR and SNRdB for a noiseless channel are
We can never achieve this ratio in real life; it is an ideal.
3.68
3-5 DATA RATE LIMITS
A very important consideration in data
communications is how fast we can send
data, in bits per second, over a channel.
Two theoretical formulas were developed
to calculate the data rate: one by Nyquist
for a noiseless channel, another by
Shannon for a noisy channel.
3.69
3.5.1 Noiseless Channel: Nyquist Rate
For a noiseless channel, the Nyquist bit rate formula
defines the theoretical maximum bit rate.
3.70
Does the Nyquist theorem bit rate agree with the intuitive bit
rate described in baseband transmission?
Example 3.33
Solution
They match when we have only two levels. We said, in
baseband transmission, the bit rate is 2 times the bandwidth
if we use only the first harmonic in the worst case. However,
the Nyquist formula is more general than what we derived
intuitively; it can be applied to baseband transmission and
modulation. Also, it can be applied when we have two or
more levels of signals.
3.71
Consider a noiseless channel with a bandwidth of 3000 Hz
transmitting a signal with two signal levels. The maximum
bit rate can be calculated as
Example 3.34
3.72
Consider the same noiseless channel transmitting a signal
with four signal levels (for each level, we send 2 bits). The
maximum bit rate can be calculated as
Example 3.35
3.73
We need to send 265 kbps over a noiseless channel with a
bandwidth of 20 kHz. How many signal levels do we need?
Example 3.36
Solution
We can use the Nyquist formula as shown:
Since this result is not a power of 2, we need to either
increase the number of levels or reduce the bit rate. If we
have 128 levels, the bit rate is 280 kbps. If we have 64
levels, the bit rate is 240 kbps.
3.74
3.5.2 Noisy Channel: Shannon Capacity
In reality, we cannot have a noiseless channel; the
channel is always noisy. In 1944, Claude Shannon
introduced a formula, called the Shannon capacity,
to determine the theoretical highest data rate for a
noisy channel:
3.75
Consider an extremely noisy channel in which the value of
the signal-to-noise ratio is almost zero. In other words, the
noise is so strong that the signal is faint. For this channel the
capacity C is calculated as
Example 3.37
This means that the capacity of this channel is zero
regardless of the bandwidth. In other
words, we cannot receive any data through this channel.
3.76
We can calculate the theoretical highest bit rate of a regular
telephone line. A telephone line normally has a bandwidth of
3000 Hz (300 to 3300 Hz) assigned for data
communications. The signal-to-noise ratio is usually 3162.
For this channel the capacity is calculated as
Example 3.38
This means that the highest bit rate for a telephone line is
34.860 kbps. If we want to send data faster than this, we can
either increase the bandwidth of the line or improve the
signal-to-noise ratio.
3.77
The signal-to-noise ratio is often given in decibels. Assume
that SNRdB = 36 and the channel bandwidth is 2 MHz. The
theoretical channel capacity can be calculated as
Example 3.39
3.78
When the SNR is very high, we can assume that SNR + 1 is
almost the same as SNR. In these cases, the theoretical
channel capacity can be simplified to C 5 B 3 SNRdB. For
example, we can calculate the theoretical capacity of the
previous example as
Example 3.40
3.79
3.5.3 Using Both Limits
In practice, we need to use both methods to find the
limits and signal levels. Let us show this with an
example.
3.80
We have a channel with a 1-MHz bandwidth. The SNR for
this channel is 63. What are the appropriate bit rate and
signal level?
Example 3.41
Solution
First, we use the Shannon formula to find the upper limit.
The Shannon formula gives us 6 Mbps, the upper limit. For
better performance we choose something lower, 4 Mbps.
Then we use the Nyquist formula to find the number of
signal levels.
3.81
3-6 PERFORMANCE
Up to now, we have discussed the tools
of transmitting data (signals) over a
network and how the data behave. One
important issue in networking is the
performance of the network—how good
is it? In this section, we introduce terms
that we need for future chapters.
3.82
3.6.1 Bandwidth
One characteristic that measures network
performance is bandwidth. However, the term can be
used in two different contexts with two different
measuring values: bandwidth in hertz and
bandwidth in bits per second..
3.83
The bandwidth of a subscriber line is 4 kHz for voice or
data. The bandwidth of this line for data transmission
can be up to 56,000 bps using a sophisticated modem to
change the digital signal to analog.
Example 3.42
3.84
If the telephone company improves the quality of the line
and increases the bandwidth to 8 kHz, we can send 112,000
bps by using the same technology as mentioned in Example
3.42.
Example 3.43
3.85
3.6.2 Throughput
The throughput is a measure of how fast we can
actually send data through a network. Although, at
first glance, bandwidth in bits per second and
throughput seem the same, they are different. A link
may have a bandwidth of B bps, but we can only
send T bps through this link with T always less than
B.
3.86
3.6.3 Throughput
The latency or delay defines how long it takes for an
entire message to completely arrive at the destination
from the time the first bit is sent out from the source.
We can say that latency is made of four components:
propagation time, transmission time, queuing time
and processing delay.
3.87
A network with bandwidth of 10 Mbps can pass only an
average of 12,000 frames per minute with each frame
carrying an average of 10,000 bits. What is the throughput
of this network?
Example 3.44
Solution
We can calculate the throughput as
The throughput is almost one-fifth of the bandwidth in this
case.
3.88
What is the propagation time if the distance between the two
points is 12,000 km? Assume the propagation speed to be
2.4 × 10⁸ m/s in cable.
Example 3.45
Solution
We can calculate the propagation time as
The example shows that a bit can go over the Atlantic Ocean
in only 50 ms if there is a direct cable between the source
and the destination.
3.89
What are the propagation time and the transmission time for
a 2.5-KB (kilobyte) message if the bandwidth of the
network is 1 Gbps? Assume that the distance between the
sender and the receiver is 12,000 km and that light travels at
2.4 × 10⁸ m/s.
Example 3.46
Solution
We can calculate the propagation and transmission time as
Note that in this case, because the message is short and the
bandwidth is high, the dominant factor is the propagation
time, not the transmission time.
3.90
What are the propagation time and the transmission time for
a 5-MB (megabyte) message (an image) if the bandwidth of
the network is 1 Mbps? Assume that the distance between
the sender and the receiver is 12,000 km and that light
travels at 2.4 × 10⁸ m/s.
Example 3.47
Solution
We can calculate the propagation and transmission times as
3.91
3.6.4 Bandwidth-Delay Product
Bandwidth and delay are two performance metrics
of a link. However, as we will see in this chapter and
future chapters, what is very important in data
communications is the product of the two, the
bandwidth-delay product. Let us elaborate on this
issue, using two hypothetical cases as examples.
3.92
Figure 3.32: Filling the links with bits for Case 1
3.93
Figure 3.33: Filling the pipe with bits for Case 2
3.94
We can think about the link between two points as a pipe.
The cross section of the pipe represents the bandwidth, and
the length of the pipe represents the delay. We can say the
volume of the pipe defines the bandwidth-delay product, as
shown in Figure 3.34.
Example 3.48
3.95
Figure 3.34: Concept of bandwidth-delay product

Ch03_5th.ppt

  • 1.
    Chapter 3 Introduction To Physical Layer Copyright ©The McGraw-Hill Companies, Inc. Permission required for reproduction or display.
  • 2.
    Chapter 3: Outline 3.1DATA AND SIGNALS 3.2 PERIODIC ANALOG SIGNALS 3.3 DIGITAL SIGNALS 3.4 TRANSMISSION IMPAIRMENT 3.5 DATA RATE LIMITS 3.6 PERFORMANCE
  • 3.
    3.3 3.1.1 Analog andDigital Data Data can be analog or digital. The term analog data refers to information that is continuous; digital data refers to information that has discrete states. For example, an analog clock that has hour, minute, and second hands gives information in a continuous form; the movements of the hands are continuous. On the other hand, a digital clock that reports the hours and the minutes will change suddenly from 8:05 to 8:06.
  • 4.
    3.4 3.1.2 Analog andDigital Signals Like the data they represent, signals can be either analog or digital. An analog signal has infinitely many levels of intensity over a period of time. As the wave moves from value A to value B, it passes through and includes an infinite number of values along its path. A digital signal, on the other hand, can have only a limited number of defined values. Although each value can be any number, it is often as simple as 1 and 0.
  • 5.
    3.5 Figure 3.2: Comparisonof analog and digital signals
  • 6.
    3.6 3.1.3 Periodic andNonperiodic A periodic signal completes a pattern within a measurable time frame, called a period, and repeats that pattern over subsequent identical periods. The completion of one full pattern is called a cycle. A nonperiodic signal changes without exhibiting a pattern or cycle that repeats over time. Both analog and digital signals.
  • 7.
    3.7 3.2.1 Sine Wave Thesine wave is the most fundamental form of a periodic analog signal. When we visualize it as a simple oscillating curve, its change over the course of a cycle is smooth and consistent, a continuous, rolling flow. Figure 3.3 shows a sine wave. Each cycle consists of a single arc above the time axis followed by a single arc below it.
  • 8.
    3.8 Figure 3.3: Asine wave Time Value • • •
  • 9.
    3.9 Figure 3.4: Twosignals with two different amplitudes Peak amplitude Peak amplitude Peak amplitude Peak amplitude
  • 10.
    3.10 Figure 3.5: Twosignals with same phase, different amplitudes and frequency
  • 11.
    3.11 Table 3.1: Unitsof period and frequency
  • 12.
    3.12 Express a periodof 100 ms in microseconds. Example 3.4 Solution From Table 3.1 we find the equivalents of 1 ms (1 ms is 10– 3 s) and 1 s (1 s is 106 μs). We make the following substitutions:
  • 13.
    3.13 The power weuse at home has a frequency of 60 Hz (50 Hz in Europe). The period of this sine wave can be determined as follows: Example 3.3 This means that the period of the power for our lights at home is 0.0116 s, or 16.6 ms. Our eyes are not sensitive enough to distinguish these rapid changes in amplitude.
  • 14.
    3.14 The period ofa signal is 100 ms. What is its frequency in kilohertz?. Example 3.5 Solution First we change 100 ms to seconds, and then we calculate the frequency from the period (1 Hz = 10–3 kHz).
  • 15.
    3.15 3.2.2 Phase The termphase, or phase shift, describes the position of the waveform relative to time 0. If we think of the wave as something that can be shifted backward or forward along the time axis, phase describes the amount of that shift. It indicates the status of the first cycle.
  • 16.
    3.16 Figure 3.6: Threesine waves with different phases
  • 17.
    3.17 A sine waveis offset 1/6 cycle with respect to time 0. What is its phase in degrees and radians? Example 3.6 Solution We know that 1 complete cycle is 360°. Therefore, 1/6 cycle is
  • 18.
    3.18 3.2.3 Wavelength Wavelength isanother characteristic of a signal traveling through a transmission medium. Wavelength binds the period or the frequency of a simple sine wave to the propagation speed of the medium (see Figure 3.7).
  • 19.
    3.19 Figure 3.7: Wavelengthand period Direction of propagation
  • 20.
    3.20 3.2.4 Time andFrequency Domains A sine wave is comprehensively defined by its amplitude, frequency, and phase. We have been showing a sine wave by using what is called a time domain plot. The time-domain plot shows changes in signal amplitude with respect to time (it is an amplitude-versus-time plot). Phase is not explicitly shown on a time-domain plot.
  • 21.
    3.21 Figure 3.8: Thetime and frequency-domain plots of a sine wave
  • 22.
    3.22 The frequency domainis more compact and useful when we are dealing with more than one sine wave. For example, Figure 3.9 shows three sine waves, each with different amplitude and frequency. All can be represented by three spikes in the frequency domain. Example 3.7
  • 23.
    3.23 Figure 3.9: Thetime and frequency domain of three sine waves
  • 24.
    3.24 3.2.5 Composite Signals Sofar, we have focused on simple sine waves. Simple sine waves have many applications in daily life. We can send a single sine wave to carry electric energy from one place to another. For example, the power company sends a single sine wave with a frequency of 60 Hz to distribute electric energy to houses and businesses. As another example, we can use a single sine wave to send an alarm to a security center when a burglar opens a door or window in the house. In the first case, the sine wave is carrying energy; in the second, the sine wave is a signal of danger.
  • 25.
    3.25 Figure 3.10 showsa periodic composite signal with frequency f. This type of signal is not typical of those found in data communications. We can consider it to be three alarm systems, each with a different frequency. The analysis of this signal can give us a good understanding of how to decompose signals. It is very difficult to manually decompose this signal into a series of simple sine waves. However, there are tools, both hardware and software, that can help us do the job. We are not concerned about how it is done; we are only interested in the result. Figure 3.11 shows the result of decomposing the above signal in both the time and frequency domains. Example 3.8
  • 26.
    3.26 Figure 3.10: Acomposite periodic signal
  • 27.
    3.27 Figure 3.11: Decompositionof a composite periodic signal Time Amplitude • • • Amplitude f 3f 9f b. Frequency-domain decomposition of the composite signal Frequency
  • 28.
    3.28 Figure 3.12 showsa nonperiodic composite signal. It can be the signal created by a microphone or a telephone set when a word or two is pronounced. In this case, the composite signal cannot be periodic, because that implies that we are repeating the same word or words with exactly the same tone. Example 3.9
  • 29.
    3.29 Figure 3.12: Timeand frequency domain of a non-periodic signal
  • 30.
    3.30 3.2.6 Bandwidth The rangeof frequencies contained in a composite signal is its bandwidth. The bandwidth is normally a difference between two numbers. For example, if a composite signal contains frequencies between 1000 and 5000, its bandwidth is 5000 − 1000, or 4000.
  • 31.
    3.31 Figure 3.13: Thebandwidth of periodic and nonperiodic composite signals
  • 32.
    3.32 If a periodicsignal is decomposed into five sine waves with frequencies of 100, 300, 500, 700, and 900 Hz, what is its bandwidth? Draw the spectrum, assuming all components have a maximum amplitude of 10 V. Example 3.10 Solution Let fh be the highest frequency, fl the lowest frequency, and B the bandwidth. Then
  • 33.
    3.33 Figure 3.14: Thebandwidth for example 3.10
  • 34.
    3.34 A periodic signalhas a bandwidth of 20 Hz. The highest frequency is 60 Hz. What is the lowest frequency? Draw the spectrum if the signal contains all frequencies of the same amplitude. Example 3.11 Solution Let fh be the highest frequency, fl the lowest frequency, and B the bandwidth. Then The spectrum contains all integer frequencies. We show this by a series of spikes (see Figure 3.15).
  • 35.
    3.35 Figure 3.15: Thebandwidth for example 3.11
  • 36.
    3.36 A nonperiodic compositesignal has a bandwidth of 200 kHz, with a middle frequency of 140 kHz and peak amplitude of 20 V. The two extreme frequencies have an amplitude of 0. Draw the frequency domain of the signal. Example 3.12 Solution The lowest frequency must be at 40 kHz and the highest at 240 kHz. Figure 3.16 shows the frequency domain and the bandwidth.
  • 37.
    3.37 Figure 3.16: Thebandwidth for example 3.12
  • 38.
    3.38 Another example ofa nonperiodic composite signal is the signal received by an old-fashioned analog black-and-white TV. A TV screen is made up of pixels (picture elements) with each pixel being either white or black. The screen is scanned 30 times per second. If we assume a resolution of 525 × 700 (525 vertical lines and 700 horizontal lines), which is a ratio of 3:4, we have 367,500 pixels per screen. If we scan the screen 30 times per second, this is 367,500 × 30 = 11,025,000 pixels per second. The worst-case scenario is alternating black and white pixels. In this case, we need to represent one color by the minimum amplitude and the other color by the maximum amplitude. We can send 2 pixels per cycle. Example 3.15
  • 39.
    3.39 Therefore, we need11,025,000 / 2 = 5,512,500 cycles per second, or Hz. The bandwidth needed is 5.5124 MHz. This worst-case scenario has such a low probability of occurrence that the assumption is that we need only 70 percent of this bandwidth, which is 3.85 MHz. Since audio and synchronization signals are also needed, a 4-MHz bandwidth has been set aside for each black and white TV channel. An analog color TV channel has a 6-MHz bandwidth. Example 3.15 (continued)
  • 40.
    3.40 3-3 DIGITAL SIGNALS Inaddition to being represented by an analog signal, information can also be represented by a digital signal. For example, a 1 can be encoded as a positive voltage and a 0 as zero voltage. A digital signal can have more than two levels. In this case, we can send more than 1 bit for each level. Figure 3.17 shows two signals, one with two levels and the other with four.
  • 41.
    3.41 Figure 3.17: Twodigital signals: one with two signal levels and the other with four signal levels
  • 42.
    3.42 A digital signalhas eight levels. How many bits are needed per level? We calculate the number of bits from the following formula. Each signal level is represented by 3 bits. Example 3.16
  • 43.
    3.43 A digital signalhas nine levels. How many bits are needed per level? We calculate the number of bits by using the formula. Each signal level is represented by 3.17 bits. However, this answer is not realistic. The number of bits sent per level needs to be an integer as well as a power of 2. For this example, 4 bits can represent one level. Example 3.17
  • 44.
    3.44 3.3.1 Bit Rate Mostdigital signals are nonperiodic, and thus period and frequency are not appropriate characteristics. Another term—bit rate (instead of frequency)—is used to describe digital signals. The bit rate is the number of bits sent in 1s, expressed in bits per second (bps). Figure 3.17 shows the bit rate for two signals.
  • 45.
    3.45 Assume we needto download text documents at the rate of 100 pages per second. What is the required bit rate of the channel? Example 3.18 Solution From Table 3.1 we find the equivalents of 1 ms (1 ms is 10– 3 s) and 1 s (1 s is 106 μs). We make the following substitutions:
  • 46.
    3.46 A digitized voicechannel, as we will see in Chapter 4, is made by digitizing a 4-kHz bandwidth analog voice signal. We need to sample the signal at twice the highest frequency (two samples per hertz). We assume that each sample requires 8 bits. What is the required bit rate? Example 3.19 Solution A page is an average of 24 lines with 80 characters in each line. If we assume that one character requires 8 bits, the bit rate is
  • 47.
    3.47 What is thebit rate for high-definition TV (HDTV)? Example 3.20 Solution HDTV uses digital signals to broadcast high quality video signals. The HDTV screen is normally a ratio of 16 : 9 (in contrast to 4 : 3 for regular TV), which means the screen is wider. There are 1920 by 1080 pixels per screen, and the screen is renewed 30 times per second. Twenty-four bits represents one color pixel. We can calculate the bit rate as The TV stations reduce this rate to 20 to 40 Mbps through compression.
  • 48.
    3.48 •A digital signalis a composite analog signal with an infinite bandwidth. •Limited by the bandwidth of the medium
  • 51.
    3.51 3-4 TRANSMISSION IMPAIRMENT Signalstravel through transmission media, which are not perfect. The imperfection causes signal impairment. This means that the signal at the beginning of the medium is not the same as the signal at the end of the medium. What is sent is not what is received. Three causes of impairment are attenuation, distortion, and noise (see Figure 3.26).
  • 52.
  • 53.
    3.53 3.4.1 Attenuation Attenuation meansa loss of energy. When a signal, simple or composite, travels through a medium, it loses some of its energy in overcoming the resistance of the medium. That is why a wire carrying electric signals gets warm, if not hot, after a while. Some of the electrical energy in the signal is converted to heat. To compensate for this loss, amplifiers are used to amplify the signal. Figure 3.27 shows the effect of attenuation and amplification..
  • 54.
  • 55.
    3.55 Suppose a signaltravels through a transmission medium and its power is reduced to one half. This means that P2 = 0.5 P1. In this case, the attenuation (loss of power) can be calculated as Example 3.26 A loss of 3 dB (−3 dB) is equivalent to losing one-half the power.
  • 56.
    3.56 A signal travelsthrough an amplifier, and its power is increased 10 times. This means that P2 = 10P1. In this case, the amplification (gain of power) can be calculated as Example 3.27
  • 57.
  • 58.
    3.58 One reason thatengineers use the decibel to measure the changes in the strength of a signal is that decibel numbers can be added (or subtracted) when we are measuring several points (cascading) instead of just two. In Figure 3.28 a signal travels from point 1 to point 4. The signal is attenuated by the time it reaches point 2. Between points 2 and 3, the signal is amplified. Again, between points 3 and 4, the signal is attenuated. We can find the resultant decibel value for the signal just by adding the decibel measurements between each set of points. In this case, the decibel value can be calculated as Example 3.28
  • 59.
    3.59 Sometimes the decibelis used to measure signal power in milliwatts. In this case, it is referred to as dBm and is calculated as dBm = 10 log10 Pm, where Pm is the power in milliwatts. Calculate the power of a signal if its dBm = −30. Example 3.29 Solution We can calculate the power in the signal as
  • 60.
    3.60 The loss ina cable is usually defined in decibels per kilometer (dB/km). If the signal at the beginning of a cable with −0.3 dB/km has a power of 2 mW, what is the power of the signal at 5 km? Example 3.30 Solution The loss in the cable in decibels is 5 × (−0.3) = −1.5 dB. We can calculate the power as
  • 61.
    3.61 3.4.2 Distortion Distortion meansthat the signal changes its form or shape. Distortion can occur in a composite signal made of different frequencies. Each signal component has its own propagation speed (see the next section) through a medium and, therefore, its own delay in arriving at the final destination. Differences in delay may create a difference in phase if the delay is not exactly the same as the period duration.
  • 62.
  • 63.
    3.63 3.4.3 Noise Noise isanother cause of impairment. Several types of noise, such as thermal noise, induced noise, crosstalk, and impulse noise, may corrupt the signal. Thermal noise is the random motion of electrons in a wire, which creates an extra signal not originally sent by the transmitter. Induced noise comes from sources such as motors. Crosstalk is the effect of one wire on the other.
  • 64.
  • 65.
    3.65 Figure 3.31: Twocases of SNR: a high SNR and a low SNR
  • 66.
    3.66 The power ofa signal is 10 mW and the power of the noise is 1 μW; what are the values of SNR and SNRdB? Example 3.31 Solution The values of SNR and SNRdB can be calculated as follows:
  • 67.
    3.67 The values ofSNR and SNRdB for a noiseless channel are Example 3.32 Solution The values of SNR and SNRdB for a noiseless channel are We can never achieve this ratio in real life; it is an ideal.
  • 68.
    3.68 3-5 DATA RATELIMITS A very important consideration in data communications is how fast we can send data, in bits per second, over a channel. Two theoretical formulas were developed to calculate the data rate: one by Nyquist for a noiseless channel, another by Shannon for a noisy channel.
  • 69.
    3.69 3.5.1 Noiseless Channel:Nyquist Rate For a noiseless channel, the Nyquist bit rate formula defines the theoretical maximum bit rate.
  • 70.
    3.70 Does the Nyquisttheorem bit rate agree with the intuitive bit rate described in baseband transmission? Example 3.33 Solution They match when we have only two levels. We said, in baseband transmission, the bit rate is 2 times the bandwidth if we use only the first harmonic in the worst case. However, the Nyquist formula is more general than what we derived intuitively; it can be applied to baseband transmission and modulation. Also, it can be applied when we have two or more levels of signals.
  • 71.
    3.71 Consider a noiselesschannel with a bandwidth of 3000 Hz transmitting a signal with two signal levels. The maximum bit rate can be calculated as Example 3.34
  • 72.
    3.72 Consider the samenoiseless channel transmitting a signal with four signal levels (for each level, we send 2 bits). The maximum bit rate can be calculated as Example 3.35
  • 73.
    3.73 We need tosend 265 kbps over a noiseless channel with a bandwidth of 20 kHz. How many signal levels do we need? Example 3.36 Solution We can use the Nyquist formula as shown: Since this result is not a power of 2, we need to either increase the number of levels or reduce the bit rate. If we have 128 levels, the bit rate is 280 kbps. If we have 64 levels, the bit rate is 240 kbps.
  • 74.
    3.74 3.5.2 Noisy Channel:Shannon Capacity In reality, we cannot have a noiseless channel; the channel is always noisy. In 1944, Claude Shannon introduced a formula, called the Shannon capacity, to determine the theoretical highest data rate for a noisy channel:
  • 75.
    3.75 Consider an extremelynoisy channel in which the value of the signal-to-noise ratio is almost zero. In other words, the noise is so strong that the signal is faint. For this channel the capacity C is calculated as Example 3.37 This means that the capacity of this channel is zero regardless of the bandwidth. In other words, we cannot receive any data through this channel.
  • 76.
    3.76 We can calculatethe theoretical highest bit rate of a regular telephone line. A telephone line normally has a bandwidth of 3000 Hz (300 to 3300 Hz) assigned for data communications. The signal-to-noise ratio is usually 3162. For this channel the capacity is calculated as Example 3.38 This means that the highest bit rate for a telephone line is 34.860 kbps. If we want to send data faster than this, we can either increase the bandwidth of the line or improve the signal-to-noise ratio.
  • 77.
    3.77 The signal-to-noise ratiois often given in decibels. Assume that SNRdB = 36 and the channel bandwidth is 2 MHz. The theoretical channel capacity can be calculated as Example 3.39
  • 78.
    3.78 When the SNRis very high, we can assume that SNR + 1 is almost the same as SNR. In these cases, the theoretical channel capacity can be simplified to C 5 B 3 SNRdB. For example, we can calculate the theoretical capacity of the previous example as Example 3.40
  • 79.
    3.79 3.5.3 Using BothLimits In practice, we need to use both methods to find the limits and signal levels. Let us show this with an example.
  • 80.
    3.80 We have achannel with a 1-MHz bandwidth. The SNR for this channel is 63. What are the appropriate bit rate and signal level? Example 3.41 Solution First, we use the Shannon formula to find the upper limit. The Shannon formula gives us 6 Mbps, the upper limit. For better performance we choose something lower, 4 Mbps. Then we use the Nyquist formula to find the number of signal levels.
  • 81.
    3.81 3-6 PERFORMANCE Up tonow, we have discussed the tools of transmitting data (signals) over a network and how the data behave. One important issue in networking is the performance of the network—how good is it? In this section, we introduce terms that we need for future chapters.
  • 82.
    3.82 3.6.1 Bandwidth One characteristicthat measures network performance is bandwidth. However, the term can be used in two different contexts with two different measuring values: bandwidth in hertz and bandwidth in bits per second..
  • 83.
    3.83 The bandwidth ofa subscriber line is 4 kHz for voice or data. The bandwidth of this line for data transmission can be up to 56,000 bps using a sophisticated modem to change the digital signal to analog. Example 3.42
  • 84.
    3.84 If the telephonecompany improves the quality of the line and increases the bandwidth to 8 kHz, we can send 112,000 bps by using the same technology as mentioned in Example 3.42. Example 3.43
  • 85.
    3.85 3.6.2 Throughput The throughputis a measure of how fast we can actually send data through a network. Although, at first glance, bandwidth in bits per second and throughput seem the same, they are different. A link may have a bandwidth of B bps, but we can only send T bps through this link with T always less than B.
  • 86.
    3.86 3.6.3 Throughput The latencyor delay defines how long it takes for an entire message to completely arrive at the destination from the time the first bit is sent out from the source. We can say that latency is made of four components: propagation time, transmission time, queuing time and processing delay.
  • 87.
    3.87 A network withbandwidth of 10 Mbps can pass only an average of 12,000 frames per minute with each frame carrying an average of 10,000 bits. What is the throughput of this network? Example 3.44 Solution We can calculate the throughput as The throughput is almost one-fifth of the bandwidth in this case.
  • 88.
    3.88 What is thepropagation time if the distance between the two points is 12,000 km? Assume the propagation speed to be 2.4 × 10⁸ m/s in cable. Example 3.45 Solution We can calculate the propagation time as The example shows that a bit can go over the Atlantic Ocean in only 50 ms if there is a direct cable between the source and the destination.
  • 89.
    3.89 What are thepropagation time and the transmission time for a 2.5-KB (kilobyte) message if the bandwidth of the network is 1 Gbps? Assume that the distance between the sender and the receiver is 12,000 km and that light travels at 2.4 × 10⁸ m/s. Example 3.46 Solution We can calculate the propagation and transmission time as Note that in this case, because the message is short and the bandwidth is high, the dominant factor is the propagation time, not the transmission time.
  • 90.
    3.90 What are thepropagation time and the transmission time for a 5-MB (megabyte) message (an image) if the bandwidth of the network is 1 Mbps? Assume that the distance between the sender and the receiver is 12,000 km and that light travels at 2.4 × 10⁸ m/s. Example 3.47 Solution We can calculate the propagation and transmission times as We can calculate the propagation and transmission times as
  • 91.
    3.91 3.6.4 Bandwidth-Delay Product Bandwidthand delay are two performance metrics of a link. However, as we will see in this chapter and future chapters, what is very important in data communications is the product of the two, the bandwidth-delay product. Let us elaborate on this issue, using two hypothetical cases as examples.
  • 92.
    3.92 Figure 3.32: Fillingthe links with bits for Case 1
  • 93.
    3.93 Figure 3.33: Fillingthe pipe with bits for Case 2
  • 94.
    3.94 We can thinkabout the link between two points as a pipe. The cross section of the pipe represents the bandwidth, and the length of the pipe represents the delay. We can say the volume of the pipe defines the bandwidth-delay product, as shown in Figure 3.34. Example 3.48
  • 95.
    3.95 Figure 3.34: Conceptof bandwidth-delay product