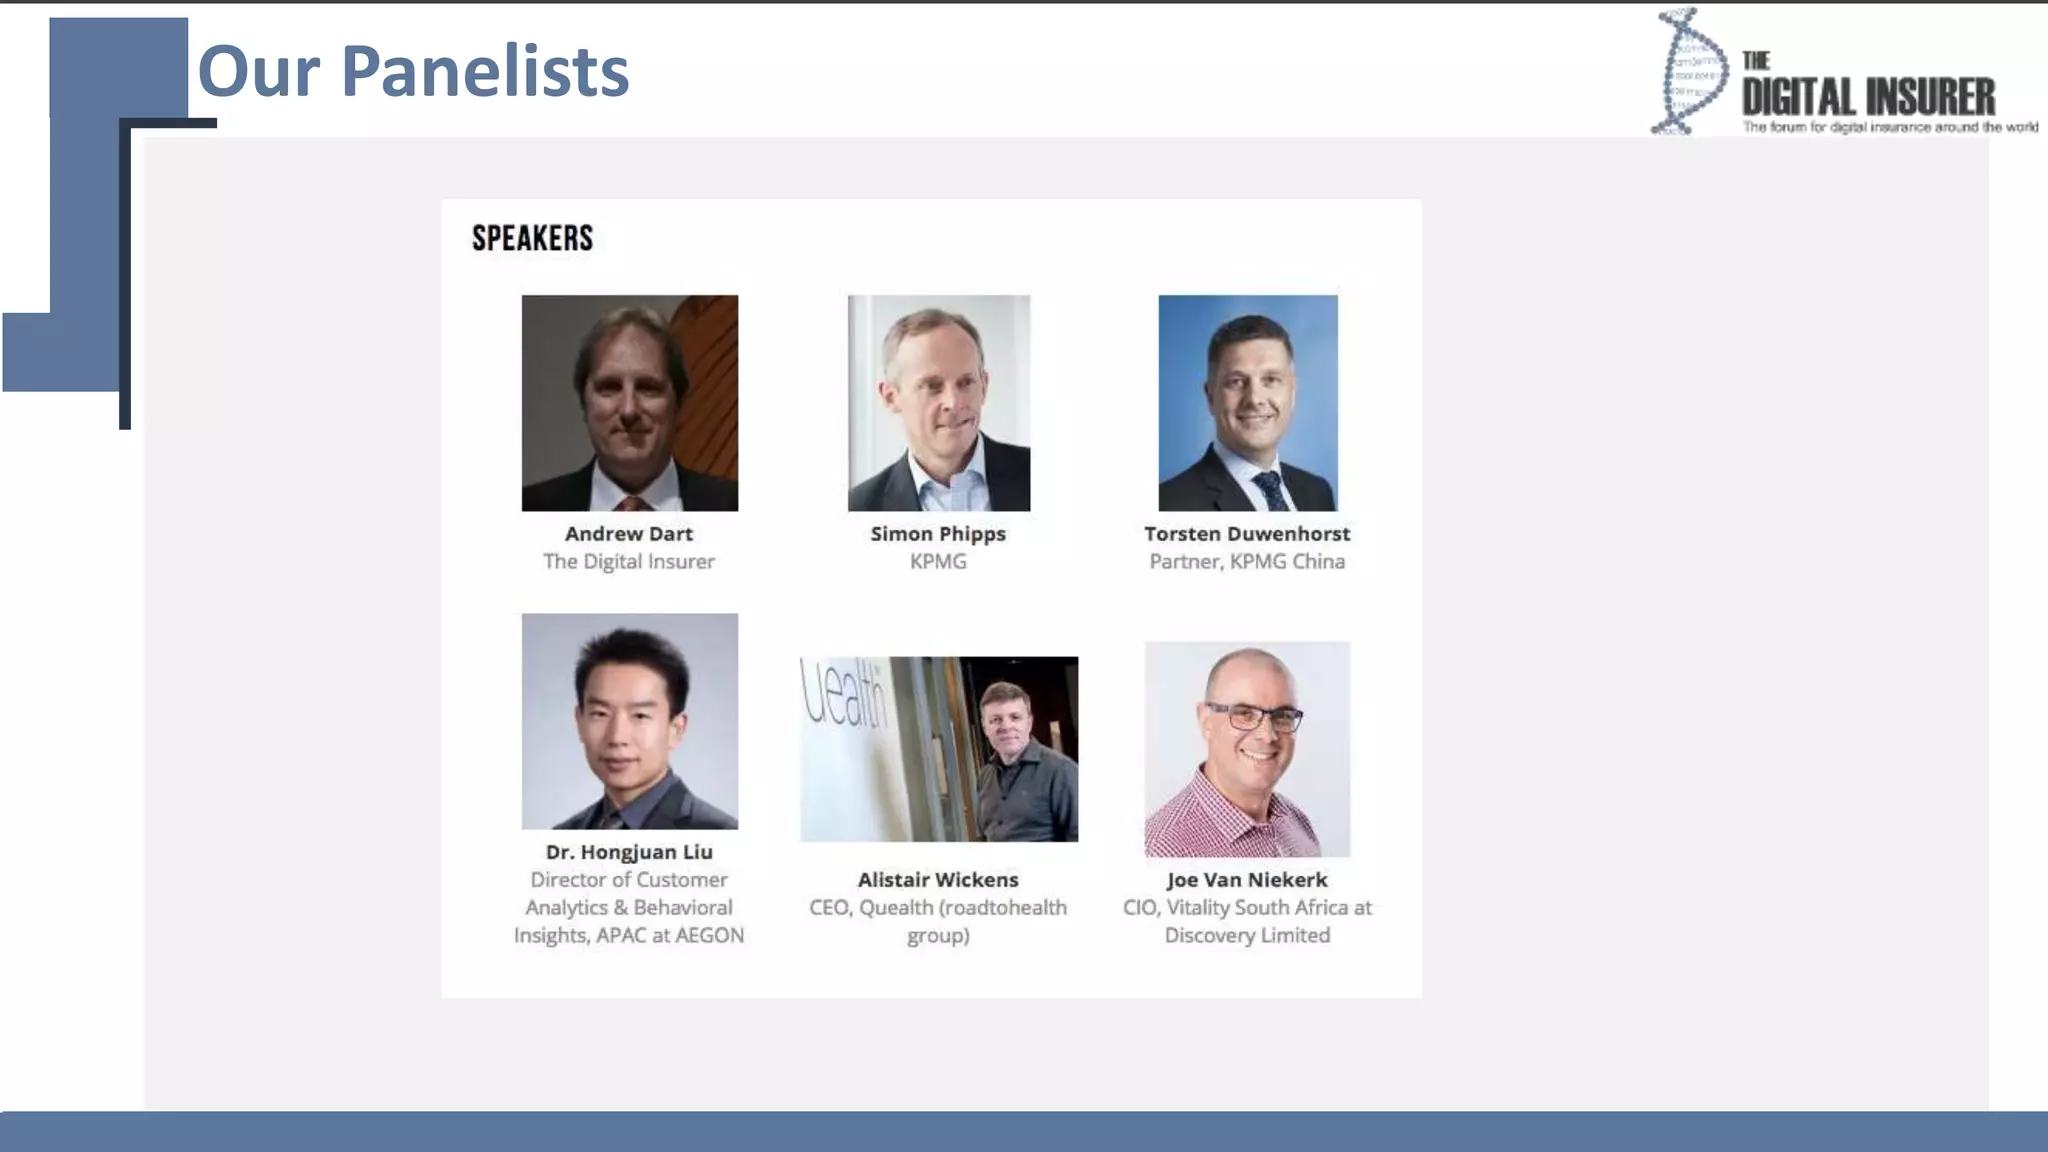
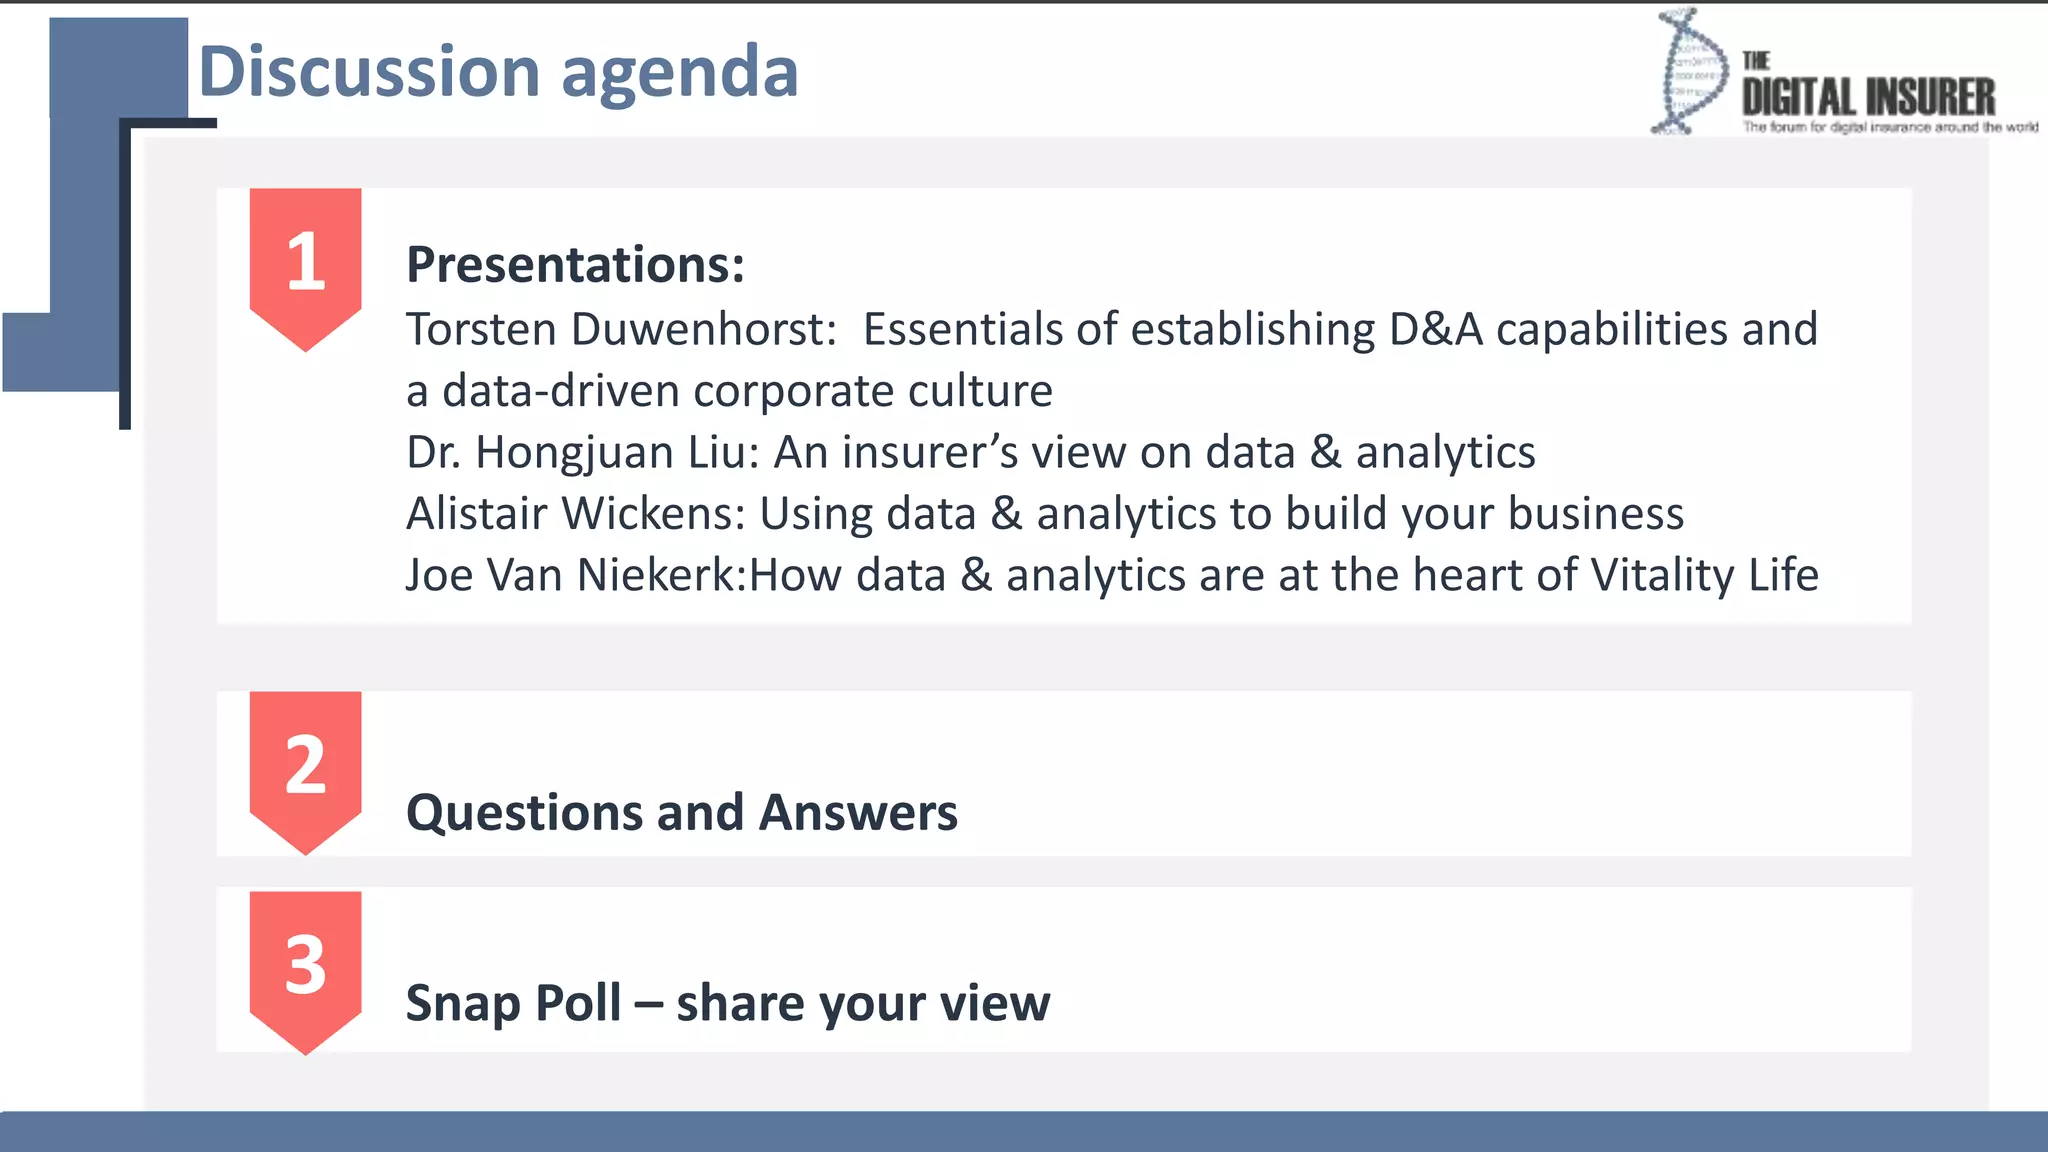
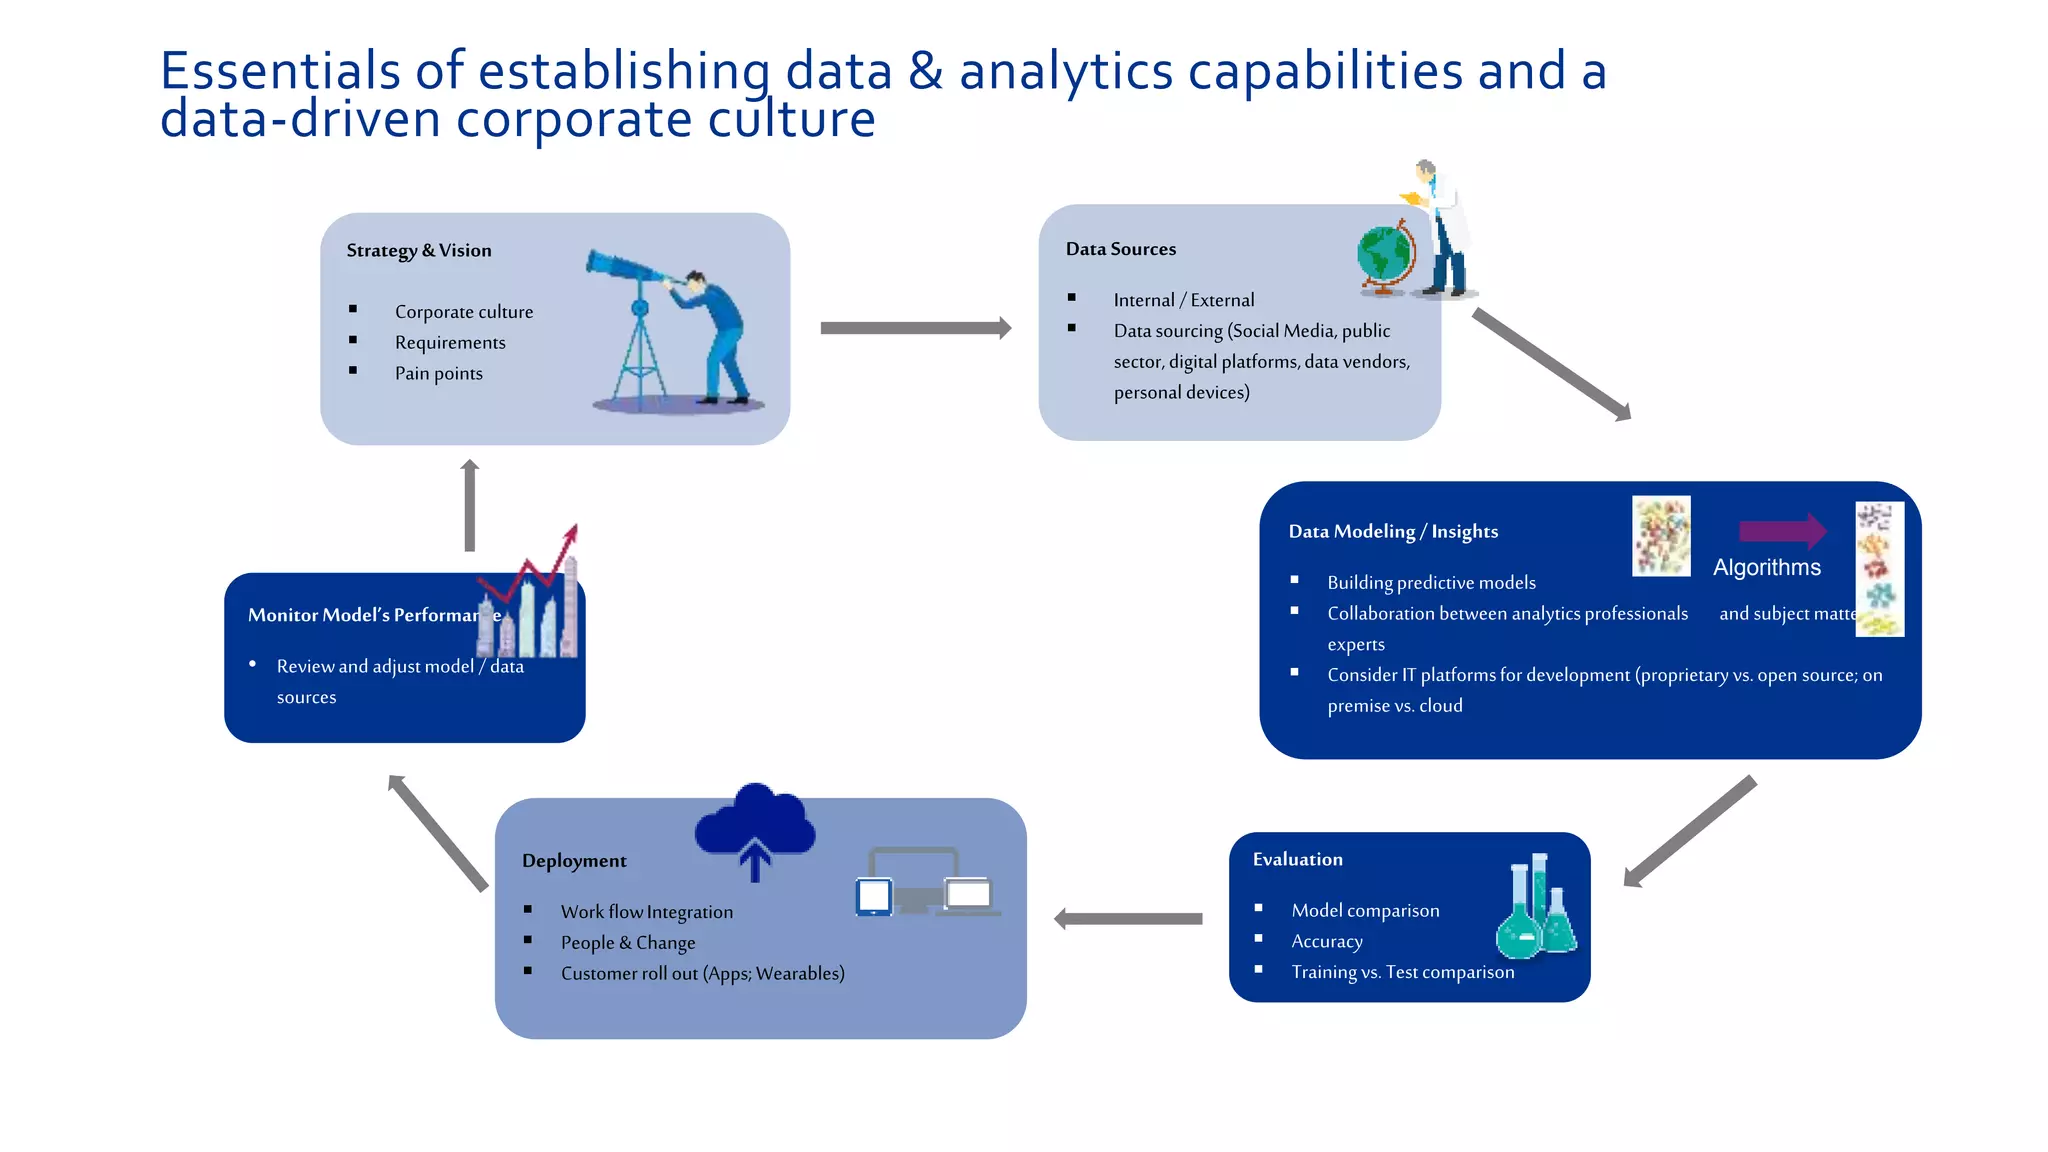
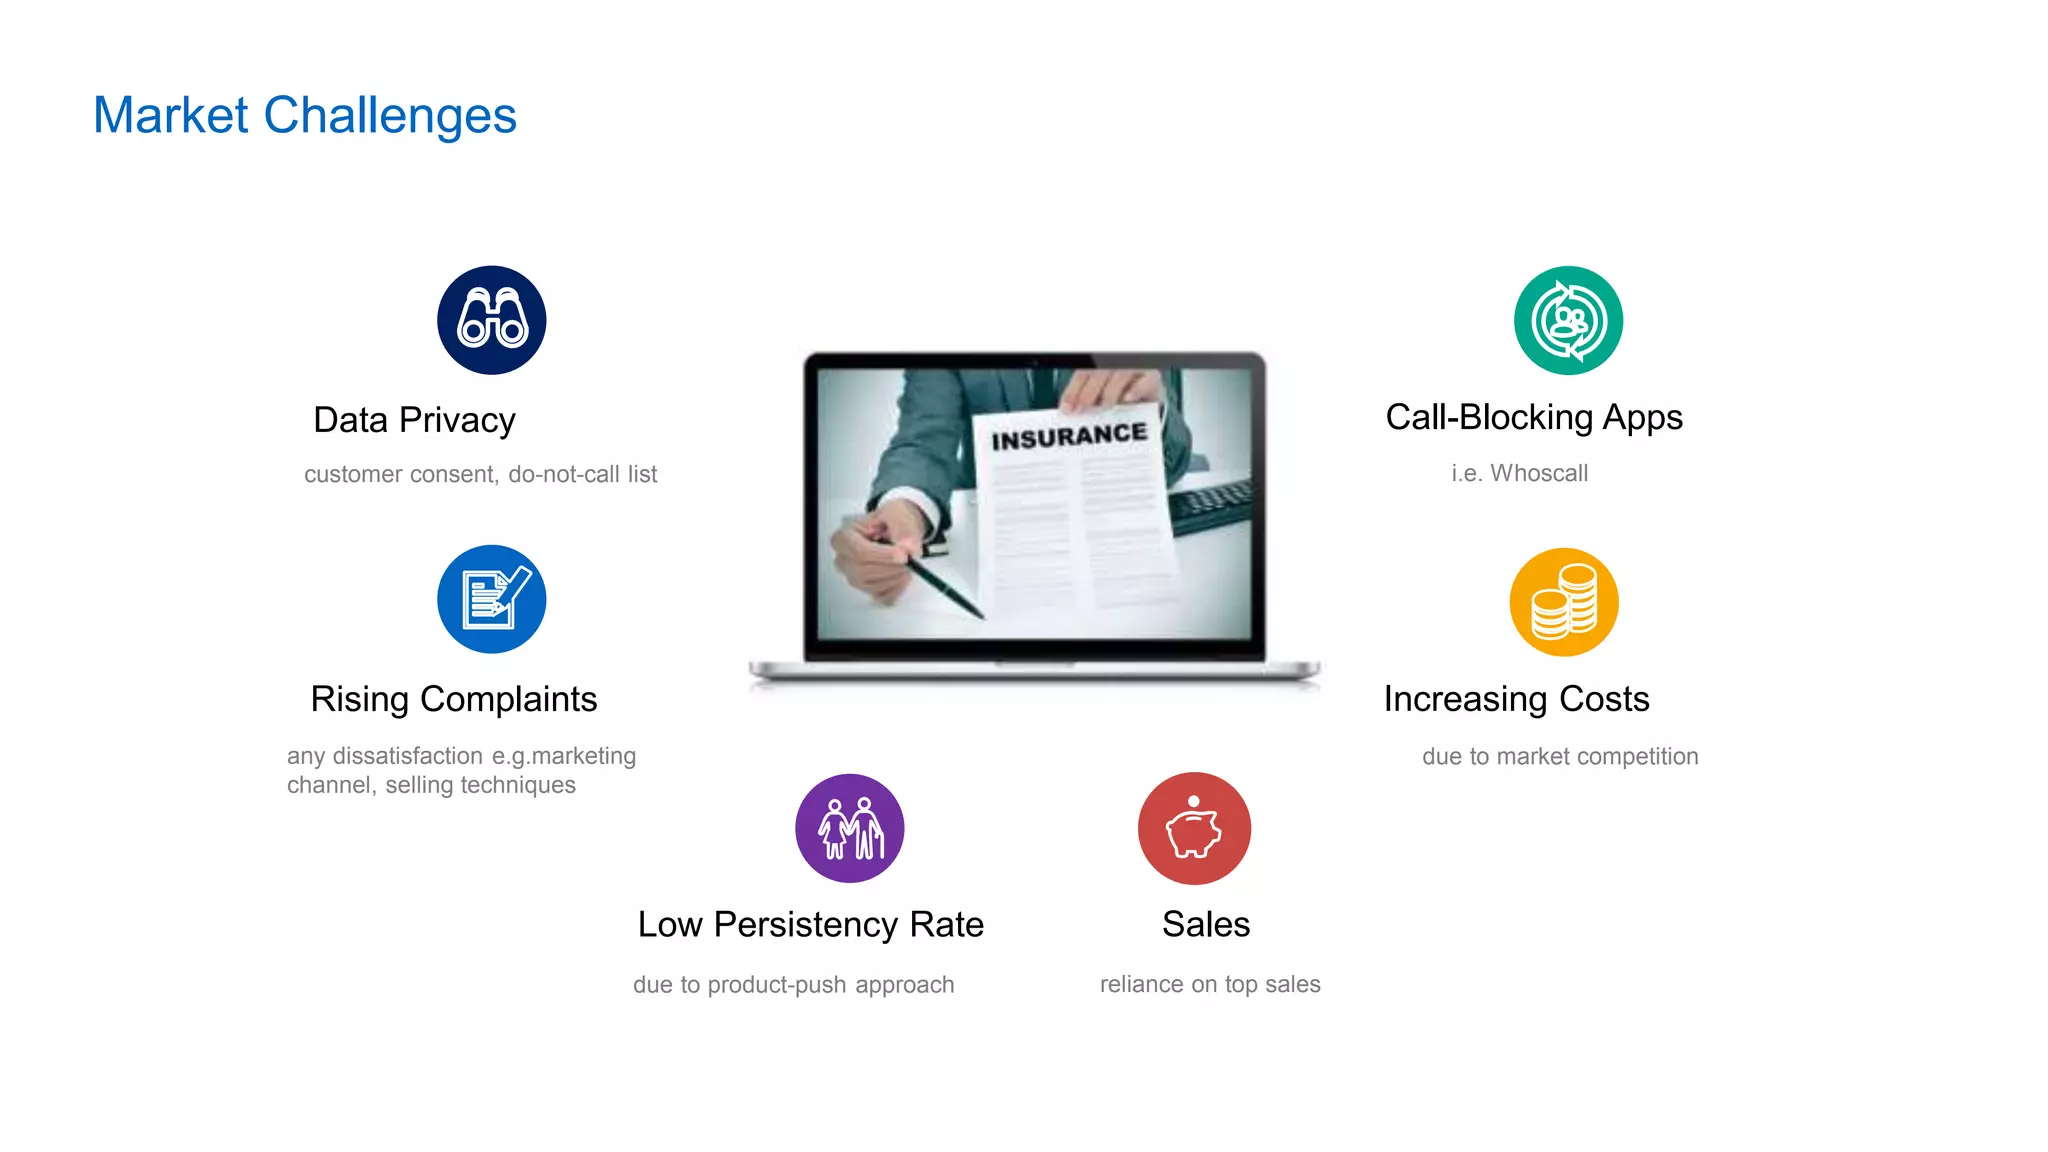
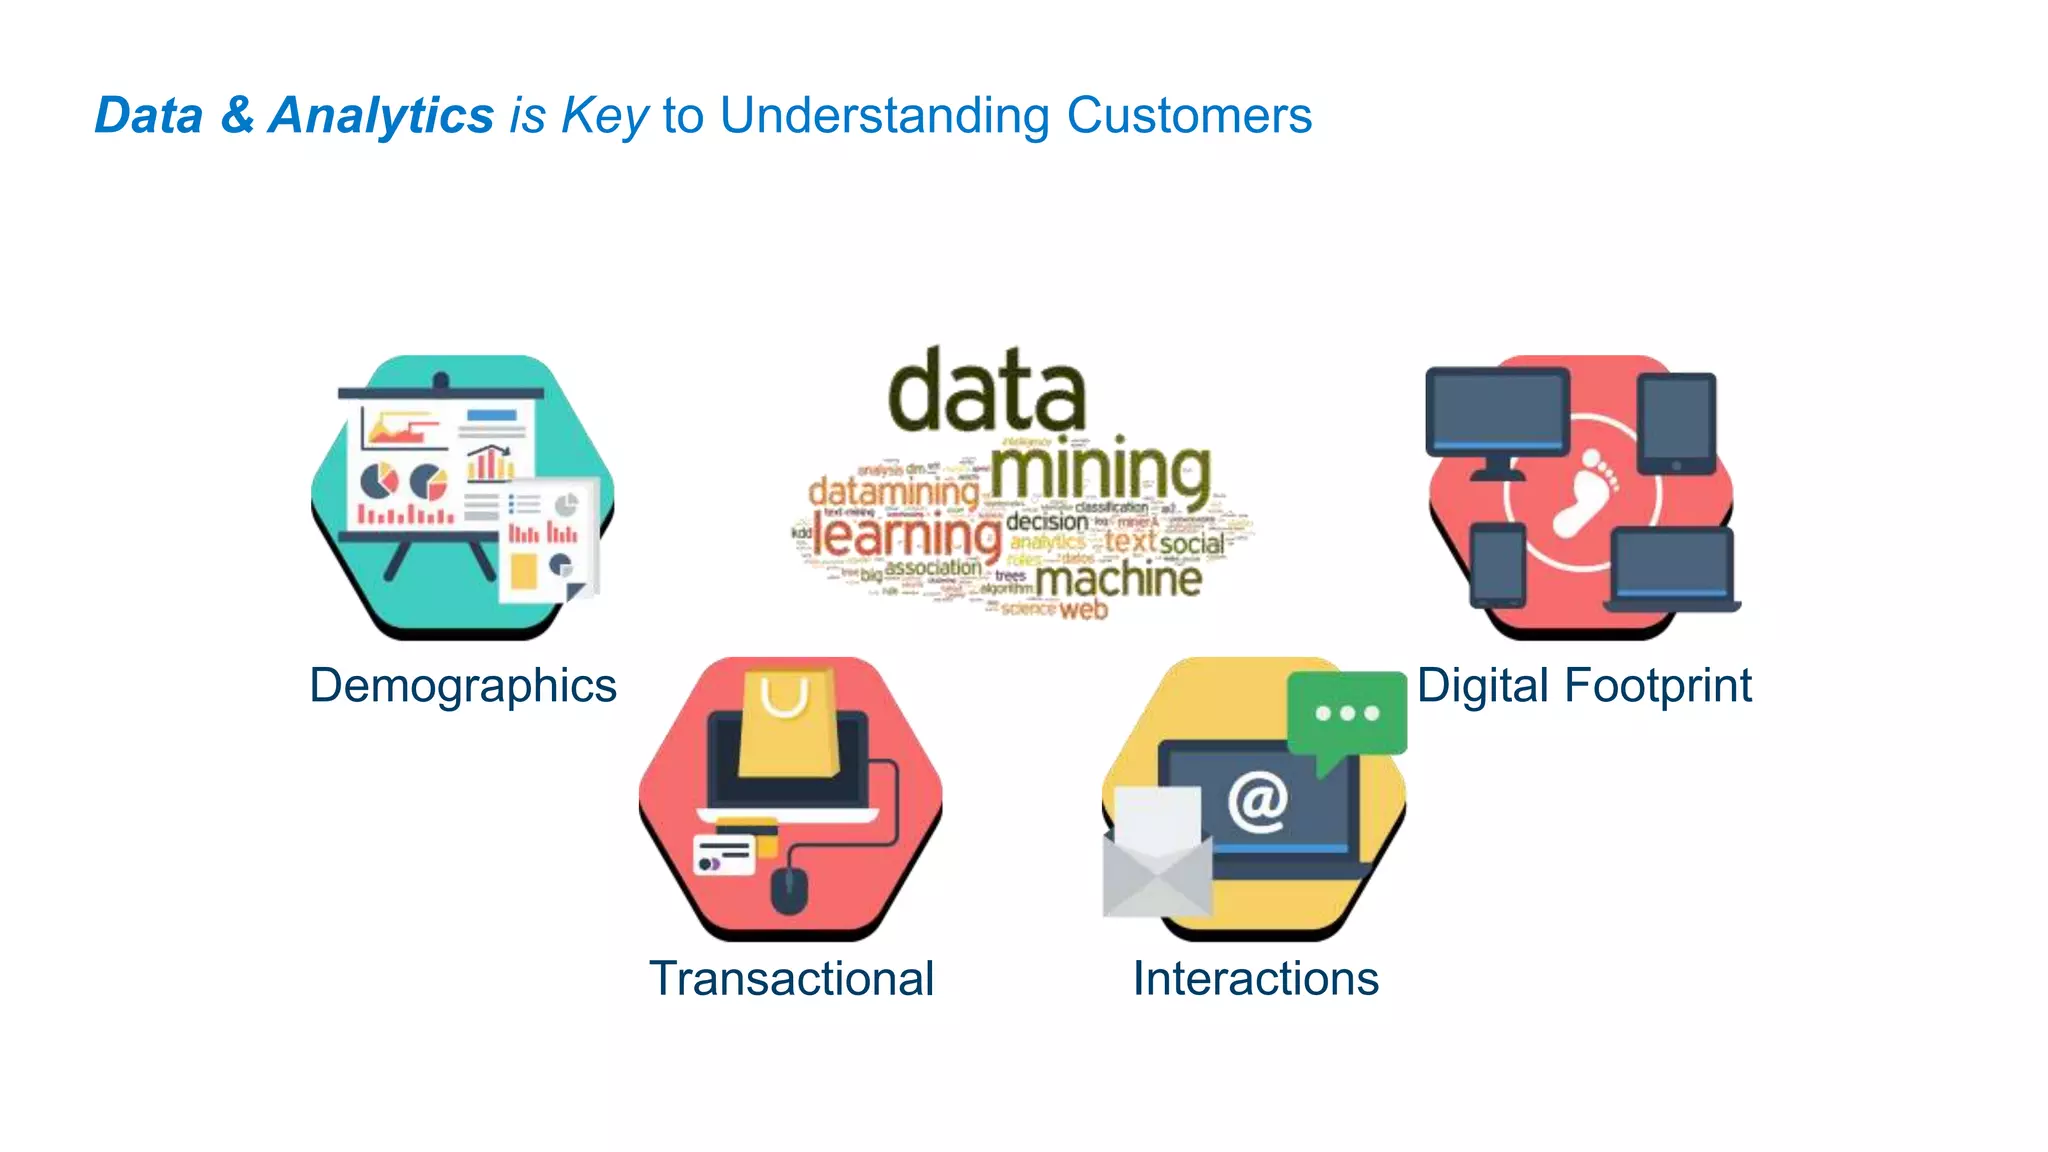
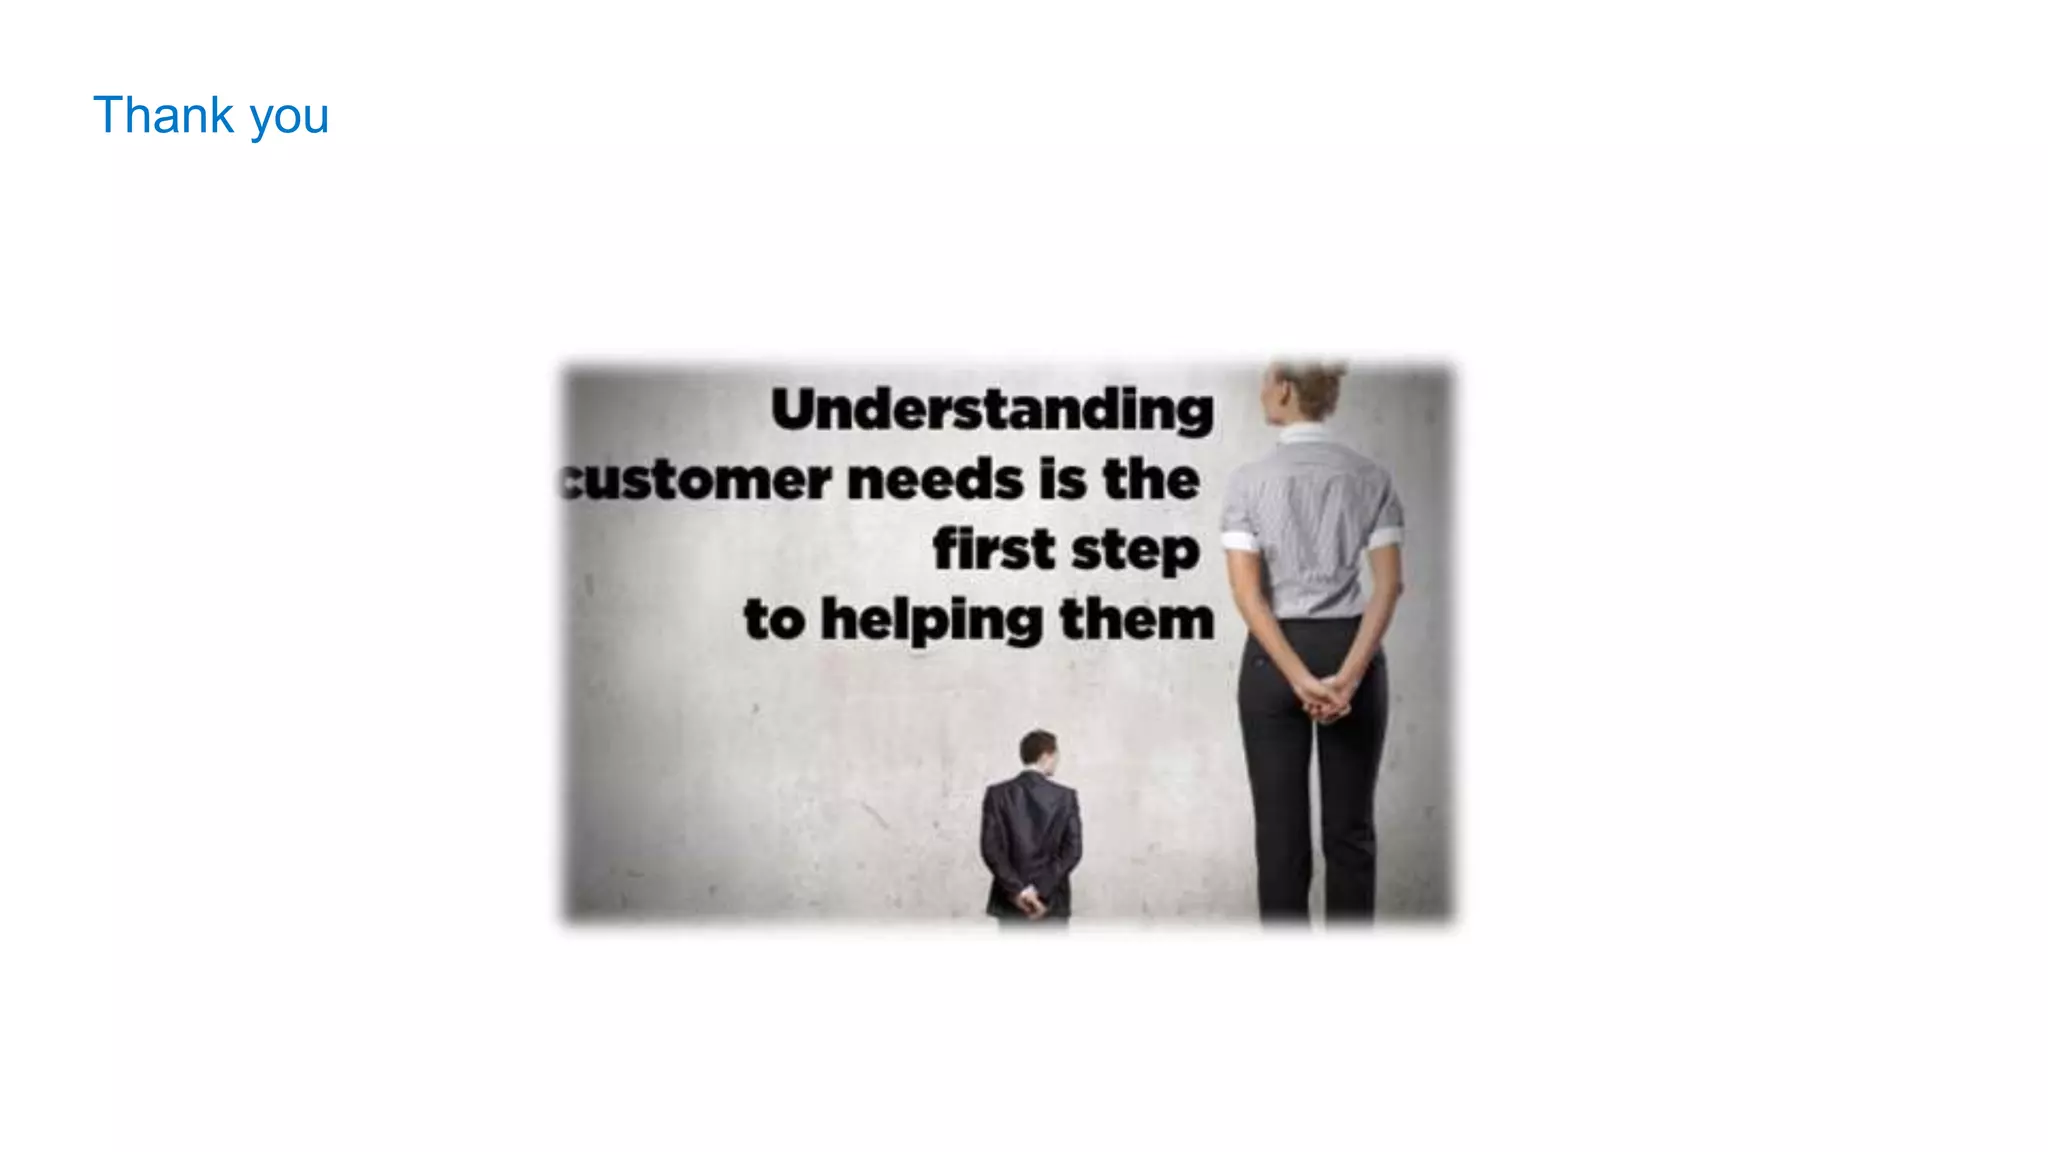
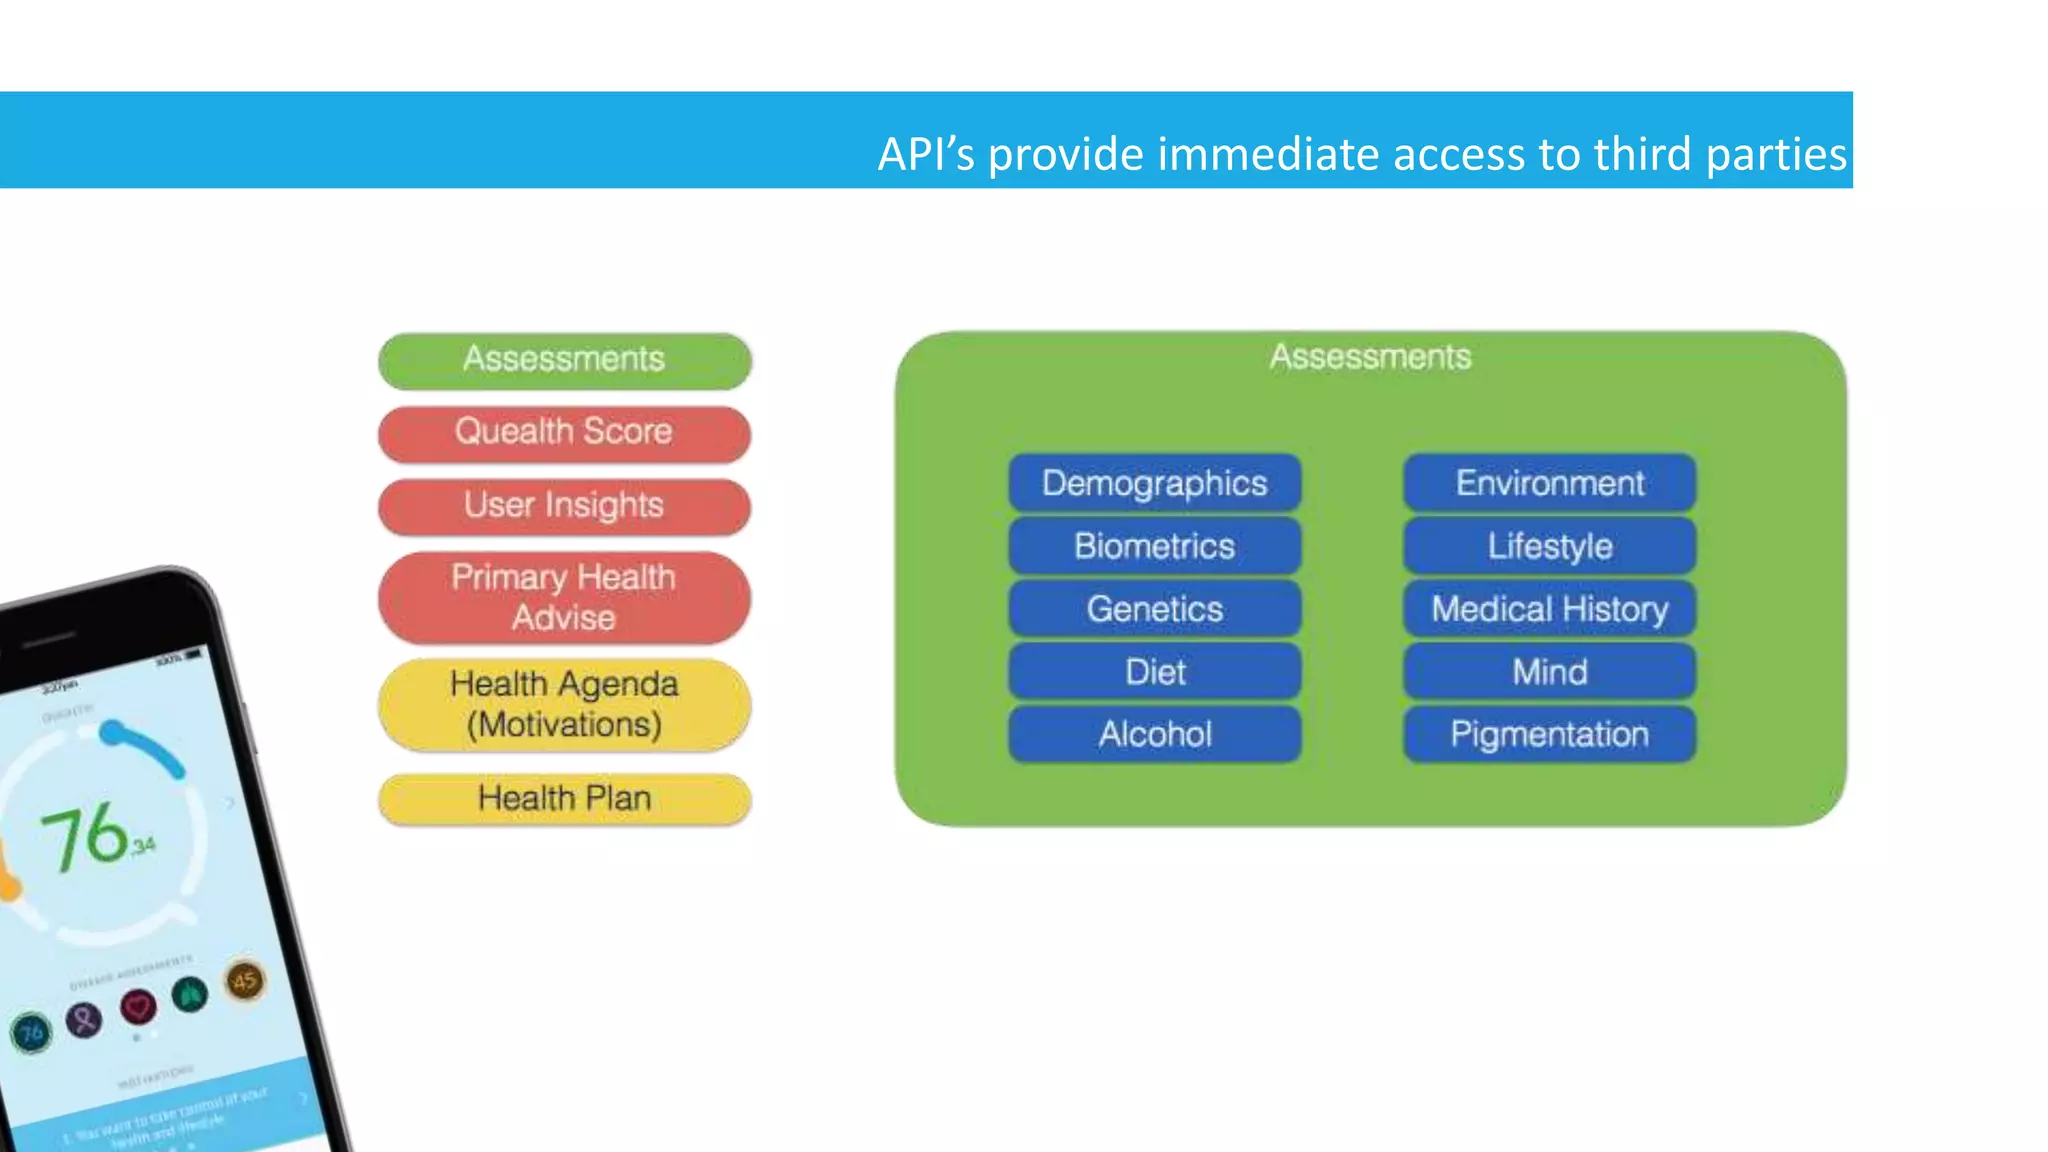
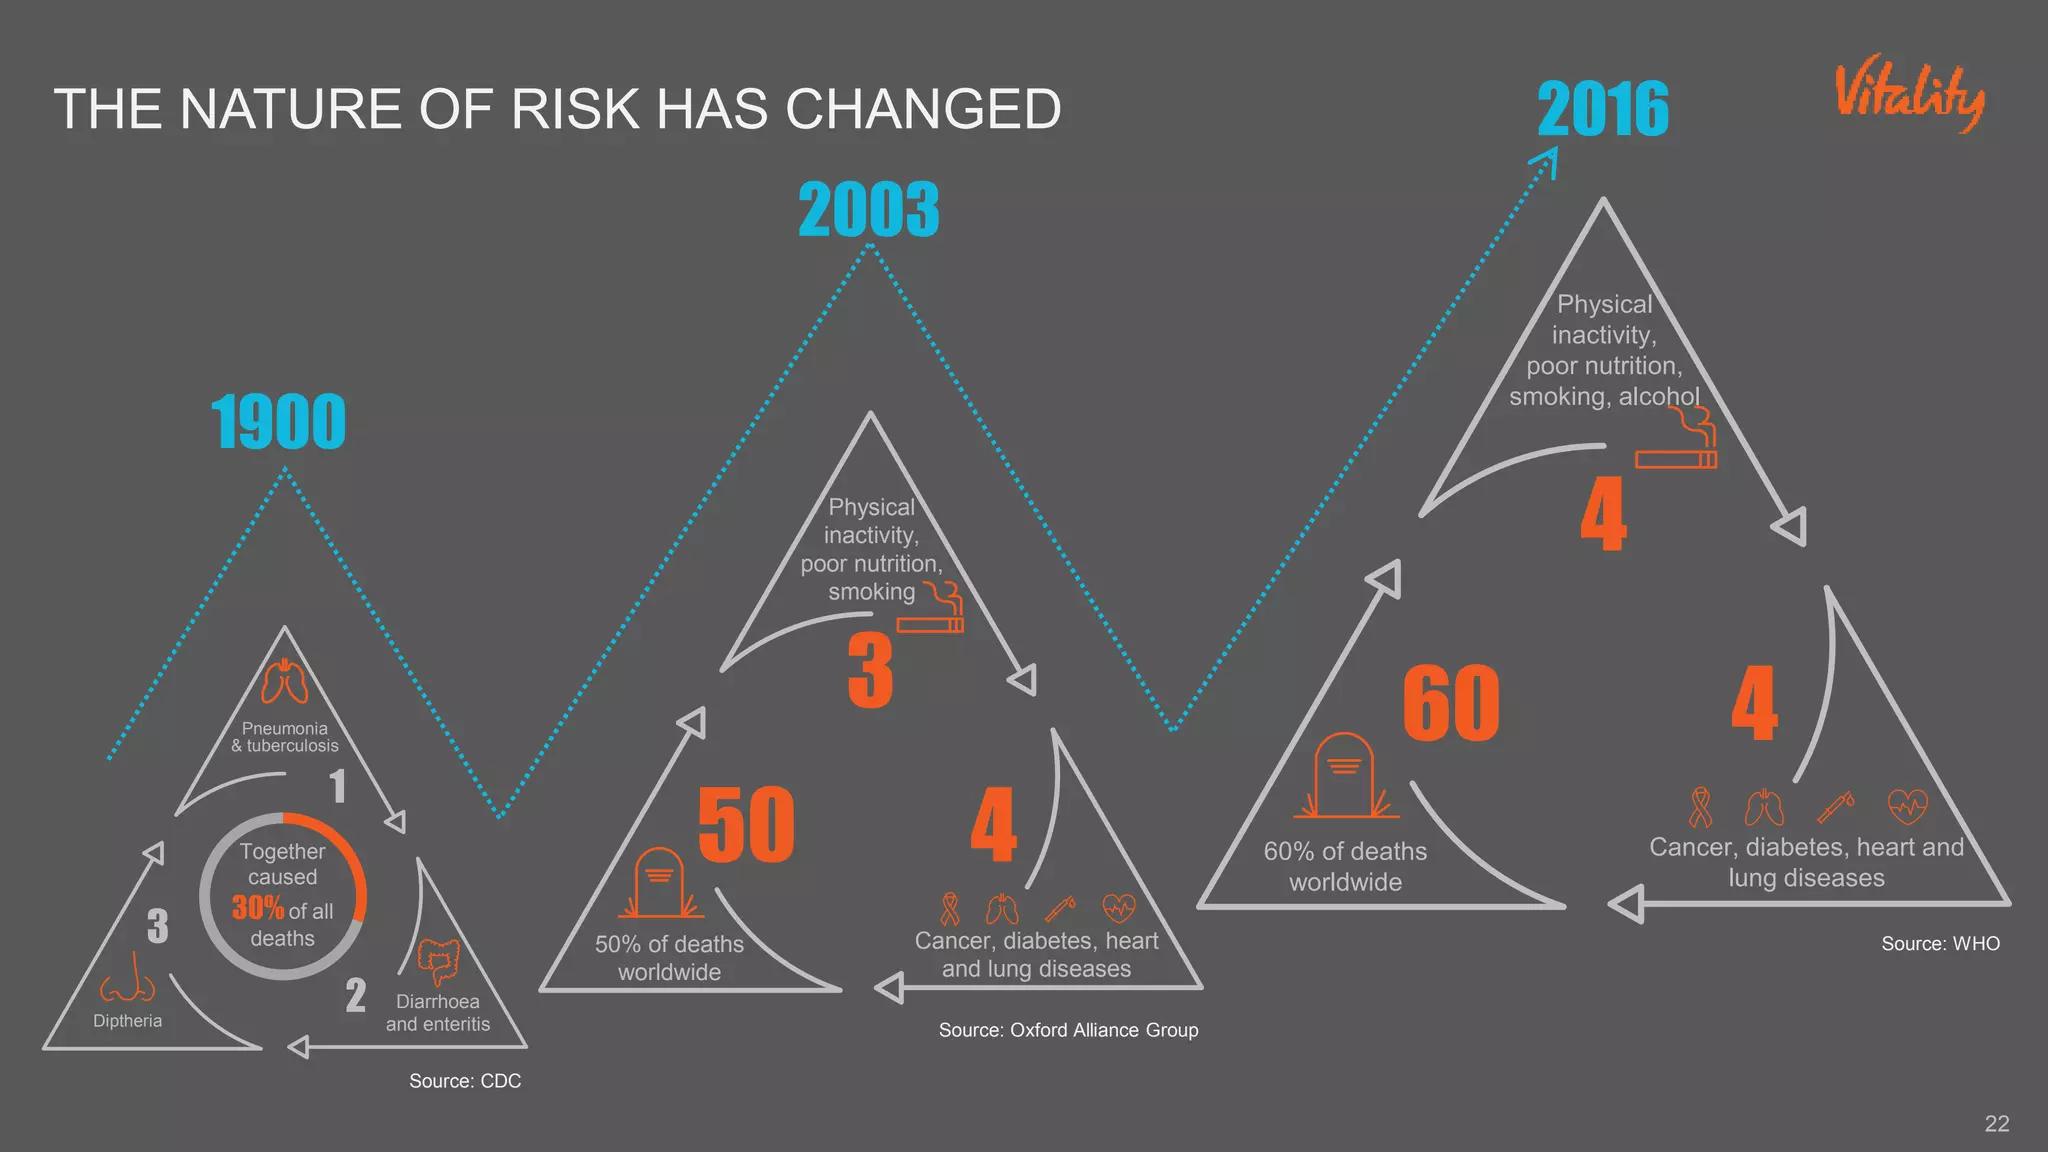
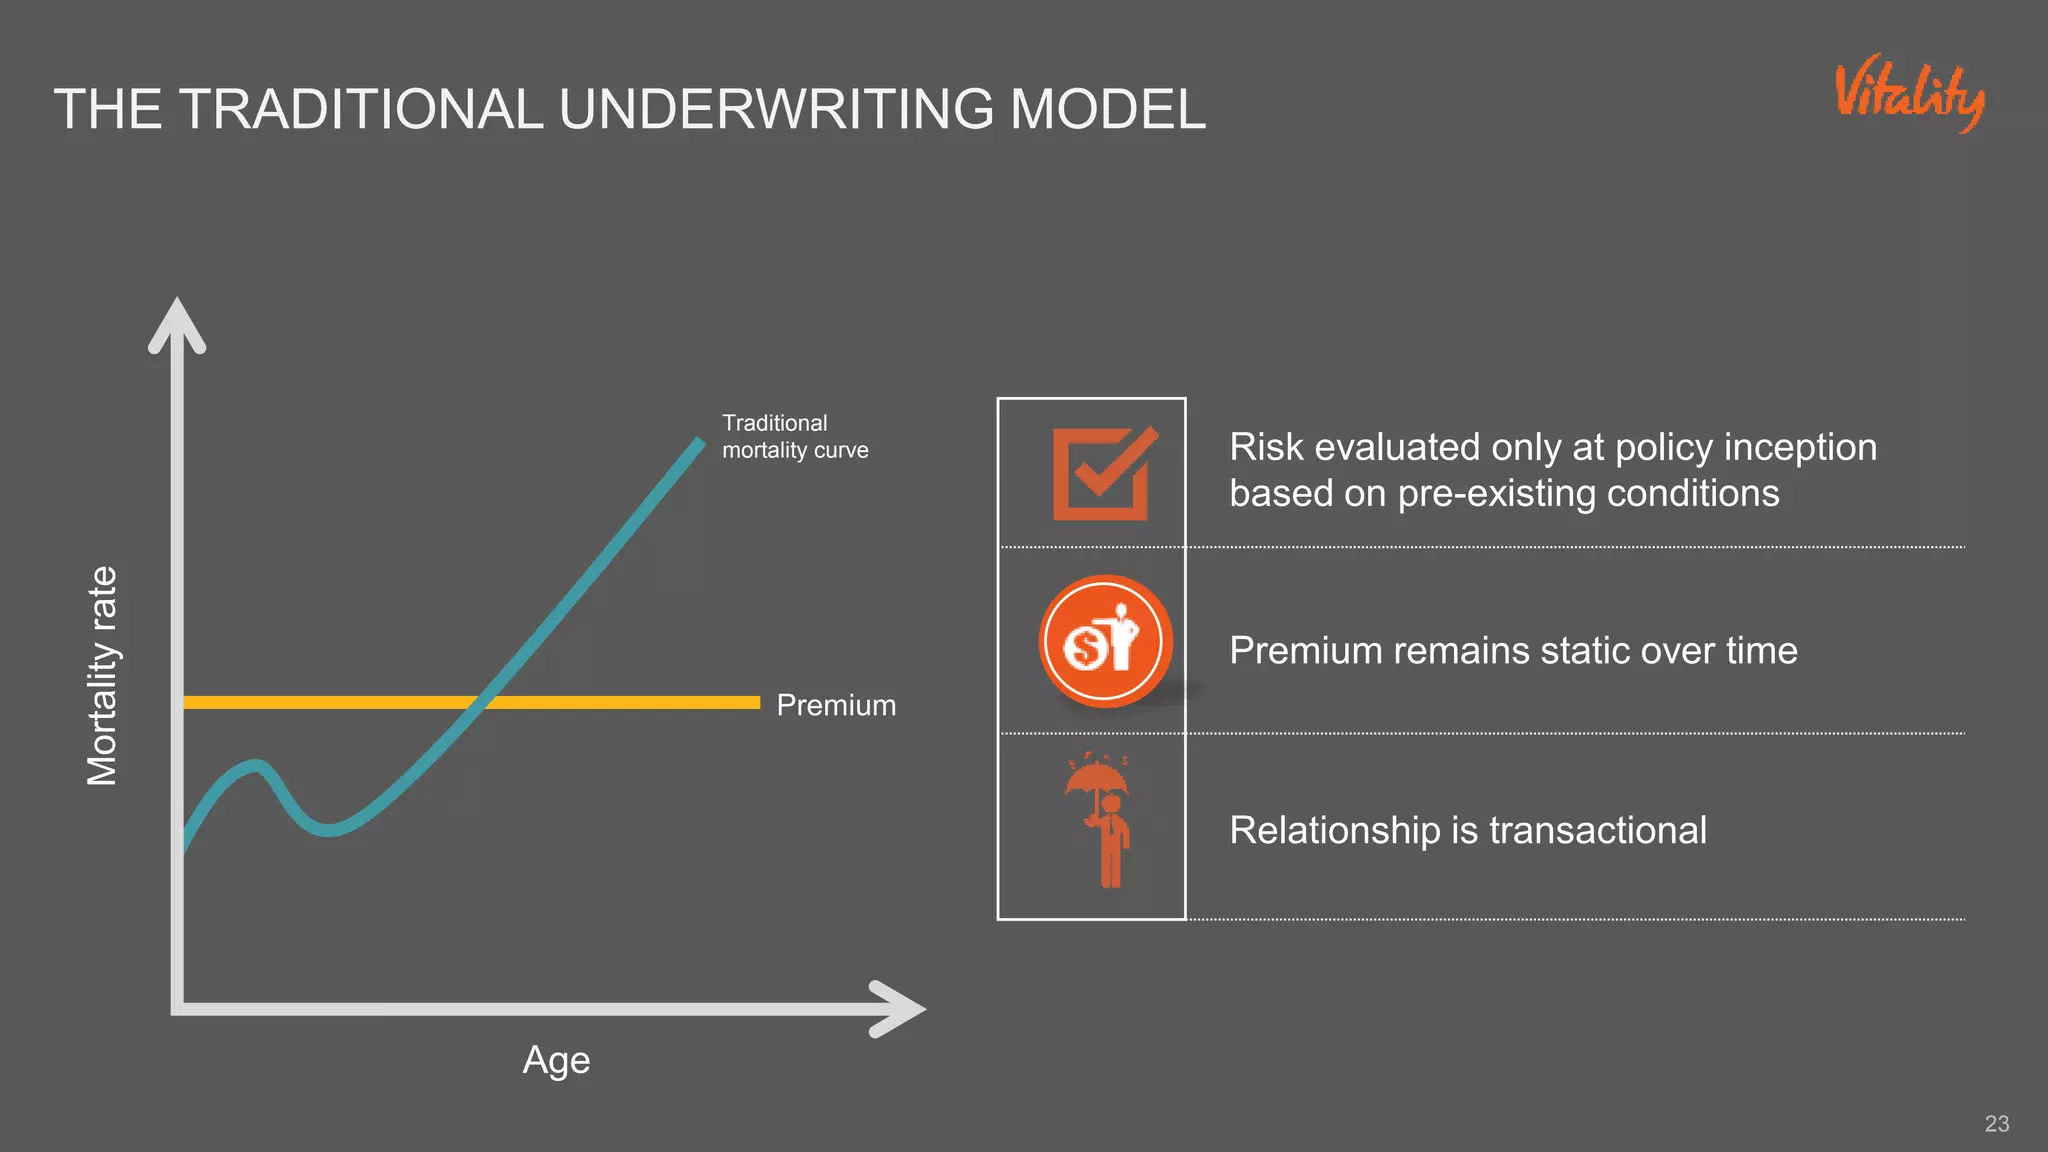
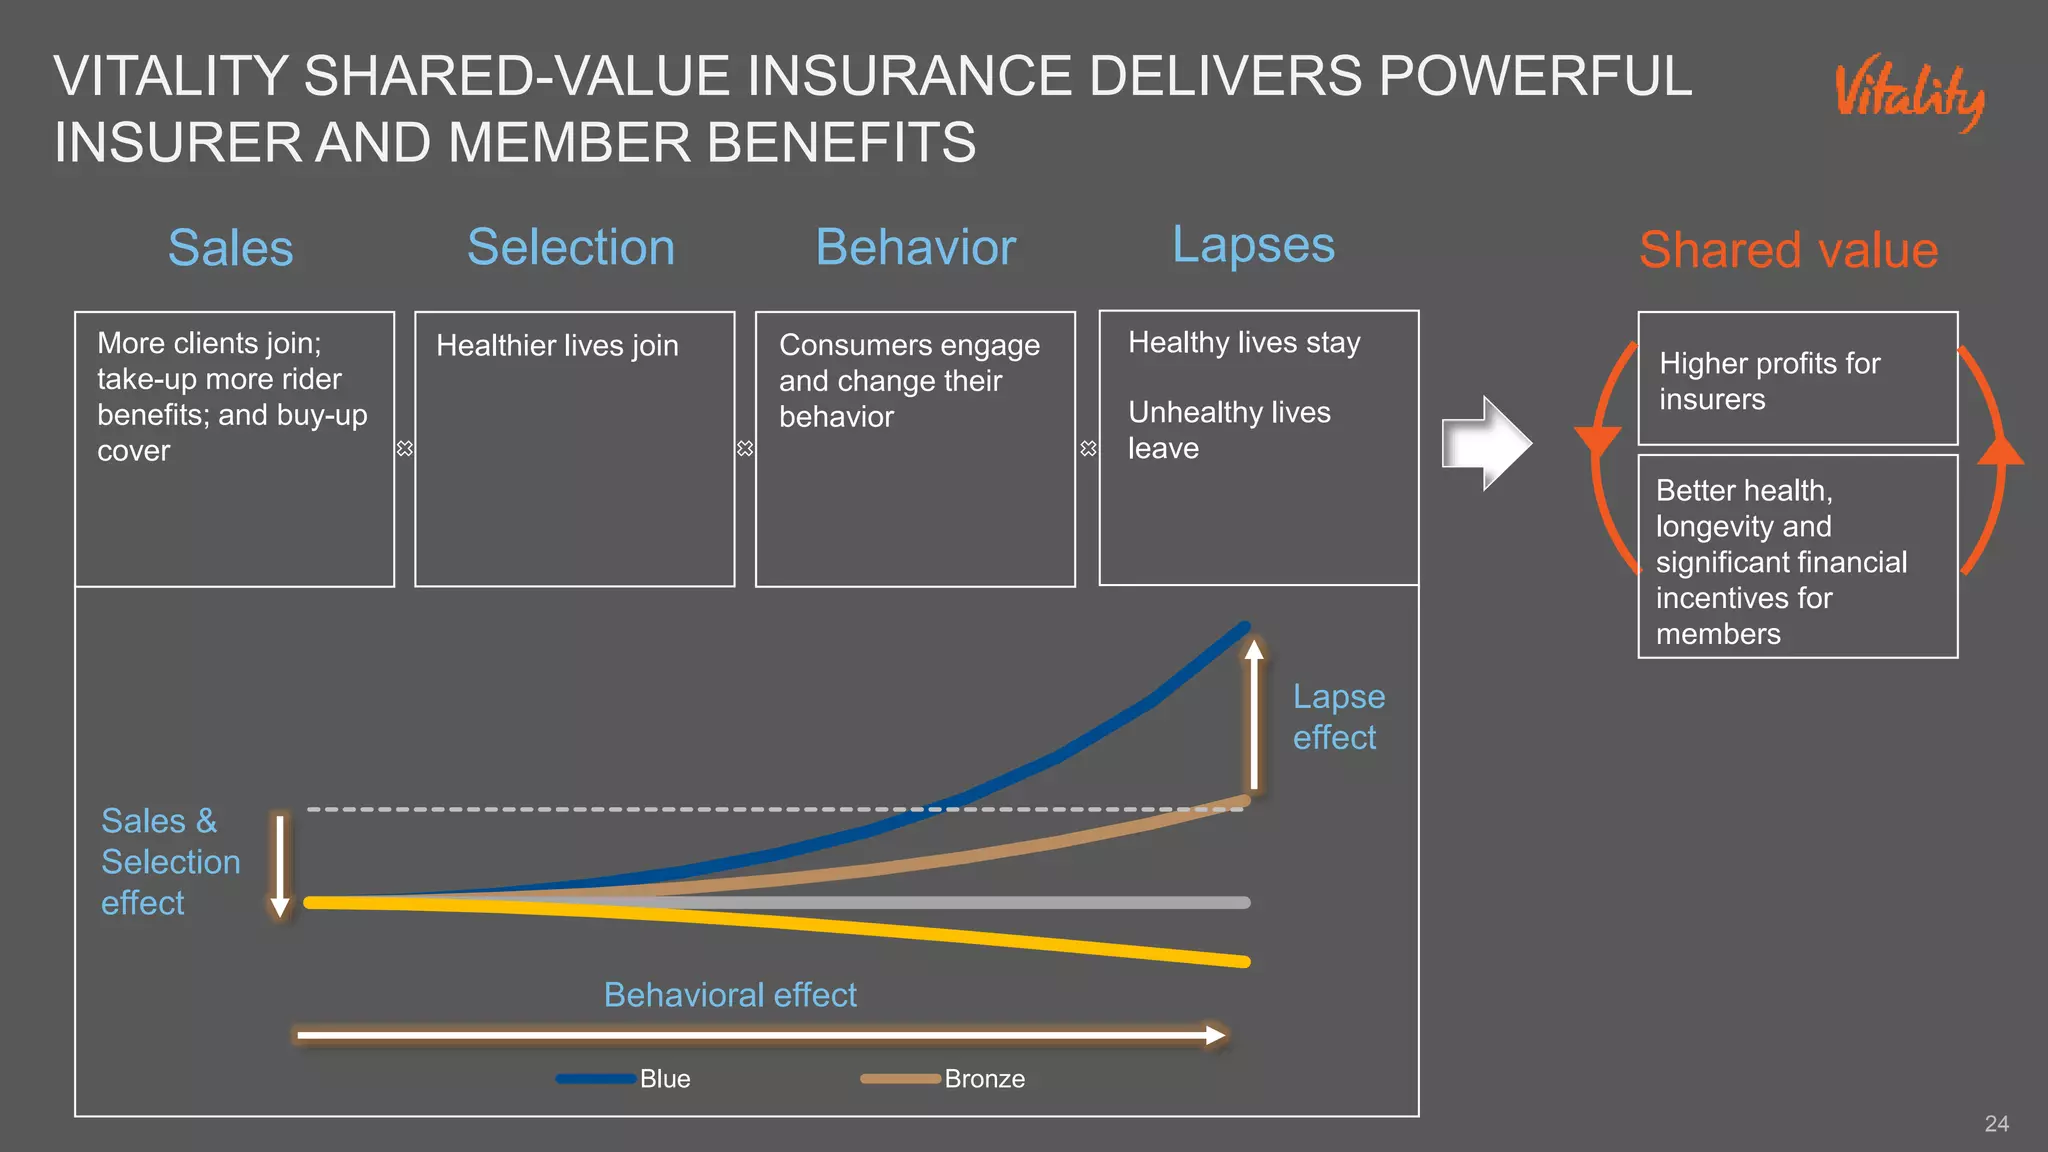
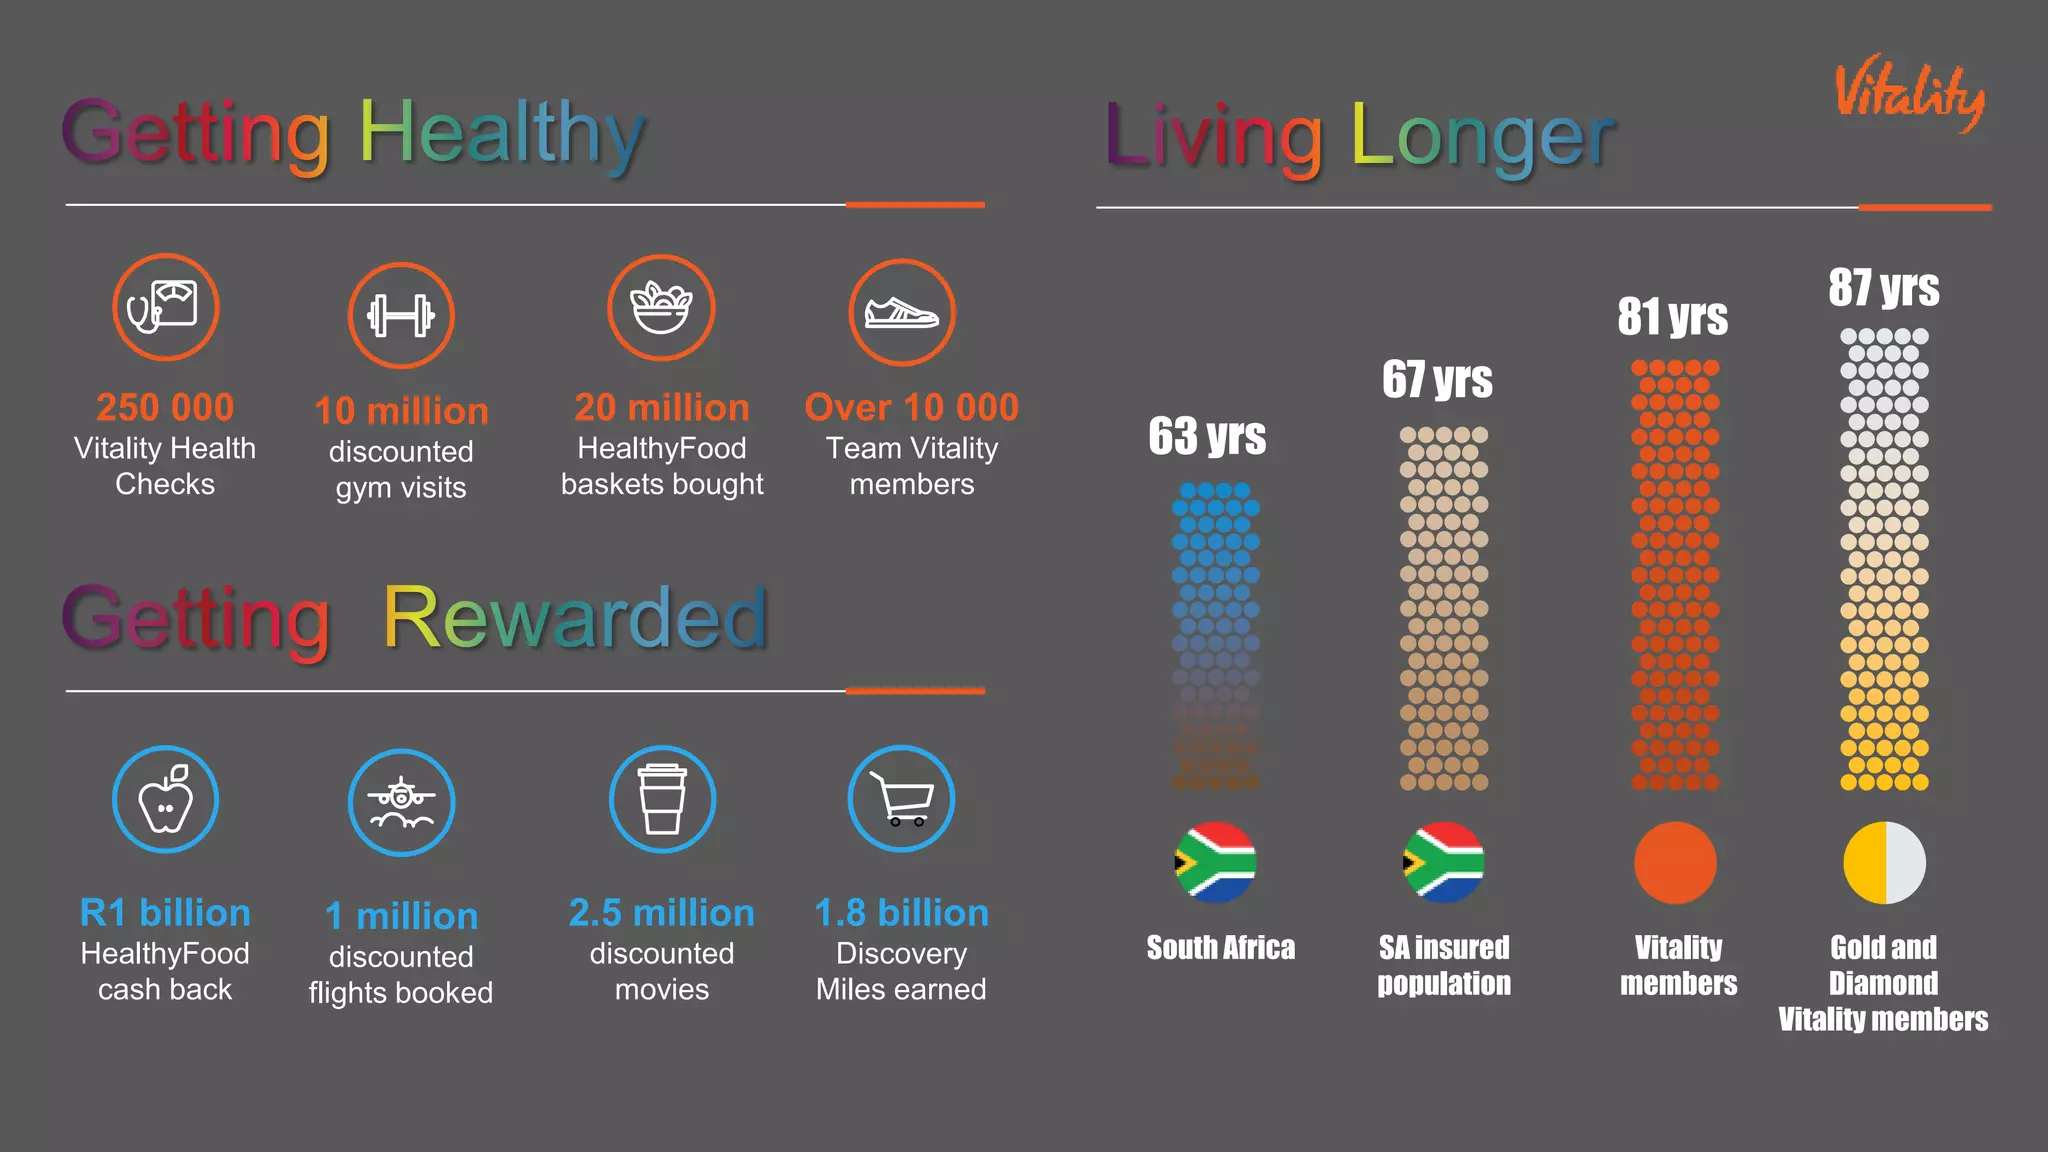
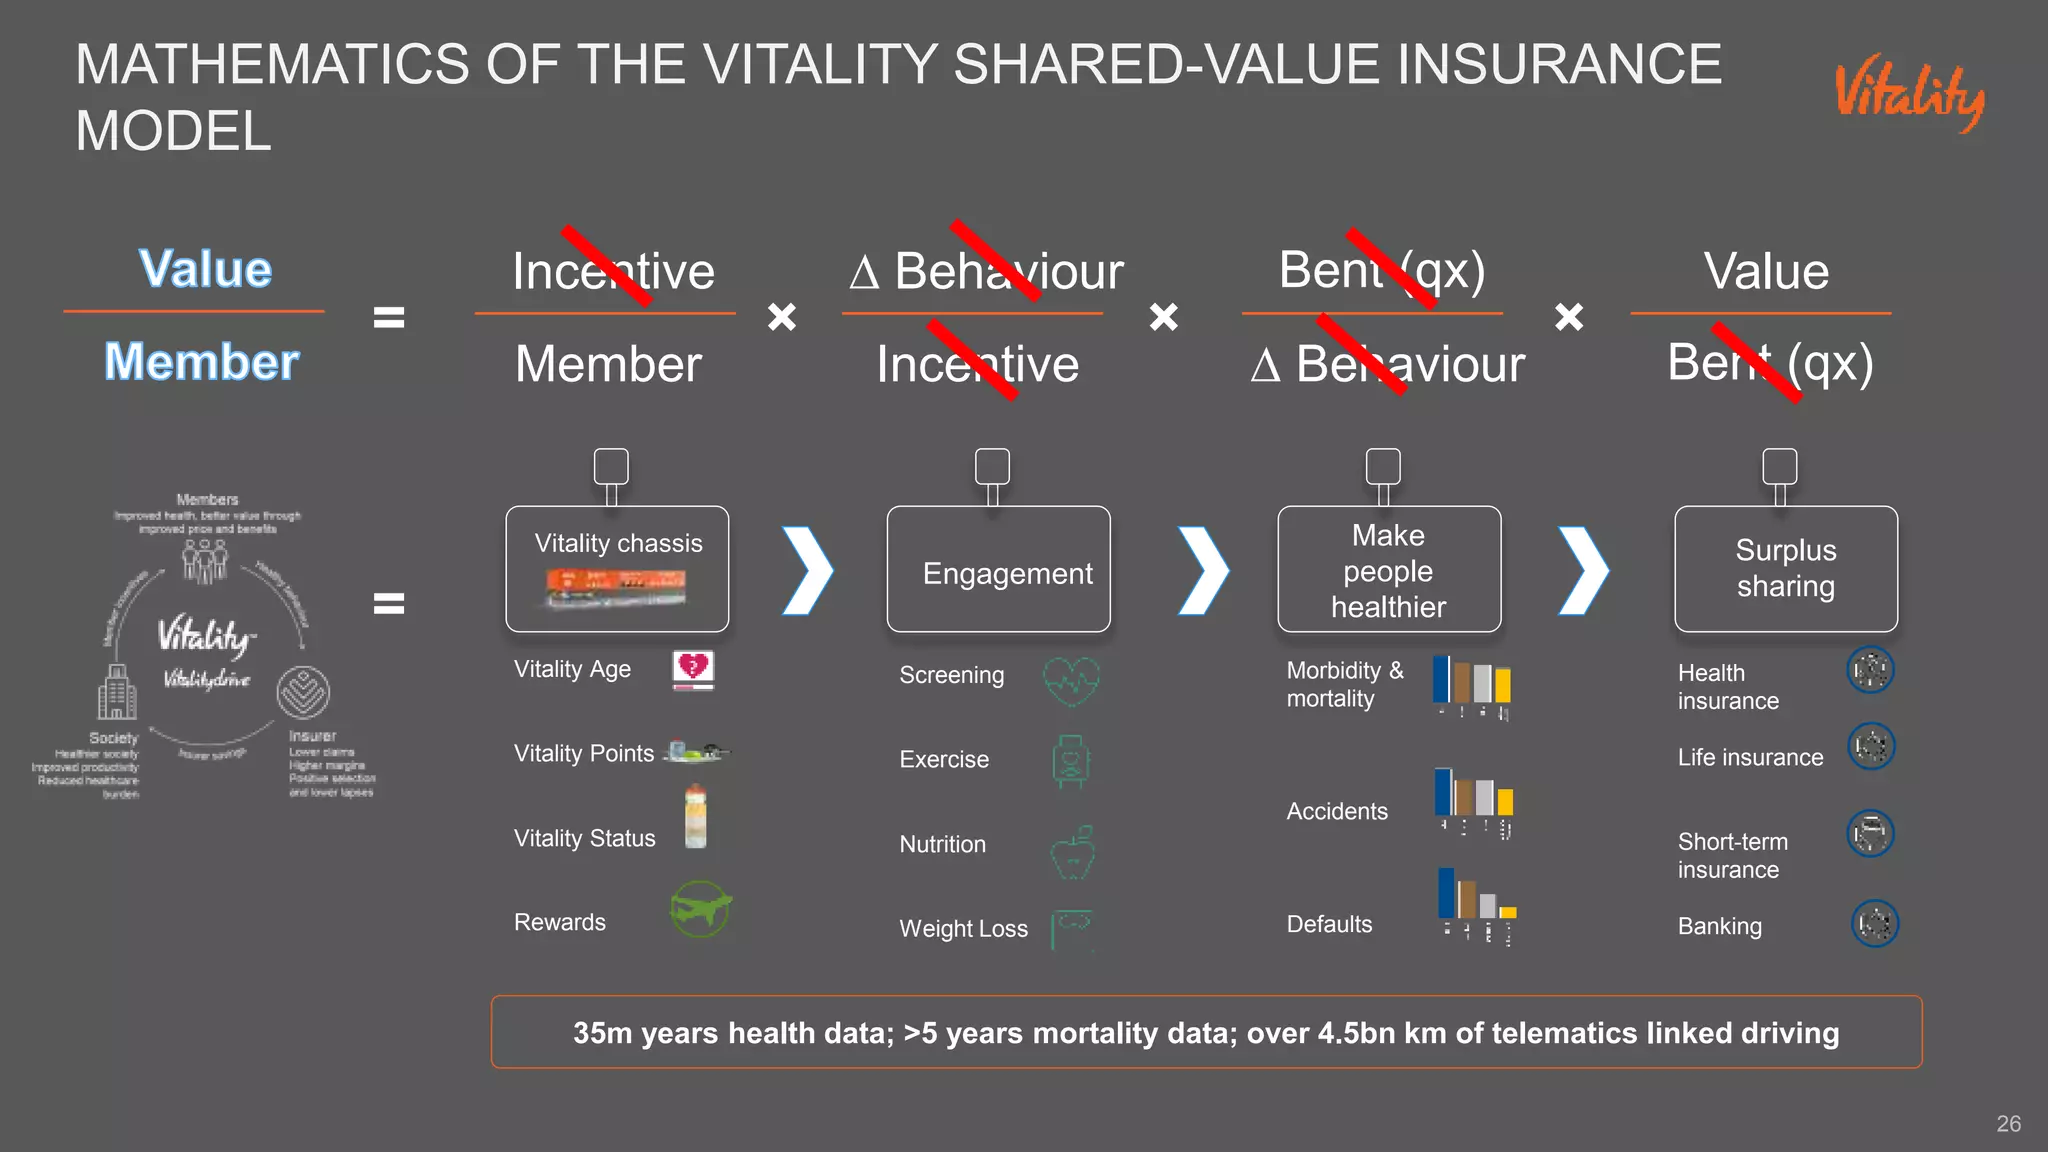
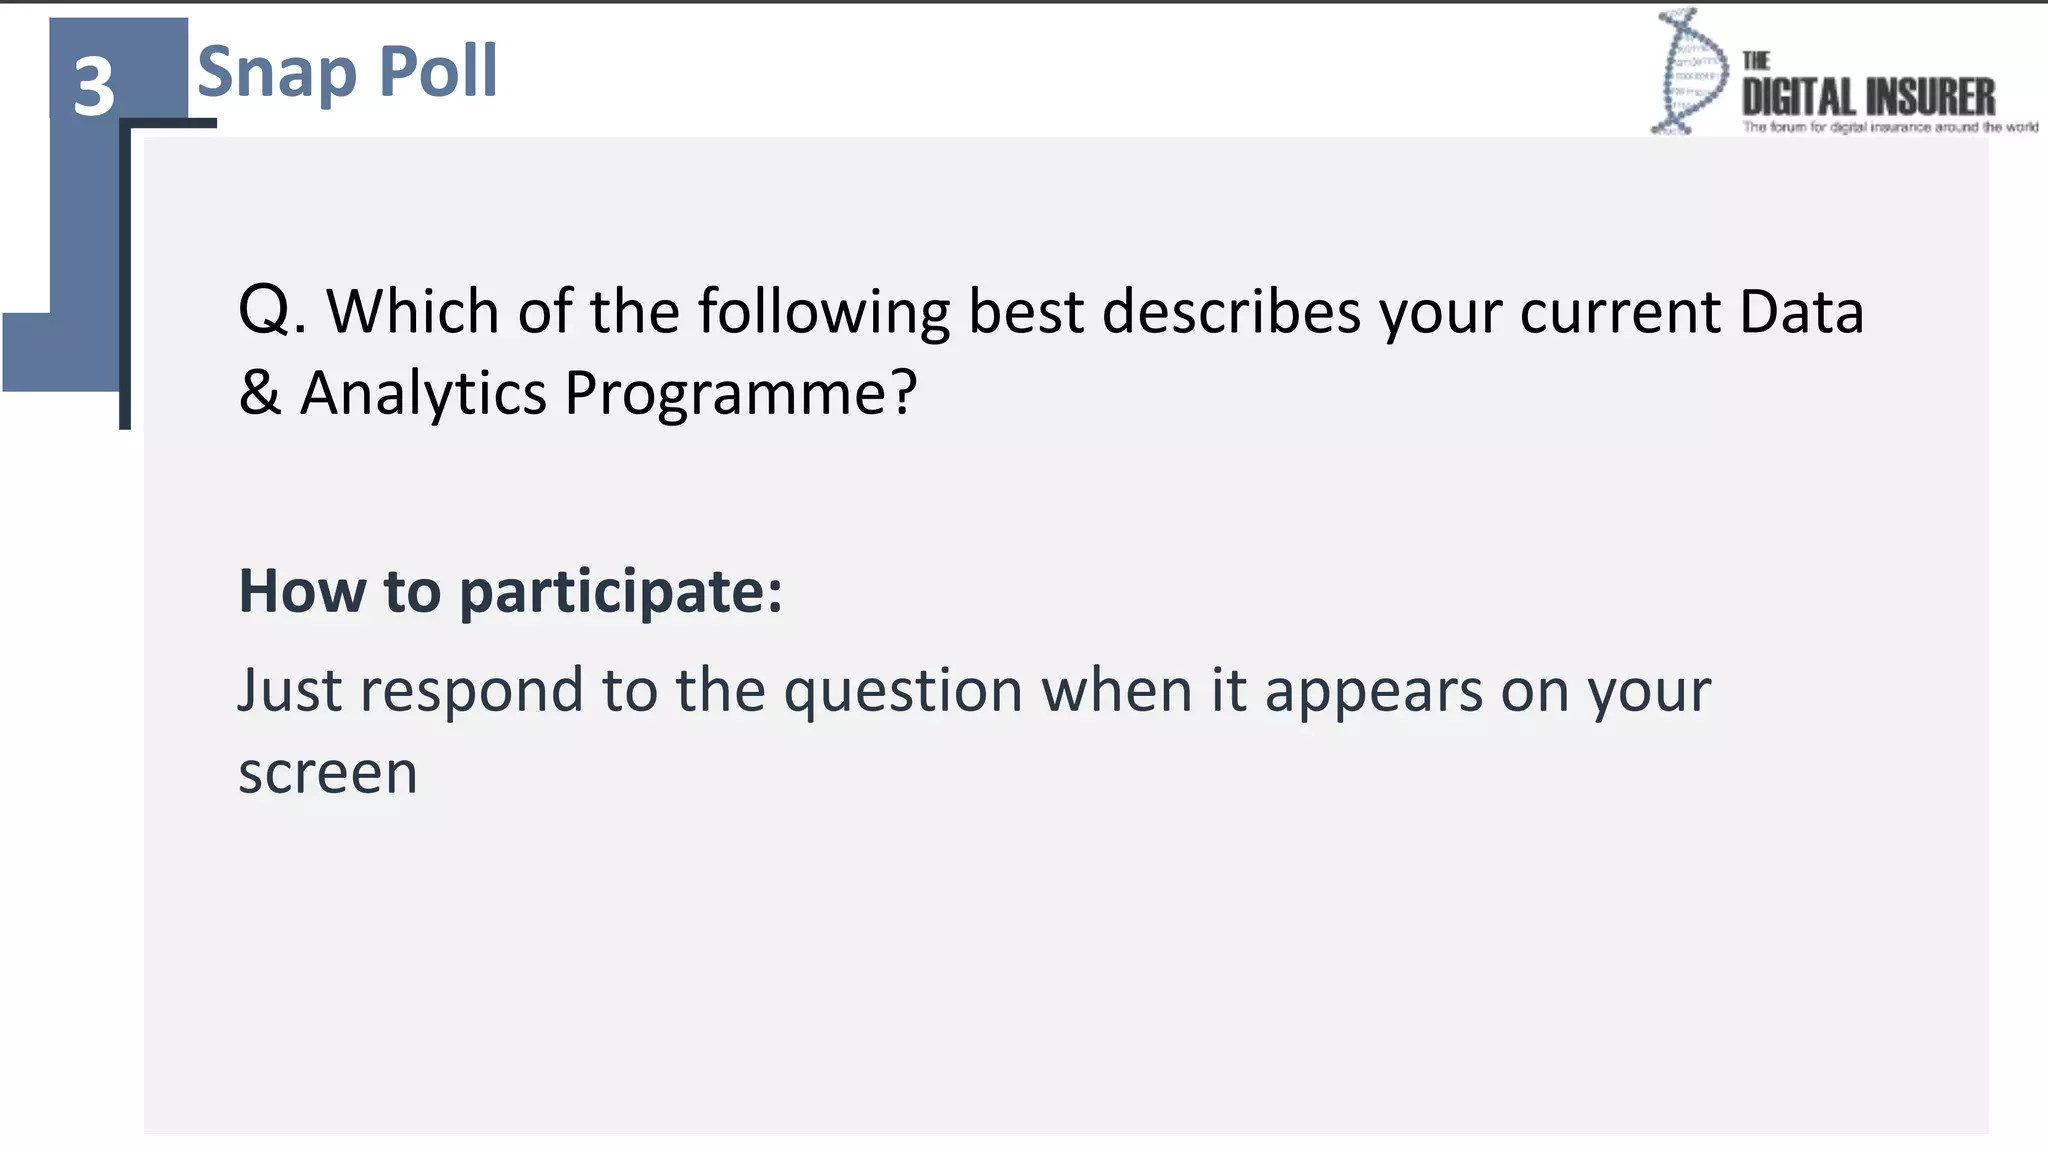
1
Why Telematics?
Webinar: Insurance Aggregators In Asia
29th September 2015
Webinar: Data & Analytics from a Life & Health Perspective
Our Panelists
Discussion agenda
1 Presentations:
Torsten Duwenhorst: Essentials of establishing D&A capabilities and
a data-driven corporate culture
Dr. Hongjuan Liu: An insurer’s view on data & analytics
Alistair Wickens: Using data & analytics to build your business
Joe Van Niekerk:How data & analytics are at the heart of Vitality Life
2 Questions and Answers
3 Snap Poll – share your view
Questions & Answers
How to participate:
If you have a question please type into the messaging area
and send to the presenters
Session format:
The moderator will use a combination of his own questions
and those from the audience
Torsten Duwenhorst @KPMG:
Essentials of establishing data & analytics
capabilities and a data-driven corporate culture
Dr. Hongjuan Liu @AEGON:
An insurer’s view on data & analytics
Strategy & Vision
 Corporate culture
 Requirements
 Pain points
Evaluation
 Modelcomparison
 Accuracy
 Trainingvs. Testcomparison
MonitorModel’sPerformance
• Reviewand adjustmodel /data
sources
Data Modeling/ Insights
 Buildingpredictivemodels
 Collaborationbetween analyticsprofessionals and subjectmatter
experts
 Consider IT platformsfordevelopment (proprietaryvs.open source; on
premisevs. cloud
Data Sources
 Internal /External
 Datasourcing (Social Media, public
sector,digital platforms,data vendors,
personal devices)
Algorithms
Deployment
 Work flowIntegration
 People & Change
 Customerrollout (Apps;Wearables)
Essentials of establishing data & analytics capabilities and a
data-driven corporate culture
Sales
reliance on top sales
i.e. Whoscall
due to market competition
Data Privacy
customer consent, do-not-call list
Rising Complaints
Call-Blocking Apps
Increasing Costs
any dissatisfaction e.g.marketing
channel, selling techniques
Low Persistency Rate
due to product-push approach
Market Challenges
Data & Analytics is Key to Understanding Customers
Demographics
Transactional Interactions
Digital Footprint
Impact of Propensity to Buy Models
o Test group
(targeted using propensity model)
o Control group
(targeted randomly)
Up by 70%
An AEGON Case Study
SMART 3600: Customer Journey Scores
Customer Life Stage
Insurance Needs
Purchase Journey
Channel Preference
Quality Requirement
Mood (Sentiment)
Married w Kids
Consideration
stage
Concerns about Child Education
OBTM friendly
Smiley face
Enriched Single Customer View for ultra personalization
Thank you
Alistair Wickens @Quealth:
Using data & analytics to build your business
©2016 roadtohealth Group Ltd
Creating one of the world’s
most effective predictors of
disease risk
Quealth answers
the ‘so what?’
question arising
from the tsunami of
app and wearable-
generated data.
Distils health and fitness data into one easy-to-
understand Quealth Score™.
Set a personal health agenda
Change behaviours and reduce risk using the
intuitive health coach
API’s provide immediate access to third parties
Joe Van Niekerk @ Vitality:
How data & analytics are at the heart of Vitality Life
DISCOVERY PRIMARY
MARKETS
DISCOVERY PARTNER
MARKETS
OTHER
THE NATURE OF RISK HAS CHANGED
22
Source: CDC
Source: WHO
Source: Oxford Alliance Group
Physical
inactivity,
poor nutrition,
smoking, alcohol
Cancer, diabetes, heart and
lung diseases
60% of deaths
worldwide
4
460
Physical
inactivity,
poor nutrition,
smoking
Cancer, diabetes, heart
and lung diseases
50% of deaths
worldwide
3
450
Pneumonia
& tuberculosis
Diarrhoea
and enteritisDiptheria
1
2
3
Together
caused
30%of all
deaths
1900
2003
2016
THE TRADITIONAL UNDERWRITING MODEL
23
Risk evaluated only at policy inception
based on pre-existing conditions
Premium remains static over time
Relationship is transactional
Age
Mortalityrate
Traditional
mortality curve
Premium
VITALITY SHARED-VALUE INSURANCE DELIVERS POWERFUL
INSURER AND MEMBER BENEFITS
Sales Selection LapsesBehavior Shared value
More clients join;
take-up more rider
benefits; and buy-up
cover
Healthier lives join Healthy lives stay
Unhealthy lives
leave
Consumers engage
and change their
behavior
Higher profits for
insurers
Better health,
longevity and
significant financial
incentives for
members
Blue Bronze
Sales &
Selection
effect
Behavioral effect
Lapse
effect
24
250 000
Vitality Health
Checks
10 million
discounted
gym visits
20 million
HealthyFood
baskets bought
R1 billion
HealthyFood
cash back
2.5 million
discounted
movies
1 million
discounted
flights booked
1.8 billion
Discovery
Miles earned
Over 10 000
Team Vitality
members
South Africa SA insured
population
Vitality
members
Gold and
Diamond
Vitality members
63 yrs
67 yrs
81 yrs
87 yrs
MATHEMATICS OF THE VITALITY SHARED-VALUE INSURANCE
MODEL
26
=
∆ Behaviour
Incentive
Incentive
Member
Bent (qx)
∆ Behaviour
× × ×
Value
Bent (qx)
Vitality chassis
Engagement
Make
people
healthier
Surplus
sharing
=
Screening
Exercise
Nutrition
Weight Loss
Vitality Age
Vitality Points
Vitality Status
Rewards
Morbidity &
mortality
Accidents
Defaults
Health
insurance
Life insurance
Short-term
insurance
Banking
35m years health data; >5 years mortality data; over 4.5bn km of telematics linked driving
2
27
Questions & Answers
How to participate:
If you have a question please type into the messaging area
and send to the presenters
Session format:
The moderator will use a combination of his own questions
and those from the audience
Snap Poll3
28
Q. Which of the following best describes your current Data
& Analytics Programme?
How to participate:
Just respond to the question when it appears on your
screen
Bringing our community in Asia together for an
innovative conference on digital insurance in 2016
Location: Hong Kong
Date: 23rd November 2016
http:asia2016.the-digital-insurer.com
Digital Insurance Conference in Asia
Post webinar activities
Recording will be emailed to registered participants
Next Webinar will be in January 2017 – date and topic TBC
Please give us your feedback
If you would like to follow up with any of the panelists
- Simon Phipps: simon.phipps@kpmg.com
- Torsten Duwenhorst: torsten.duwenhorst@kpmg.com
- Dr Hongjuan Liu: juan.liu@aegon.com
- Alistair Wickens: alistair.wickens@quealth.co
- Joe Van Niekerk: JoeVa@discovery.co.za
- Andrew Dart: Andrew.Dart@the-digital-insurer.com
- Hugh Terry: hugh.terry@the-digital-insurer.com

Data & Analytics - Webinar Deck

  • 1.
    1 Why Telematics? Webinar: InsuranceAggregators In Asia 29th September 2015 Webinar: Data & Analytics from a Life & Health Perspective
  • 2.
  • 3.
    Discussion agenda 1 Presentations: TorstenDuwenhorst: Essentials of establishing D&A capabilities and a data-driven corporate culture Dr. Hongjuan Liu: An insurer’s view on data & analytics Alistair Wickens: Using data & analytics to build your business Joe Van Niekerk:How data & analytics are at the heart of Vitality Life 2 Questions and Answers 3 Snap Poll – share your view
  • 4.
    Questions & Answers Howto participate: If you have a question please type into the messaging area and send to the presenters Session format: The moderator will use a combination of his own questions and those from the audience
  • 5.
    Torsten Duwenhorst @KPMG: Essentialsof establishing data & analytics capabilities and a data-driven corporate culture
  • 6.
    Dr. Hongjuan Liu@AEGON: An insurer’s view on data & analytics
  • 7.
    Strategy & Vision Corporate culture  Requirements  Pain points Evaluation  Modelcomparison  Accuracy  Trainingvs. Testcomparison MonitorModel’sPerformance • Reviewand adjustmodel /data sources Data Modeling/ Insights  Buildingpredictivemodels  Collaborationbetween analyticsprofessionals and subjectmatter experts  Consider IT platformsfordevelopment (proprietaryvs.open source; on premisevs. cloud Data Sources  Internal /External  Datasourcing (Social Media, public sector,digital platforms,data vendors, personal devices) Algorithms Deployment  Work flowIntegration  People & Change  Customerrollout (Apps;Wearables) Essentials of establishing data & analytics capabilities and a data-driven corporate culture
  • 8.
    Sales reliance on topsales i.e. Whoscall due to market competition Data Privacy customer consent, do-not-call list Rising Complaints Call-Blocking Apps Increasing Costs any dissatisfaction e.g.marketing channel, selling techniques Low Persistency Rate due to product-push approach Market Challenges
  • 9.
    Data & Analyticsis Key to Understanding Customers Demographics Transactional Interactions Digital Footprint
  • 10.
    Impact of Propensityto Buy Models o Test group (targeted using propensity model) o Control group (targeted randomly) Up by 70% An AEGON Case Study
  • 11.
    SMART 3600: CustomerJourney Scores Customer Life Stage Insurance Needs Purchase Journey Channel Preference Quality Requirement Mood (Sentiment) Married w Kids Consideration stage Concerns about Child Education OBTM friendly Smiley face Enriched Single Customer View for ultra personalization
  • 12.
  • 13.
    Alistair Wickens @Quealth: Usingdata & analytics to build your business
  • 14.
    ©2016 roadtohealth GroupLtd Creating one of the world’s most effective predictors of disease risk
  • 15.
    Quealth answers the ‘sowhat?’ question arising from the tsunami of app and wearable- generated data.
  • 16.
    Distils health andfitness data into one easy-to- understand Quealth Score™.
  • 17.
    Set a personalhealth agenda
  • 18.
    Change behaviours andreduce risk using the intuitive health coach
  • 19.
    API’s provide immediateaccess to third parties
  • 20.
    Joe Van Niekerk@ Vitality: How data & analytics are at the heart of Vitality Life
  • 21.
  • 22.
    THE NATURE OFRISK HAS CHANGED 22 Source: CDC Source: WHO Source: Oxford Alliance Group Physical inactivity, poor nutrition, smoking, alcohol Cancer, diabetes, heart and lung diseases 60% of deaths worldwide 4 460 Physical inactivity, poor nutrition, smoking Cancer, diabetes, heart and lung diseases 50% of deaths worldwide 3 450 Pneumonia & tuberculosis Diarrhoea and enteritisDiptheria 1 2 3 Together caused 30%of all deaths 1900 2003 2016
  • 23.
    THE TRADITIONAL UNDERWRITINGMODEL 23 Risk evaluated only at policy inception based on pre-existing conditions Premium remains static over time Relationship is transactional Age Mortalityrate Traditional mortality curve Premium
  • 24.
    VITALITY SHARED-VALUE INSURANCEDELIVERS POWERFUL INSURER AND MEMBER BENEFITS Sales Selection LapsesBehavior Shared value More clients join; take-up more rider benefits; and buy-up cover Healthier lives join Healthy lives stay Unhealthy lives leave Consumers engage and change their behavior Higher profits for insurers Better health, longevity and significant financial incentives for members Blue Bronze Sales & Selection effect Behavioral effect Lapse effect 24
  • 25.
    250 000 Vitality Health Checks 10million discounted gym visits 20 million HealthyFood baskets bought R1 billion HealthyFood cash back 2.5 million discounted movies 1 million discounted flights booked 1.8 billion Discovery Miles earned Over 10 000 Team Vitality members South Africa SA insured population Vitality members Gold and Diamond Vitality members 63 yrs 67 yrs 81 yrs 87 yrs
  • 26.
    MATHEMATICS OF THEVITALITY SHARED-VALUE INSURANCE MODEL 26 = ∆ Behaviour Incentive Incentive Member Bent (qx) ∆ Behaviour × × × Value Bent (qx) Vitality chassis Engagement Make people healthier Surplus sharing = Screening Exercise Nutrition Weight Loss Vitality Age Vitality Points Vitality Status Rewards Morbidity & mortality Accidents Defaults Health insurance Life insurance Short-term insurance Banking 35m years health data; >5 years mortality data; over 4.5bn km of telematics linked driving
  • 27.
    2 27 Questions & Answers Howto participate: If you have a question please type into the messaging area and send to the presenters Session format: The moderator will use a combination of his own questions and those from the audience
  • 28.
    Snap Poll3 28 Q. Whichof the following best describes your current Data & Analytics Programme? How to participate: Just respond to the question when it appears on your screen
  • 29.
    Bringing our communityin Asia together for an innovative conference on digital insurance in 2016 Location: Hong Kong Date: 23rd November 2016 http:asia2016.the-digital-insurer.com Digital Insurance Conference in Asia
  • 30.
    Post webinar activities Recordingwill be emailed to registered participants Next Webinar will be in January 2017 – date and topic TBC Please give us your feedback If you would like to follow up with any of the panelists - Simon Phipps: simon.phipps@kpmg.com - Torsten Duwenhorst: torsten.duwenhorst@kpmg.com - Dr Hongjuan Liu: juan.liu@aegon.com - Alistair Wickens: alistair.wickens@quealth.co - Joe Van Niekerk: JoeVa@discovery.co.za - Andrew Dart: Andrew.Dart@the-digital-insurer.com - Hugh Terry: hugh.terry@the-digital-insurer.com

Editor's Notes

  • #2 Introducing the panelists Introducing the discussion agenda
  • #10 In the past, insurance companies, especially in Asia, struggle to have much data. Unlike in the US, where we can buy the whole consumer database, in Asia we rely on in-house data: demographics, transactional & interactions. For agency distributed business, agent tend to keep the information to themselves. E.g. many of the contact information is the agent’s contact detail. With the big data world, digital footprints help to lessen this challenge
  • #12 There are 6 key pieces of information for selling insurance. (a) Customer life stage because insurance needs depend on it. (C) where the customer is on the purchase journey, (d) preferred channel, (e) desired level of service standard (easily complaint) and last but not least, the mood For non-life (or P&C), policies with annual renewable contract, renewal date is most important
  • #16  So, what makes Quealth unique…? How do we differentiate from the 165,000 apps already in the market…?
  • #17 Health is influenced by multiple factors — calls into question the long-term value of disparate trackers. “So what?” if I walk 10k steps? Has the ability to aggregate data from >250 of the world’s most popular devices. Realtime data leads to instant impact on Quealth score. Data is used to calculate the disease risk for 5 conditions: Diabetes, Cancer, COPD (Lung), CVD and Dementia. Single score output, based on a relative risk model. Credited as being one of the world’s most effective metrics for disease risk prediction.
  • #18 We’re all motivated in different ways….
  • #19 “Let me introduce you to healthcoach". Mechanism based on known smartphone behaviours — developed with from UI/UX specialists at Apple Health team in London. Latest integrations include linguistic style and timings of interventions. Key area….machines are as effective as human 1-2-1 interactions in affecting behaviour change. Health outcomes provide evidence.
  • #20  So, what makes Quealth unique…? How do we differentiate from the 165,000 apps already in the market…?
  • #22 Business context Business Drivers Digital assets to enable the business
  • #23 Third, is the proliferation of chronic diseases as a result of the changing nature of risk — in part, a consequence of increased life expectancy A shift in disease burden has taken place (and continues to do so) from communicable diseases to preventable non-communicable diseases, accompanied by a high increase and prevalence in behavioral risk factors Mortality and morbidity risk, which used to be primarily pre-existing or incapable of being influenced, is now dynamic and based on lifestyle choices In 1900 – three communicable diseases accounted for 30% of all deaths. Today four risk factors (poor diet, physical inactivity, tobacco use, and excess alcohol intake) lead to four chronic diseases (cardiovascular disease, diabetes, chronic lung disease, and various cancers) that contribute to 60% of deaths worldwide and 80% of the disease burden
  • #24 In fact, to date insurers have built products based on a static approach to underwriting. Risk is evaluated at policy inception based on pre-existing conditions at that point, and remains unchanged during the currency of the policy, as does the premium. This leads to a transactional relationship – where insurance is a grudge purchase Life insurance has never promoted life – “death insurance”
  • #25 Actuarial value is created and shared, including: Sales (Increased new business; higher rider benefit take up; cover buy up) Selection (Initial selection of healthier lives) Behavioral (Consumer engagement and behavior change) Lapses (Lower lapse rates for those who get value from program; positive selective lapses of unhealthy lives) The outcome of which is: Higher margin/profit for the insurer; and better health, mortality and significant financial incentives for members
  • #28 Hugh will pull up the poll
  • #29 Hugh will pull up the poll