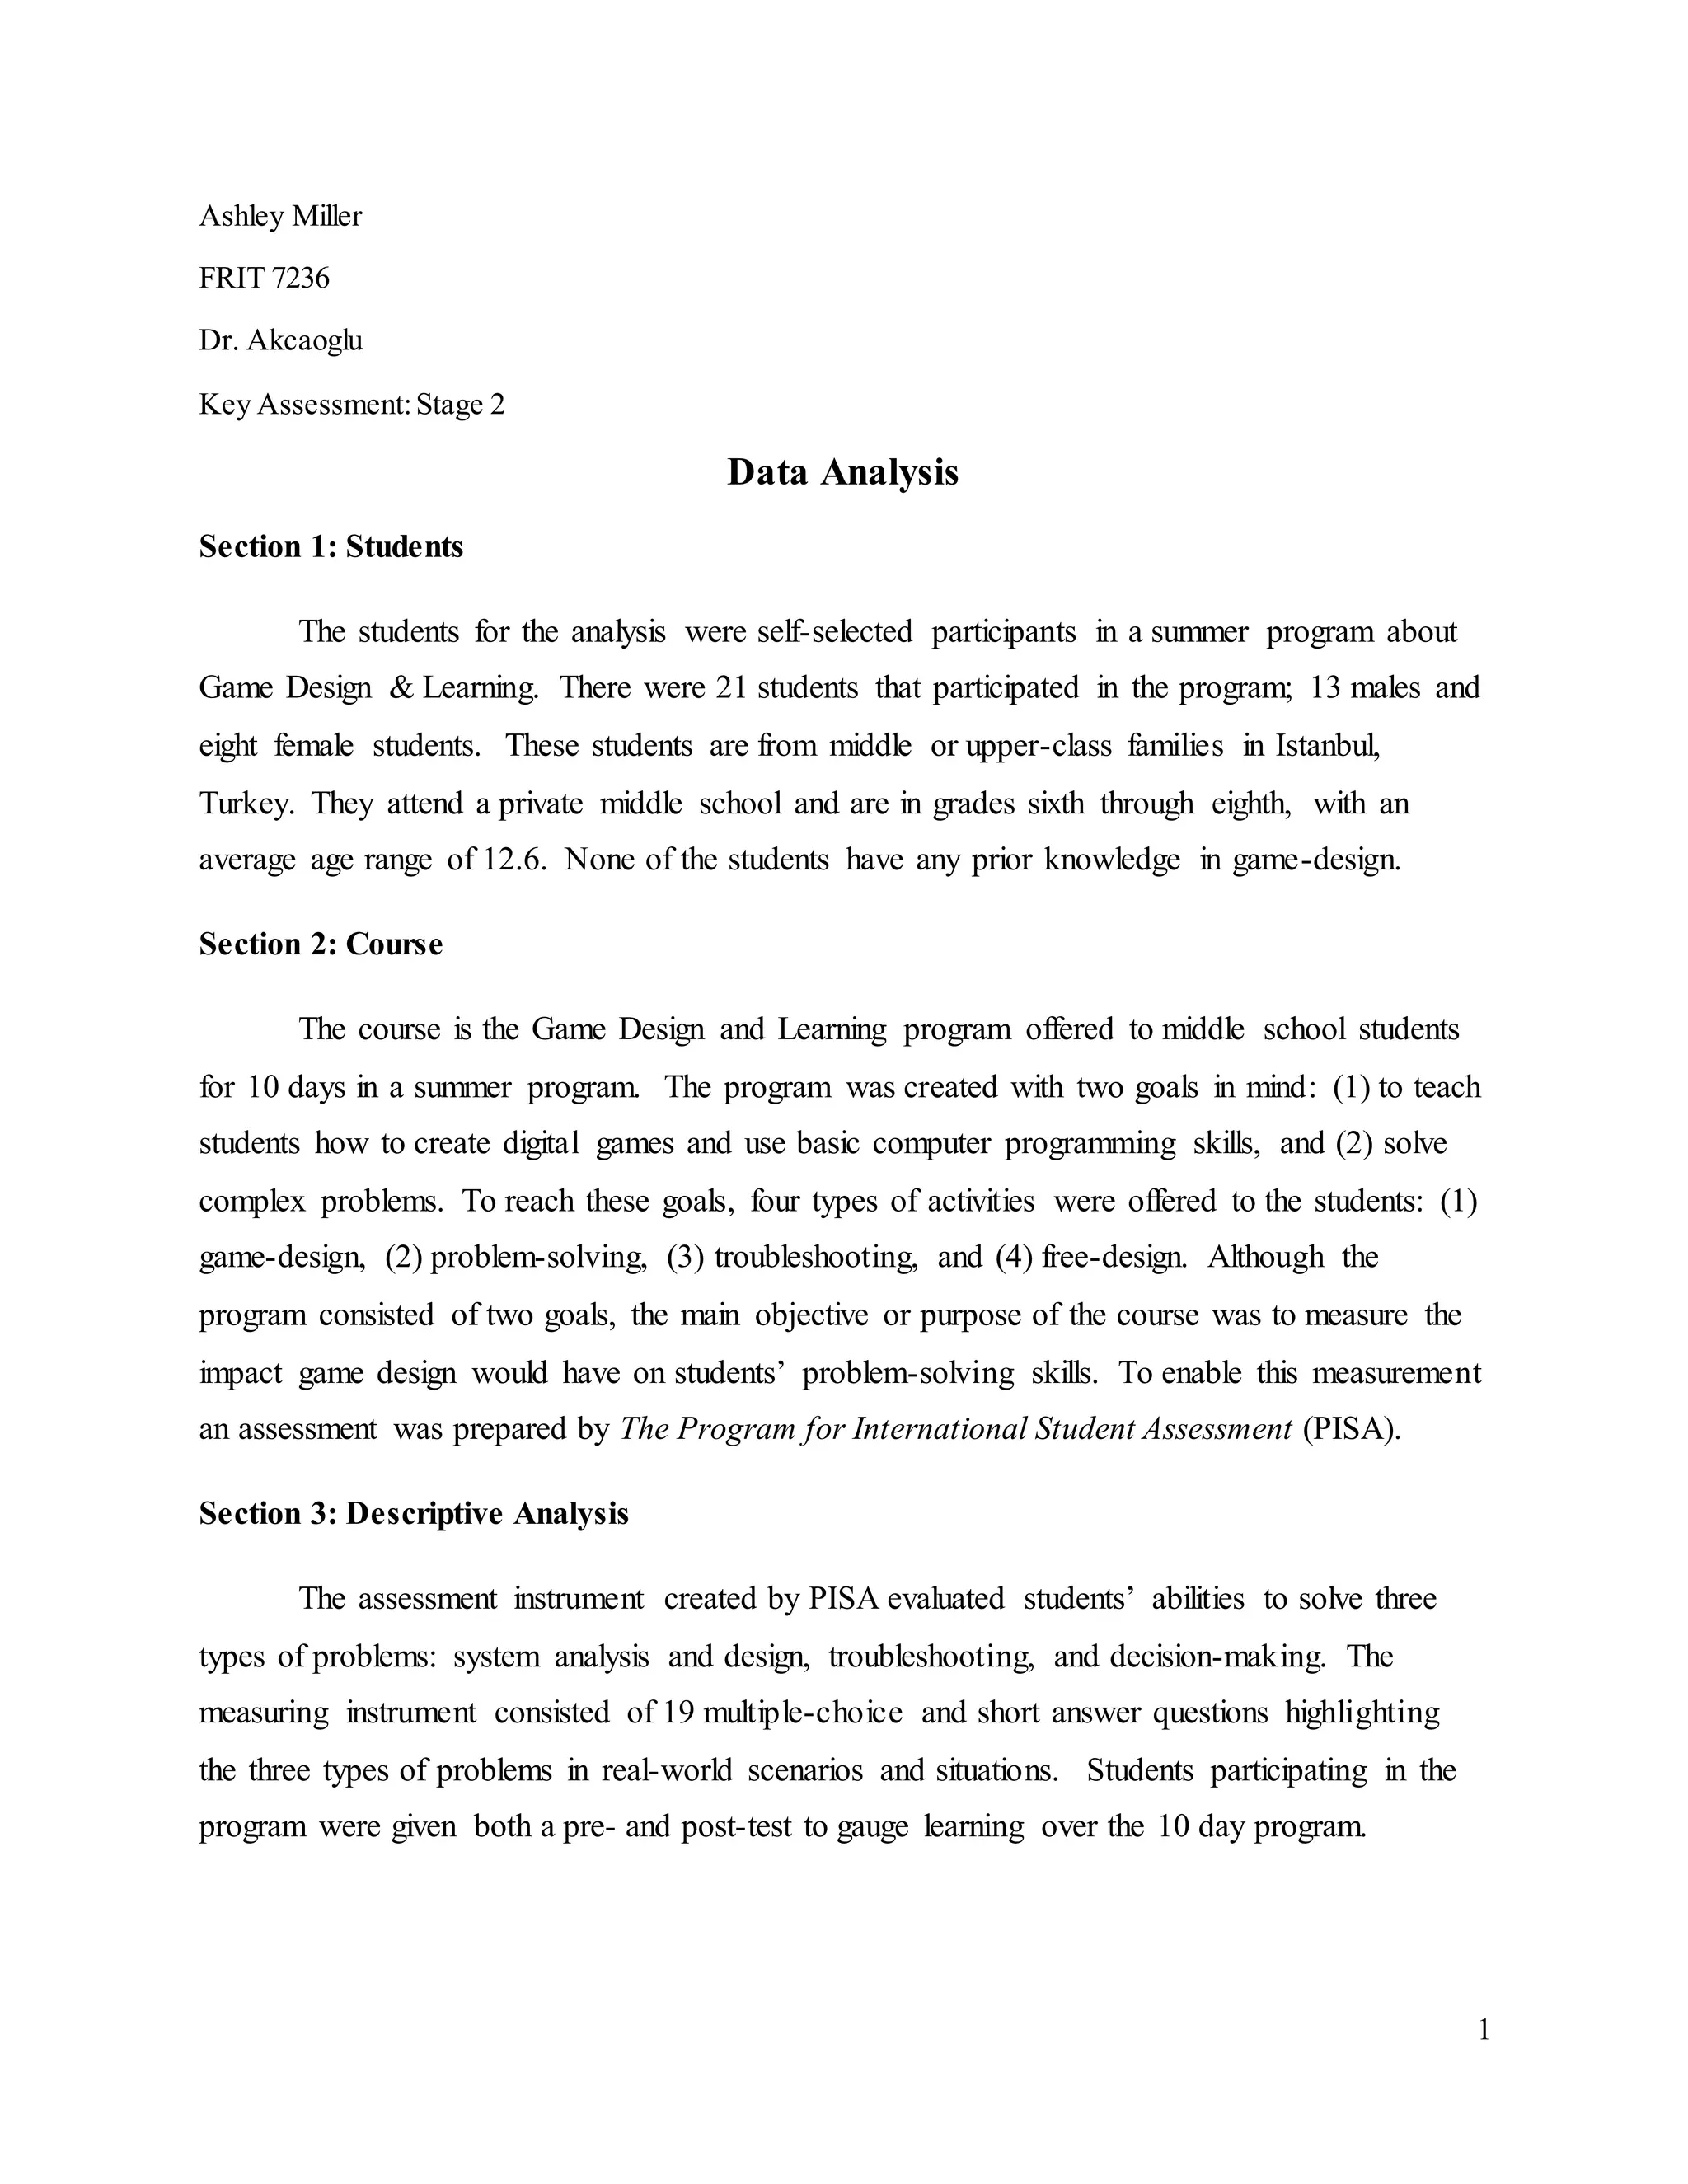
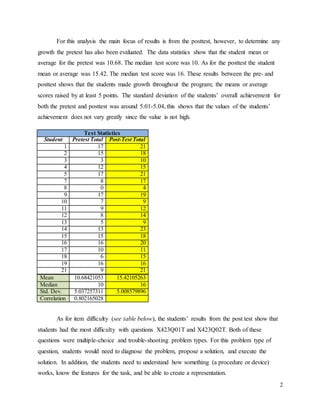
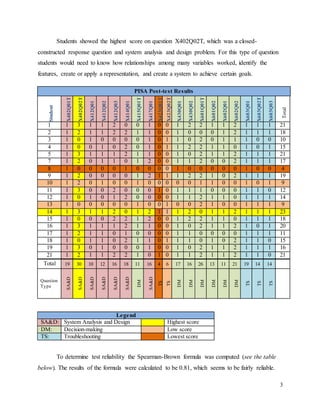
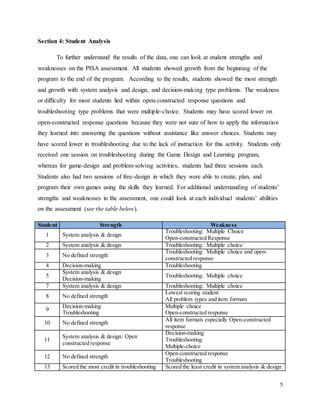
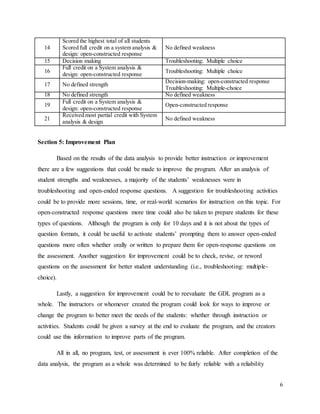
1
Ashley Miller
FRIT 7236
Dr. Akcaoglu
Key Assessment:Stage 2
Data Analysis
Section 1: Students
The students for the analysis were self-selected participants in a summer program about
Game Design & Learning. There were 21 students that participated in the program; 13 males and
eight female students. These students are from middle or upper-class families in Istanbul,
Turkey. They attend a private middle school and are in grades sixth through eighth, with an
average age range of 12.6. None of the students have any prior knowledge in game-design.
Section 2: Course
The course is the Game Design and Learning program offered to middle school students
for 10 days in a summer program. The program was created with two goals in mind: (1) to teach
students how to create digital games and use basic computer programming skills, and (2) solve
complex problems. To reach these goals, four types of activities were offered to the students: (1)
game-design, (2) problem-solving, (3) troubleshooting, and (4) free-design. Although the
program consisted of two goals, the main objective or purpose of the course was to measure the
impact game design would have on students’ problem-solving skills. To enable this measurement
an assessment was prepared by The Program for International Student Assessment (PISA).
Section 3: Descriptive Analysis
The assessment instrument created by PISA evaluated students’ abilities to solve three
types of problems: system analysis and design, troubleshooting, and decision-making. The
measuring instrument consisted of 19 multiple-choice and short answer questions highlighting
the three types of problems in real-world scenarios and situations. Students participating in the
program were given both a pre- and post-test to gauge learning over the 10 day program.
2
For this analysis the main focus of results is from the posttest, however, to determine any
growth the pretest has also been evaluated. The data statistics show that the student mean or
average for the pretest was 10.68. The median test score was 10. As for the posttest the student
mean or average was 15.42. The median test score was 16. These results between the pre- and
posttest shows that the students made growth throughout the program; the means or average
scores raised by at least 5 points. The standard deviation of the students’ overall achievement for
both the pretest and posttest was around 5.01-5.04, this shows that the values of the students’
achievement does not vary greatly since the value is not high.
Test Statistics
Student Pretest Total Post-Test Total
1 17 21
2 15 18
3 3 10
4 12 15
5 17 21
7 8 17
8 0 4
9 17 19
10 7 9
11 9 12
12 8 14
13 5 9
14 13 23
15 15 18
16 16 20
17 10 11
18 6 15
19 16 16
21 9 21
Mean 10.68421053 15.42105263
Median 10 16
Std. Dev. 5.037257311 5.008579896
Correlation 0.802165028
As for item difficulty (see table below), the students’ results from the post test show that
students had the most difficulty with questions X423Q01T and X423Q02T. Both of these
questions were multiple-choice and trouble-shooting problem types. For this problem type of
question, students would need to diagnose the problem, propose a solution, and execute the
solution. In addition, the students need to understand how something (a procedure or device)
works, know the features for the task, and be able to create a representation.
3
Students showed the highest score on question X402Q02T, which was a closed-
constructed response question and system analysis and design problem. For this type of question
students would need to know how relationships among many variables worked, identify the
features, create or apply a representation, and create a system to achieve certain goals.
PISA Post-test Results
Student
X402Q01T
X402Q02T
X412Q01
X412Q02
X412Q03
X414Q01
X415Q01T
X417Q01
X423Q01T
X423Q02T
X430Q01
X430Q02
X601Q01T
X601Q02
X602Q01
X602Q02
X603Q01
X603Q02T
X603Q03
Total
1 1 3 1 1 2 0 0 1 0 0 1 2 2 1 1 2 1 1 1 21
2 1 2 1 1 2 2 1 1 0 0 1 0 0 0 1 2 1 1 1 18
3 1 0 1 0 0 0 0 1 0 1 1 0 2 0 1 1 1 0 0 10
4 1 0 0 1 0 2 0 1 0 1 1 2 2 1 1 0 1 0 1 15
5 1 3 1 1 1 2 1 1 0 0 1 0 2 1 1 2 1 1 1 21
7 1 2 0 1 1 0 1 2 0 0 1 1 2 0 0 2 1 1 1 17
8 1 0 0 0 0 1 0 0 0 0 1 0 0 0 0 0 1 0 0 4
9 1 2 0 0 0 0 1 2 1 1 1 2 2 1 0 2 1 1 1 19
10 1 2 0 1 0 0 1 0 0 0 0 0 1 1 0 0 1 0 1 9
11 1 3 0 0 2 0 0 0 1 0 1 1 1 0 0 0 1 1 0 12
12 1 0 1 0 1 2 0 0 0 0 1 1 2 1 1 0 1 1 1 14
13 1 0 0 0 0 0 1 0 0 1 0 0 2 1 0 0 1 1 1 9
14 1 3 1 1 2 0 1 2 1 1 1 2 0 1 1 2 1 1 1 23
15 1 0 0 0 2 2 1 2 0 0 1 2 2 1 1 0 1 1 1 18
16 1 3 1 1 1 2 1 1 0 0 1 0 2 1 1 2 1 0 1 20
17 1 2 1 1 0 1 0 0 0 0 1 1 0 0 0 0 1 1 1 11
18 1 0 1 1 0 2 1 1 0 1 1 1 0 1 0 2 1 1 0 15
19 1 3 0 1 0 0 0 1 0 0 1 0 2 1 1 2 1 1 1 16
21 1 2 1 1 2 2 1 0 1 0 1 1 2 1 1 2 1 1 0 21
Total 19 30 10 12 16 18 11 16 4 6 17 16 26 13 11 21 19 14 14
Question
Type
SA&D
SA&D
SA&D
SA&D
SA&D
SA&D
DM
SA&D
TS
TS
DM
DM
DM
DM
DM
DM
TS
TS
TS
Legend
SA&D: System Analysis and Design Highest score
DM: Decision-making Low score
TS: Troubleshooting Lowest score
To determine test reliability the Spearman-Brown formula was computed (see the table
below). The results of the formula were calculated to be 0.81, which seems to be fairly reliable.
4
To be considered highly reliable the test would have to be 1.0, so while this result is close to that
point there could still be areas for improvement. To increase reliability in the test, more time
could have been given to activities such as troubleshooting to build up student awareness or
knowledge. However, the test is reliable because it shows that the students were provided with
the proper information to complete tasks. The instructors provided the right types of activities to
accomplish set out goals and objectives for students to succeed in the program.
Spearman-Brown formula
Student
Half-test scores
Computing correlation between
halves
Odd Items Even Items z-scores for: Product
(1,3,5,7,9, 11, 13, 15,
17 & 19)
(2, 4, 6, 8, 10, 12, 14, 16, &
18)
Odd Even (z₀ x zₑ)
1 10 11 -1.0417 -1.0167 1.0590
2 9 9 -0.5814 -0.4034 0.2346
3 7 3 0.3392 1.4362 0.4871
4 7 8 0.3392 -0.0968 -0.0328
5 10 11 -1.0417 -1.0167 1.0590
7 8 9 -0.1211 -0.4034 0.0489
8 3 1 2.1803 2.0495 4.4683
9 8 11 -0.1211 -1.0167 0.1231
10 5 4 1.2597 1.1296 1.4230
11 7 5 0.3392 0.8230 0.2791
12 9 5 -0.5814 0.8230 -0.4785
13 6 3 0.7994 1.4362 1.1482
14 10 13 -1.0417 -1.6299 1.6978
15 10 8 -1.0417 -0.0968 0.1009
16 10 10 -1.0417 -0.7100 0.7396
17 5 6 1.2597 0.5164 0.6505
18 5 10 1.2597 -0.7100 -0.8944
19 7 9 0.3392 -0.4034 -0.1368
21 11 10 -1.5020 -0.7100 1.0665
Mean 7.7368 7.6842 13.0430
SD 2.1726 3.2615
Rnn 0.6865
Rel 0.8141
5
Section 4: Student Analysis
To further understand the results of the data, one can look at student strengths and
weaknesses on the PISA assessment. All students showed growth from the beginning of the
program to the end of the program. According to the results, students showed the most strength
and growth with system analysis and design, and decision-making type problems. The weakness
or difficulty for most students lied within open-constructed response questions and
troubleshooting type problems that were multiple-choice. Students may have scored lower on
open-constructed response questions because they were not sure of how to apply the information
they learned into answering the questions without assistance like answer choices. Students may
have scored lower in troubleshooting due to the lack of instruction for this activity. Students only
received one session on troubleshooting during the Game Design and Learning program,
whereas for game-design and problem-solving activities, students had three sessions each.
Students also had two sessions of free-design in which they were able to create, plan, and
program their own games using the skills they learned. For additional understanding of students’
strengths and weaknesses in the assessment, one could look at each individual students’ abilities
on the assessment (see the table below).
Student Strength Weakness
1 System analysis & design
Troubleshooting: Multiple Choice
Open-constructed Response
2 System analysis & design Troubleshooting: Multiple choice
3 No defined strength
Troubleshooting: Multiple choice and open-
constructed response
4 Decision-making Troubleshooting
5
System analysis & design
Decision-making
Troubleshooting: Multiple choice
7 System analysis & design Troubleshooting: Multiple choice
8 No defined strength
Lowest scoring student
All problem types and item formats
9
Decision-making
Troubleshooting
Multiple choice
Open-constructed response
10 No defined strength
All item formats especially Open-constructed
response
11
System analysis & design: Open
constructed response
Decision-making
Troubleshooting
Multiple-choice
12 No defined strength
Open-constructed response
Troubleshooting
13 Scored the most credit in troubleshooting Scored the least credit in system analysis & design
6
14
Scored the highest total of all students
Scored full credit on a system analysis &
design: open-constructed response
No defined weakness
15 Decision making Troubleshooting: Multiple choice
16
Full credit on a System analysis &
design: open-constructed response
Troubleshooting: Multiple choice
17 No defined strength
Decision-making: open-constructed response
Troubleshooting: Multiple-choice
18 No defined strength No defined weakness
19
Full credit on a System analysis &
design: open-constructed response
Open-constructed response
21
Received most partial credit with System
analysis & design
No defined weakness
Section 5: Improvement Plan
Based on the results of the data analysis to provide better instruction or improvement
there are a few suggestions that could be made to improve the program. After an analysis of
student strengths and weaknesses, a majority of the students’ weaknesses were in
troubleshooting and open-ended response questions. A suggestion for troubleshooting activities
could be to provide more sessions, time, or real-world scenarios for instruction on this topic. For
open-constructed response questions more time could also be taken to prepare students for these
types of questions. Although the program is only for 10 days and it is not about the types of
question formats, it could be useful to activate students’ prompting them to answer open-ended
questions more often whether orally or written to prepare them for open-response questions on
the assessment. Another suggestion for improvement could be to check, revise, or reword
questions on the assessment for better student understanding (i.e., troubleshooting: multiple-
choice).
Lastly, a suggestion for improvement could be to reevaluate the GDL program as a
whole. The instructors or whomever created the program could look for ways to improve or
change the program to better meet the needs of the students: whether through instruction or
activities. Students could be given a survey at the end to evaluate the program, and the creators
could use this information to improve parts of the program.
All in all, no program, test, or assessment is ever 100% reliable. After completion of the
data analysis, the program as a whole was determined to be fairly reliable with a reliability
7
quotient of 0.81 using the Spear-Brown calculations. This number shows that there is some need
of improvement in the program although the changes would not have to be drastic.

Data Analysis

  • 1.
    1 Ashley Miller FRIT 7236 Dr.Akcaoglu Key Assessment:Stage 2 Data Analysis Section 1: Students The students for the analysis were self-selected participants in a summer program about Game Design & Learning. There were 21 students that participated in the program; 13 males and eight female students. These students are from middle or upper-class families in Istanbul, Turkey. They attend a private middle school and are in grades sixth through eighth, with an average age range of 12.6. None of the students have any prior knowledge in game-design. Section 2: Course The course is the Game Design and Learning program offered to middle school students for 10 days in a summer program. The program was created with two goals in mind: (1) to teach students how to create digital games and use basic computer programming skills, and (2) solve complex problems. To reach these goals, four types of activities were offered to the students: (1) game-design, (2) problem-solving, (3) troubleshooting, and (4) free-design. Although the program consisted of two goals, the main objective or purpose of the course was to measure the impact game design would have on students’ problem-solving skills. To enable this measurement an assessment was prepared by The Program for International Student Assessment (PISA). Section 3: Descriptive Analysis The assessment instrument created by PISA evaluated students’ abilities to solve three types of problems: system analysis and design, troubleshooting, and decision-making. The measuring instrument consisted of 19 multiple-choice and short answer questions highlighting the three types of problems in real-world scenarios and situations. Students participating in the program were given both a pre- and post-test to gauge learning over the 10 day program.
  • 2.
    2 For this analysisthe main focus of results is from the posttest, however, to determine any growth the pretest has also been evaluated. The data statistics show that the student mean or average for the pretest was 10.68. The median test score was 10. As for the posttest the student mean or average was 15.42. The median test score was 16. These results between the pre- and posttest shows that the students made growth throughout the program; the means or average scores raised by at least 5 points. The standard deviation of the students’ overall achievement for both the pretest and posttest was around 5.01-5.04, this shows that the values of the students’ achievement does not vary greatly since the value is not high. Test Statistics Student Pretest Total Post-Test Total 1 17 21 2 15 18 3 3 10 4 12 15 5 17 21 7 8 17 8 0 4 9 17 19 10 7 9 11 9 12 12 8 14 13 5 9 14 13 23 15 15 18 16 16 20 17 10 11 18 6 15 19 16 16 21 9 21 Mean 10.68421053 15.42105263 Median 10 16 Std. Dev. 5.037257311 5.008579896 Correlation 0.802165028 As for item difficulty (see table below), the students’ results from the post test show that students had the most difficulty with questions X423Q01T and X423Q02T. Both of these questions were multiple-choice and trouble-shooting problem types. For this problem type of question, students would need to diagnose the problem, propose a solution, and execute the solution. In addition, the students need to understand how something (a procedure or device) works, know the features for the task, and be able to create a representation.
  • 3.
    3 Students showed thehighest score on question X402Q02T, which was a closed- constructed response question and system analysis and design problem. For this type of question students would need to know how relationships among many variables worked, identify the features, create or apply a representation, and create a system to achieve certain goals. PISA Post-test Results Student X402Q01T X402Q02T X412Q01 X412Q02 X412Q03 X414Q01 X415Q01T X417Q01 X423Q01T X423Q02T X430Q01 X430Q02 X601Q01T X601Q02 X602Q01 X602Q02 X603Q01 X603Q02T X603Q03 Total 1 1 3 1 1 2 0 0 1 0 0 1 2 2 1 1 2 1 1 1 21 2 1 2 1 1 2 2 1 1 0 0 1 0 0 0 1 2 1 1 1 18 3 1 0 1 0 0 0 0 1 0 1 1 0 2 0 1 1 1 0 0 10 4 1 0 0 1 0 2 0 1 0 1 1 2 2 1 1 0 1 0 1 15 5 1 3 1 1 1 2 1 1 0 0 1 0 2 1 1 2 1 1 1 21 7 1 2 0 1 1 0 1 2 0 0 1 1 2 0 0 2 1 1 1 17 8 1 0 0 0 0 1 0 0 0 0 1 0 0 0 0 0 1 0 0 4 9 1 2 0 0 0 0 1 2 1 1 1 2 2 1 0 2 1 1 1 19 10 1 2 0 1 0 0 1 0 0 0 0 0 1 1 0 0 1 0 1 9 11 1 3 0 0 2 0 0 0 1 0 1 1 1 0 0 0 1 1 0 12 12 1 0 1 0 1 2 0 0 0 0 1 1 2 1 1 0 1 1 1 14 13 1 0 0 0 0 0 1 0 0 1 0 0 2 1 0 0 1 1 1 9 14 1 3 1 1 2 0 1 2 1 1 1 2 0 1 1 2 1 1 1 23 15 1 0 0 0 2 2 1 2 0 0 1 2 2 1 1 0 1 1 1 18 16 1 3 1 1 1 2 1 1 0 0 1 0 2 1 1 2 1 0 1 20 17 1 2 1 1 0 1 0 0 0 0 1 1 0 0 0 0 1 1 1 11 18 1 0 1 1 0 2 1 1 0 1 1 1 0 1 0 2 1 1 0 15 19 1 3 0 1 0 0 0 1 0 0 1 0 2 1 1 2 1 1 1 16 21 1 2 1 1 2 2 1 0 1 0 1 1 2 1 1 2 1 1 0 21 Total 19 30 10 12 16 18 11 16 4 6 17 16 26 13 11 21 19 14 14 Question Type SA&D SA&D SA&D SA&D SA&D SA&D DM SA&D TS TS DM DM DM DM DM DM TS TS TS Legend SA&D: System Analysis and Design Highest score DM: Decision-making Low score TS: Troubleshooting Lowest score To determine test reliability the Spearman-Brown formula was computed (see the table below). The results of the formula were calculated to be 0.81, which seems to be fairly reliable.
  • 4.
    4 To be consideredhighly reliable the test would have to be 1.0, so while this result is close to that point there could still be areas for improvement. To increase reliability in the test, more time could have been given to activities such as troubleshooting to build up student awareness or knowledge. However, the test is reliable because it shows that the students were provided with the proper information to complete tasks. The instructors provided the right types of activities to accomplish set out goals and objectives for students to succeed in the program. Spearman-Brown formula Student Half-test scores Computing correlation between halves Odd Items Even Items z-scores for: Product (1,3,5,7,9, 11, 13, 15, 17 & 19) (2, 4, 6, 8, 10, 12, 14, 16, & 18) Odd Even (z₀ x zₑ) 1 10 11 -1.0417 -1.0167 1.0590 2 9 9 -0.5814 -0.4034 0.2346 3 7 3 0.3392 1.4362 0.4871 4 7 8 0.3392 -0.0968 -0.0328 5 10 11 -1.0417 -1.0167 1.0590 7 8 9 -0.1211 -0.4034 0.0489 8 3 1 2.1803 2.0495 4.4683 9 8 11 -0.1211 -1.0167 0.1231 10 5 4 1.2597 1.1296 1.4230 11 7 5 0.3392 0.8230 0.2791 12 9 5 -0.5814 0.8230 -0.4785 13 6 3 0.7994 1.4362 1.1482 14 10 13 -1.0417 -1.6299 1.6978 15 10 8 -1.0417 -0.0968 0.1009 16 10 10 -1.0417 -0.7100 0.7396 17 5 6 1.2597 0.5164 0.6505 18 5 10 1.2597 -0.7100 -0.8944 19 7 9 0.3392 -0.4034 -0.1368 21 11 10 -1.5020 -0.7100 1.0665 Mean 7.7368 7.6842 13.0430 SD 2.1726 3.2615 Rnn 0.6865 Rel 0.8141
  • 5.
    5 Section 4: StudentAnalysis To further understand the results of the data, one can look at student strengths and weaknesses on the PISA assessment. All students showed growth from the beginning of the program to the end of the program. According to the results, students showed the most strength and growth with system analysis and design, and decision-making type problems. The weakness or difficulty for most students lied within open-constructed response questions and troubleshooting type problems that were multiple-choice. Students may have scored lower on open-constructed response questions because they were not sure of how to apply the information they learned into answering the questions without assistance like answer choices. Students may have scored lower in troubleshooting due to the lack of instruction for this activity. Students only received one session on troubleshooting during the Game Design and Learning program, whereas for game-design and problem-solving activities, students had three sessions each. Students also had two sessions of free-design in which they were able to create, plan, and program their own games using the skills they learned. For additional understanding of students’ strengths and weaknesses in the assessment, one could look at each individual students’ abilities on the assessment (see the table below). Student Strength Weakness 1 System analysis & design Troubleshooting: Multiple Choice Open-constructed Response 2 System analysis & design Troubleshooting: Multiple choice 3 No defined strength Troubleshooting: Multiple choice and open- constructed response 4 Decision-making Troubleshooting 5 System analysis & design Decision-making Troubleshooting: Multiple choice 7 System analysis & design Troubleshooting: Multiple choice 8 No defined strength Lowest scoring student All problem types and item formats 9 Decision-making Troubleshooting Multiple choice Open-constructed response 10 No defined strength All item formats especially Open-constructed response 11 System analysis & design: Open constructed response Decision-making Troubleshooting Multiple-choice 12 No defined strength Open-constructed response Troubleshooting 13 Scored the most credit in troubleshooting Scored the least credit in system analysis & design
  • 6.
    6 14 Scored the highesttotal of all students Scored full credit on a system analysis & design: open-constructed response No defined weakness 15 Decision making Troubleshooting: Multiple choice 16 Full credit on a System analysis & design: open-constructed response Troubleshooting: Multiple choice 17 No defined strength Decision-making: open-constructed response Troubleshooting: Multiple-choice 18 No defined strength No defined weakness 19 Full credit on a System analysis & design: open-constructed response Open-constructed response 21 Received most partial credit with System analysis & design No defined weakness Section 5: Improvement Plan Based on the results of the data analysis to provide better instruction or improvement there are a few suggestions that could be made to improve the program. After an analysis of student strengths and weaknesses, a majority of the students’ weaknesses were in troubleshooting and open-ended response questions. A suggestion for troubleshooting activities could be to provide more sessions, time, or real-world scenarios for instruction on this topic. For open-constructed response questions more time could also be taken to prepare students for these types of questions. Although the program is only for 10 days and it is not about the types of question formats, it could be useful to activate students’ prompting them to answer open-ended questions more often whether orally or written to prepare them for open-response questions on the assessment. Another suggestion for improvement could be to check, revise, or reword questions on the assessment for better student understanding (i.e., troubleshooting: multiple- choice). Lastly, a suggestion for improvement could be to reevaluate the GDL program as a whole. The instructors or whomever created the program could look for ways to improve or change the program to better meet the needs of the students: whether through instruction or activities. Students could be given a survey at the end to evaluate the program, and the creators could use this information to improve parts of the program. All in all, no program, test, or assessment is ever 100% reliable. After completion of the data analysis, the program as a whole was determined to be fairly reliable with a reliability
  • 7.
    7 quotient of 0.81using the Spear-Brown calculations. This number shows that there is some need of improvement in the program although the changes would not have to be drastic.