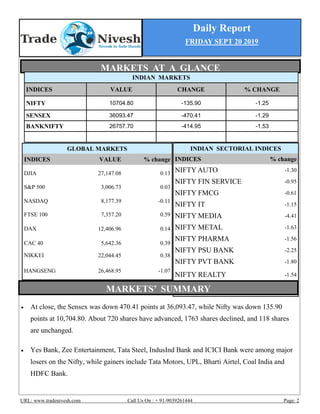
- The Sensex and Nifty indices closed down over 1% on Friday due to losses in Yes Bank, Zee Entertainment, Tata Steel, IndusInd Bank and ICICI Bank.
- The Nifty Media sector fell the most, over 4%, dragged down by Zee Entertainment and Dish TV which fell over 7% each. The PSU Bank index also shed 2%.
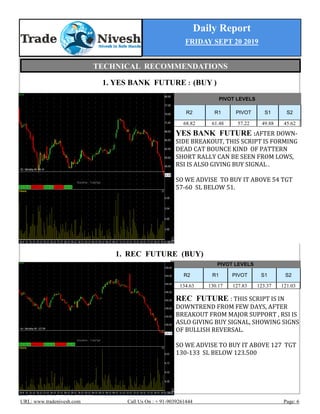
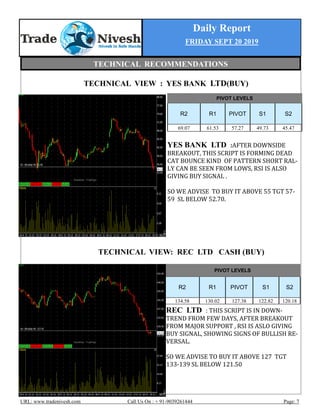
- Among recommendations were buying Yes Bank and REC futures based on technical indicators showing signs of a potential short-term bullish reversal.