The document is a daily market report from November 8, 2019 published by www.tradenivesh.com. It includes the following key information:
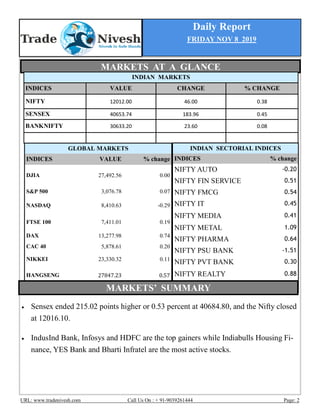
- Indian equity indices ended higher led by gains in Infosys and HDFC. The Sensex closed up 0.53% and the Nifty ended up 0.38%.
- Top gainers were IndusInd Bank, Infosys and HDFC while top losers were UPL, YES Bank and GAIL.
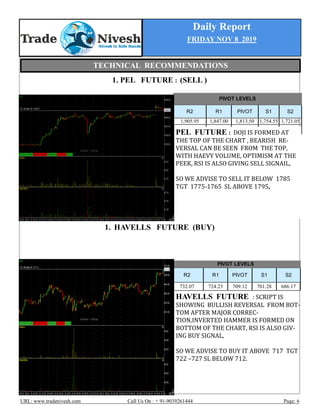
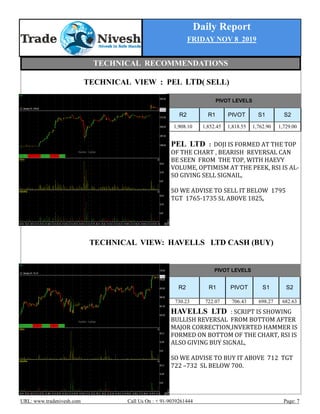
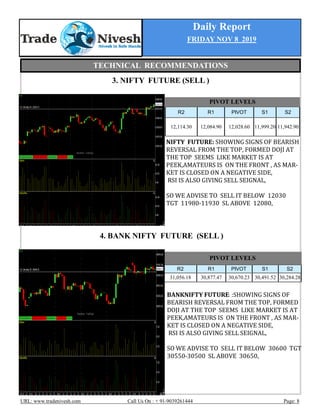
- Technical recommendations were given to sell Nifty futures below 12,030 and Bank Nifty futures below 30,600. PEL futures were recommended to sell below 1,785 while Havells futures were recommended to buy above 717.