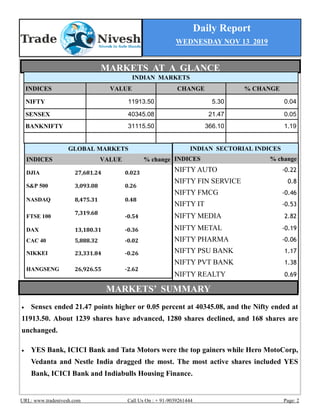
- The daily report summarizes Indian and global market performance from the previous day. Key Indian indices like the Sensex and Nifty ended slightly higher while most global indices fell.
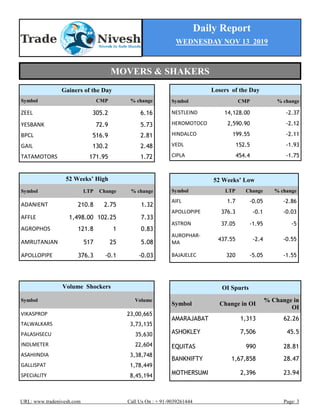
- In the Indian market, YES Bank, ICICI Bank and Tata Motors were the top gainers. Hero MotoCorp, Vedanta and Nestle India declined the most.
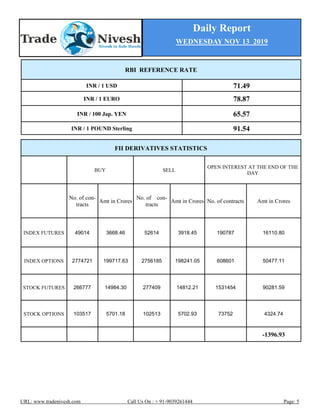
- The report provides technical recommendations and analysis for particular stocks and indices in the futures and cash segments, with entry, target and stop loss levels. It also reviews the previous day's calls and their performance.