Download to read offline
![_____________________________________________________________________________________________________________________
Please refer to disclaimer Epic Research Ltd w w w . e p i c r e s e a r c h . c o
Special Report
09-May-2018
Global markets at a glance
Wall Street cut losses to end little changed on Tuesday
while energy stocks rallied after US President Donald
Trump said the United States would quit the Iran nuclear
deal, confirming what many investors had expected.
In a televised speech, Trump said the United States would
withdraw from a 2015 international agreement designed to
deny Tehran the ability to build nuclear weapons, and also
reinstate sanctions on Iran.
The S&P energy sector erased earlier losses to end the day
up 0.78 percent as oil prices reduced earlier declines on
bets that the sanctions would disrupt global crude supplies.
Asian shares crept higher on Monday after a tame reading
on US wages lessened the risk of faster rate hikes by the
Federal Reserve, although Sino-US trade tensions and a
looming deadline for the Iranian nuclear deal argued for
caution.
The week ahead also has important readings on the health
of the Chinese economy, and hence global demand, as well
as the latest data on US consumer price inflation.The early
action was limited with MSCI’s broadest index of Asia-
Pacific shares outside Japan up 0.2 percent.
Japan's Nikkei was flat, while Australian stocks added 0.3
percent. E-Mini futures for the S&P 500 also inched up 0.2
percent.
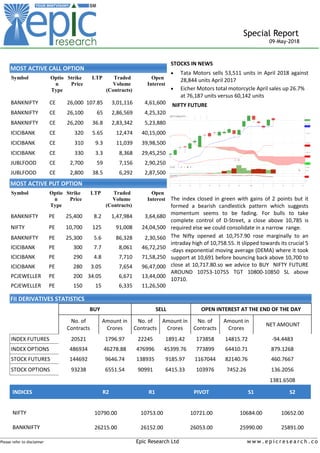
Previous day Roundup
The index closed in green with gains of 2 points but it
formed a bearish candlestick pattern which suggests
momentum seems to be fading. For bulls to take complete
control of D-Street, a close above 10,785 is required else
we could consolidate in a narrow range.
The Nifty opened at 10,757.90 rose marginally to an
intraday high of 10,758.55. It slipped towards its crucial 5-
days exponential moving average (DEMA) where it took
support at 10,691 before bouncing back above 10,700 to
close at 10,717.80.
India VIX moved up by 2.14 percent at 14.05. On the
options front, maximum Put OI is placed at 10,500 followed
by 10,600 strikes while maximum Call OI is placed at 11,000
followed by 10,800 strikes.
Index stats
The Market was very volatile in last session. The sartorial in
dices performed as follow; Commodities[9.80],
Consumption[-15.00pts],PSE[25.60pts],CPSE[5.80
pts],Energy[17.50pts],FMCG[ -31.35pts],Auto[-
52.40pts],Pharma[-21.15pts],IT[-45.25pts],Metal[-
6.85pts],Realty[3.70 pts], Fin Serv sector[ 50.95 pts].
World Indices
Index Value % Change
DJI 24,360.21 0.01
S&P500 2,670.00 0.22
NASDAQ 7,266.90 0.22
FTSE100 7,565.75 -0.02
NIKKEI 22,428.14 -0.36
HANG SENG 30,533.81 0.34
Top Gainers
Company CMP Change % Chg
ICICI Bank 309.30 19.50 6.73
HPCL 307.00 10.00 3.37
Eicher Motors 30,427.05 660.20 2.22
BPCL 392.60 6.80 1.76
Power Grid Corp 212.75 3.45 1.65
Top Losers
Company CMP Change % Chg
M&M 865.30 -20.30 -2.29
Idea Cellular 61.15 -1.25 -2.00
Larsen 1,364.90 -24.25 -1.75
Infosys 1,165.55 -17.45 -1.48
Bajaj Finance 1,868.40 -27.05 -1.43
Stocks at 52 Week’s HIGH
Symbol Prev. Close Change %Chg
5PAISA 486.85 -6.55 -1.35
AHLUCONT 425.1 -2.6 -0.61
ASHOKLEY 165.35 0 0
ASTERDM 178.75 7.9 4.42
ASTRAL 960 10 1.04
BOMDYEING 310.25 3.45 1.11
CUB 186.05 3.1 1.67
ARVSMART
Indian Indices
Company CMP Change % Chg
NIFTY 10717.80 2.30 0.02
SENSEX 35216.32 8.18 0.02
Stocks at 52 Week’s LOW
Symbol Prev. Close Change %Chg
A2ZINFRA 25.6 -0.55 -2.15
ADHUNIK 3.35 0 0
ADROITINFO 30.15 -0.85 -2.82](https://image.slidesharecdn.com/special-report-09-may-2018-epic-research-180509051946/85/Special-report-09-may-2018-epic-research-1-320.jpg)
![_____________________________________________________________________________________________________________________
Please refer to disclaimer Epic Research Ltd w w w . e p i c r e s e a r c h . c o
Special Report
09-May-2018
Global markets at a glance
Wall Street cut losses to end little changed on Tuesday
while energy stocks rallied after US President Donald
Trump said the United States would quit the Iran nuclear
deal, confirming what many investors had expected.
In a televised speech, Trump said the United States would
withdraw from a 2015 international agreement designed to
deny Tehran the ability to build nuclear weapons, and also
reinstate sanctions on Iran.
The S&P energy sector erased earlier losses to end the day
up 0.78 percent as oil prices reduced earlier declines on
bets that the sanctions would disrupt global crude supplies.
Asian shares crept higher on Monday after a tame reading
on US wages lessened the risk of faster rate hikes by the
Federal Reserve, although Sino-US trade tensions and a
looming deadline for the Iranian nuclear deal argued for
caution.
The week ahead also has important readings on the health
of the Chinese economy, and hence global demand, as well
as the latest data on US consumer price inflation.The early
action was limited with MSCI’s broadest index of Asia-
Pacific shares outside Japan up 0.2 percent.
Japan's Nikkei was flat, while Australian stocks added 0.3
percent. E-Mini futures for the S&P 500 also inched up 0.2
percent.
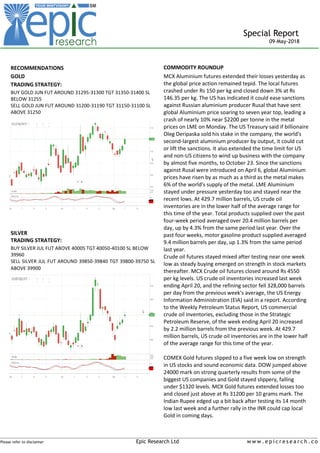
Previous day Roundup
The index closed in green with gains of 2 points but it
formed a bearish candlestick pattern which suggests
momentum seems to be fading. For bulls to take complete
control of D-Street, a close above 10,785 is required else
we could consolidate in a narrow range.
The Nifty opened at 10,757.90 rose marginally to an
intraday high of 10,758.55. It slipped towards its crucial 5-
days exponential moving average (DEMA) where it took
support at 10,691 before bouncing back above 10,700 to
close at 10,717.80.
India VIX moved up by 2.14 percent at 14.05. On the
options front, maximum Put OI is placed at 10,500 followed
by 10,600 strikes while maximum Call OI is placed at 11,000
followed by 10,800 strikes.
Index stats
The Market was very volatile in last session. The sartorial in
dices performed as follow; Commodities[9.80],
Consumption[-15.00pts],PSE[25.60pts],CPSE[5.80
pts],Energy[17.50pts],FMCG[ -31.35pts],Auto[-
52.40pts],Pharma[-21.15pts],IT[-45.25pts],Metal[-
6.85pts],Realty[3.70 pts], Fin Serv sector[ 50.95 pts].
World Indices
Index Value % Change
DJI 24,360.21 0.01
S&P500 2,670.00 0.22
NASDAQ 7,266.90 0.22
FTSE100 7,565.75 -0.02
NIKKEI 22,428.14 -0.36
HANG SENG 30,533.81 0.34
Top Gainers
Company CMP Change % Chg
ICICI Bank 309.30 19.50 6.73
HPCL 307.00 10.00 3.37
Eicher Motors 30,427.05 660.20 2.22
BPCL 392.60 6.80 1.76
Power Grid Corp 212.75 3.45 1.65
Top Losers
Company CMP Change % Chg
M&M 865.30 -20.30 -2.29
Idea Cellular 61.15 -1.25 -2.00
Larsen 1,364.90 -24.25 -1.75
Infosys 1,165.55 -17.45 -1.48
Bajaj Finance 1,868.40 -27.05 -1.43
Stocks at 52 Week’s HIGH
Symbol Prev. Close Change %Chg
5PAISA 486.85 -6.55 -1.35
AHLUCONT 425.1 -2.6 -0.61
ASHOKLEY 165.35 0 0
ASTERDM 178.75 7.9 4.42
ASTRAL 960 10 1.04
BOMDYEING 310.25 3.45 1.11
CUB 186.05 3.1 1.67
ARVSMART
Indian Indices
Company CMP Change % Chg
NIFTY 10717.80 2.30 0.02
SENSEX 35216.32 8.18 0.02
Stocks at 52 Week’s LOW
Symbol Prev. Close Change %Chg
A2ZINFRA 25.6 -0.55 -2.15
ADHUNIK 3.35 0 0
ADROITINFO 30.15 -0.85 -2.82](https://image.slidesharecdn.com/special-report-09-may-2018-epic-research-180509051946/75/Special-report-09-may-2018-epic-research-1-2048.jpg)
![_____________________________________________________________________________________________________________________
Please refer to disclaimer Epic Research Ltd w w w . e p i c r e s e a r c h . c o
Special Report
09-May-2018
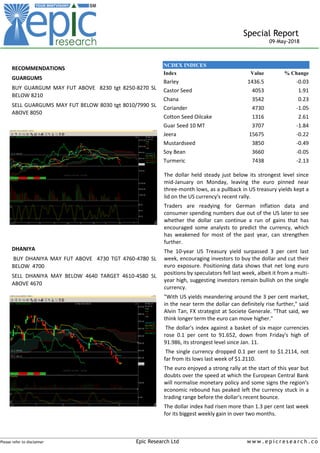
STOCK RECOMMENDATION [CASH]
NIITECH [CASH]
The particular script has rebounded from its support level
of 1006 and closed with a good volume since it has clsoed
above its previous day spinning top candle so we can
remark a good bullish sign so we advice you to BUY
NIITECH 1066 TGT 1076-1086 SL BELOW 1057.
MACRO NEW
Trends on SGX Nifty indicate a flat to positive opening
for the broader index in India, a rise of 10.5 points or
0.1 percent. Nifty futures were trading around 10,756-
level on the Singaporean Exchange.
ICICI Bank reported 49.6 percent year-on-year drop in
net profit at Rs 1,020 crore for the fourth quarter
ending March 2018. Net profit for Q4FY17 was Rs
2,024.60 crore. The results were in line with estimates.
A Reuters poll had estimated net profit at Rs 955.7
crore.NII or net interest income inched up marginally
to Rs 6,021.67 crore in the quarter from Rs 5,962 crore
a year ago.
Oil prices retreated from three-and-a-half-year highs
on Tuesday as investors waited on an announcement
by President Donald Trump on whether the United
States will reimpose sanctions on Iran.US West Texas
Intermediate crude futures fell 63 cents, or 0.9
percent, to USD 70.10 a barrel. Brent crude futures
were down 53 cents, or 0.7 percent, at USD 75.64,
having jumped 1.7 percent to settle at USD 76.17 a
barrel in the previous session.
BlackRock, the US-based investment management firm
is in the final stage of talks with DSP to exit the mutual
fund joint venture--DSP BlackRock Investment
Managers--and the announcement is likely to be made
shortly, sources told Moneycontrol. DSP BlackRock
Investment Managers is a 40:60 joint venture between
BlackRock and DSP Group. As of March 31, 2018, DSP
BlackRock Investment Managers managed assets
worth Rs 86,325 crore, with a 50:50 mix of equity and
debt.
RECOMMENDATIONS [FUTURE]
1.BPCL [FUTURE ]
The particular script has rebounded from its support level of
374 and can break its crucial resistance level of 397.50 ,now
it has closed with a good volume so today we can witness a
good breakout since its making double bottom price
pattern , so buy on high would be a good opportunity to
trade. Here we recommend you to buy BPCL FUTURE
around 397.9-398.5 tgt 404-410 sl below 392.50.
2.JETAIRWAYS [FUTURE]
This particular counter is continuosly maitaining its
downtrend , below 507 there is no support level so sell on
low wowuld be a good startegy to follow so we recommend
to sell PRABHAT BELOW 507 TGT 500-490 SL ABOVE 512.](https://image.slidesharecdn.com/special-report-09-may-2018-epic-research-180509051946/85/Special-report-09-may-2018-epic-research-2-320.jpg)

The report discusses recent market movements following President Trump's decision to withdraw from the Iran nuclear deal, leading to gains in energy stocks as oil prices stabilized. It highlights fluctuations in Asian markets and provides insights into the performance of Indian stocks, including recommendations for specific trades based on current trends, particularly in the banking and commodities sectors. Additionally, macroeconomic indicators and company earnings are examined, with guidance on future trading strategies.


