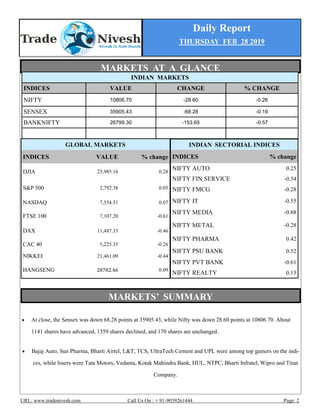
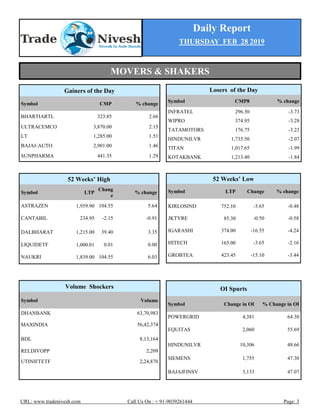
2. Daily Report
THURSDAY FEB 28 2019
URL: www.tradenivesh.com Call Us On : + 91-9039261444 Page: 2
GLOBAL MARKETS
INDICES VALUE % change
DJIA 25,985.16 0.28
S&P 500 2,792.38 0.05
NASDAQ 7,554.51 0.07
FTSE 100 7,107.20 -0.61
DAX 11,487.33 -0.46
CAC 40 5,225.35 -0.26
NIKKEI 21,461.09 -0.44
HANGSENG 28782.46 0.09
MARKETS AT A GLANCE
INDIAN MARKETS
INDICES VALUE CHANGE % CHANGE
NIFTY 10806.70 -28.60 -0.26
SENSEX 35905.43 -68.28 -0.19
BANKNIFTY 26799.30 -153.65 -0.57
INDIAN SECTORIAL INDICES
INDICES % change
NIFTY AUTO 0.25
NIFTY FIN SERVICE -0.54
NIFTY FMCG -0.28
NIFTY IT -0.55
NIFTY MEDIA -0.88
NIFTY METAL -0.28
NIFTY PHARMA 0.42
NIFTY PSU BANK 0.52
NIFTY PVT BANK -0.61
NIFTY REALTY 0.15
At close, the Sensex was down 68.28 points at 35905.43, while Nifty was down 28.60 points at 10806.70. About
1141 shares have advanced, 1359 shares declined, and 170 shares are unchanged.
Bajaj Auto, Sun Pharma, Bharti Airtel, L&T, TCS, UltraTech Cement and UPL were among top gainers on the indi-
ces, while losers were Tata Motors, Vedanta, Kotak Mahindra Bank, HUL, NTPC, Bharti Infratel, Wipro and Titan
Company.
MARKETS’ SUMMARY
3. Daily Report
THURSDAY FEB 28 2019
URL: www.tradenivesh.com Call Us On : + 91-9039261444 Page: 4
Metalyst Forgings: Board meeting is scheduled on February 28 to consider and approve and take on record
the unaudited financial results for the quarter and nine months ended December 2018.
ACC: Company's officials will meet investors on February 28.
Shanthi Gears: Company's officials will meet investors February 28.
Wockhardt: Meeting of Capital Raising Committee of the company will be held on March 19 to consider
and approve alteration/ extension of the date of redemption of 16,00,00,000 0.01% non-convertible cumula-
tive preference shares of face value of Rs 51 each held by Khorakiwala Holdings & Investments Private
Limited (Promoter Group Entity) to such date as may be decided at the said meeting.
Container Corporation of India: Company's officials will meet analysts/investors on March 4, 7 and 12, will
attend UBS India Midcap Conference 2019 on June 6.
Mahindra & Mahindra: Company's officials will meet analysts/investors on February 28, March 5, 8, 11, 12
and 14.
Mangalam Seeds: Migration of equity shares of company from BSE SME Platform to BSE Mainboard Plat-
form with effect from March 1.
IndusInd Bank - Credit ratings for debt securities issued by IndusInd Bank reaffirmed by CRISIL
DAILY NEWS
4. Daily Report
THURSDAY FEB 28 2019
URL: www.tradenivesh.com Call Us On : + 91-9039261444 Page: 3
Losers of the Day
Symbol CMP8 % change
INFRATEL 296.50 -3.73
WIPRO 374.95 -3.28
TATAMOTORS 176.75 -3.23
HINDUNILVR 1,735.50 -2.07
TITAN 1,017.65 -1.99
KOTAKBANK 1,213.40 -1.84
52 Weeks’ High
Symbol LTP
Chang
e
% change
ASTRAZEN 1,959.90 104.55 5.64
CANTABIL 234.95 -2.15 -0.91
DALBHARAT 1,215.00 39.40 3.35
LIQUIDETF 1,000.01 0.01 0.00
NAUKRI 1,839.00 104.55 6.03
52 Weeks’ Low
Symbol LTP Change % change
KIRLOSIND 752.10 -3.65 -0.48
JKTYRE 85.30 -0.50 -0.58
IGARASHI 374.00 -16.55 -4.24
HITECH 165.00 -3.65 -2.16
GROBTEA 423.45 -15.10 -3.44
Gainers of the Day
Symbol CMP % change
BHARTIARTL 323.85 2.66
ULTRACEMCO 3,870.00 2.15
LT 1,285.00 1.51
BAJAJ-AUTO 2,901.00 1.46
SUNPHARMA 441.35 1.29
OI Spurts
Symbol Change in OI % Change in OI
POWERGRID 4,381 64.30
EQUITAS 2,060 55.69
HINDUNILVR 10,306 48.66
SIEMENS 1,755 47.30
BAJAJFINSV 3,133 47.07
Volume Shockers
Symbol Volume
DHANBANK 63,70,983
MAXINDIA 56,42,374
BDL 8,13,164
RELDIVOPP 2,209
UTINIFTETF 2,24,870
MOVERS & SHAKERS
5. Daily Report
THURSDAY FEB 28 2019
URL: www.tradenivesh.com Call Us On : + 91-9039261444 Page: 5
SCRIPS IN BAN TODAY
FII DERIVATIVES STATISTICS
BUY SELL
OPEN INTEREST AT THE END OF THE
DAY
No. of con-
tracts
Amt in Crores
No. of con-
tracts
Amt in Crores No. of contracts Amt in Crores
INDEX FUTURES 134288 10100.20 129197 9643.82 406998 32022.52
INDEX OPTIONS 4022642 249985.16 4012946 249349.98 883251 65672.10
STOCK FUTURES 521096 31479.84 515320 31092.95 1576863 95047.88
STOCK OPTIONS 186130 10864.52 188112 10956.14 192658 11145.71
TOTAL -1386.83
RBI REFERENCE RATE
INR / 1 USD 71.16
INR / 1 EURO 80.96
INR / 100 Jap. YEN 64.38
INR / 1 POUND Sterling 94.21
SGX NIFTY (9:00am)
10865.70
MCX GOLD
33,260
USD/INR
71.14
ADANIENT
ADANIPOWER
RPOWER
6. Daily Report
THURSDAY FEB 28 2019
URL: www.tradenivesh.com Call Us On : + 91-9039261444 Page: 6
1. CANARA BANK FUTURE (BUY)
2. INDIGO FUTURE (BUY)
PIVOT LEVELS
R2 R1 PIVOT S1 S2
239.77 234.63 227.07 221.93 214.37
CANARA BANK FUTURE seems to come up-
side for this week, as the stock has been in
uptend in previous session ,it is bullish on
daily and weekly chart as stock has formed
bullish reversal pattern and confirming
upside movement. It is bullish on RSI is
also giving buy signal. So buy it above
230 for 231.50 and 235 with strict
stop loss of 228.
INDIGO FUTURE as the stock has been trad-
ing support level ,it is bullish on daily and
weekly chart after selling rally ,confirming
upside movement. It is bullish on RSI. So
buy it above 1110 for 1115 and 1130
with strict stop loss 1100.
PIVOT LEVELS
R2 R1 PIVOT S1 S2
1,174.10 1,139.05 1,109.15 1,074.10 1,044.20
TECHNICAL RECOMMENDATIONS
7. Daily Report
THURSDAY FEB 28 2019
URL: www.tradenivesh.com Call Us On : + 91-9039261444 Page: 7
TECHNICAL VIEW : CANARA BANK LTD (BUY)
TECHNICAL VIEW : INDIGO LTD CASH (BUY)
PIVOT LEVELS
R2 R1 PIVOT S1 S2
240.77 235.43 227.22 221.88 213.67
CANARA BANK LTD seems to come upside
for this week, as the stock has been in up
trend in previous session ,it is bullish on daily
and weekly chart and formed upside wave
pattern. RSI also giving buy signal and con-
firming bullish reversal . So buy it above 232
for 234 and 237 with strict stop loss of
230.
INDIGO LTD as the stock has been trading
support level ,it is bullish on daily and weekly
chart after selling rally ,confirming upside
movement. It is bullish on RSI is also giving
buy signal .So buy it above 1120 for 1130
and 1150 with strict stop loss 1110
PIVOT LEVELS
R2 R1 PIVOT S1 S2
1,172.45 1,138.40 1,108.35 1,074.30 1,044.25
TECHNICAL RECOMMENDATIONS
8. Daily Report
THURSDAY FEB 28 2019
URL: www.tradenivesh.com Call Us On : + 91-9039261444 Page: 8
3. NIFTY FUTURE (SELL)
4. BANK NIFTY FUTURE (BUY)
PIVOT LEVELS
R2 R1 PIVOT S1 S2
11,025.97 10,913.43 10,829.72 10,717.18 10,633.47
NIFTY FUTURE in trading session Nifty was -26.90
down Points to close at 10,800.90 , -0.25 per-
cent down than the previous day. Chances of
bearish phase is high as index is trading below tick
average price level in hourly and daily chart . So we
advise to sell it below 10810 for the target of
10780 and 10760 with strict stop loss of 10850.
BANKNIFTY FUTURE with movement of -
158.80 points .Nifty Bank down -0.59 per-
cent .Chances of bullish phase is high as index
closed above tick average price level . And over-
all sentiments of the market is in bullish phase .
So we advise to buy it above 26820 for the tar-
get of 26850 and 26880 with strict stop loss
26770.
PIVOT LEVELS
R2 R1 PIVOT S1 S2
27,376.90 27,087.15 26,905.25 26,615.50 26,433.60
TECHNICAL RECOMMENDATIONS
9. Daily Report
THURSDAY FEB 28 2019
URL: www.tradenivesh.com Call Us On : + 91-9039261444 Page: 9
PREVIOUS DAY’S PERFORMANCE
CALL SEGMENT ADVISE ENTRY TGT SL STATUS
NIFTY INDEX SELL 10810 10780 -10760 10850 FINAL TGT
BANKNIFTY INDEX BUY 26980 27010 -27040 26950 NOT EXECUTED
REC LTD CASH SELL 134 132-130 136.50 1ST TGT
DISHTV LTD CASH BUY 38 38.70-39.70 36.50 1ST TGT
REC FUTURE SELL 134 133.30-132.50 134.80 1ST TGT
DISHTV FUTURE BUY 38 38.70-39.70 37.30 1ST TGT
DISCLAIMER
This document is solely for the personal information of the recipient, and must not be singularly used as the basis of any
investment decision. Nothing in this document should be construed as investment or financial advice. Each recipient of
this document should make such investigations as they deem necessary to arrive at an independent evaluation of an in-
vestment in the securities of the companies referred to in this document including the merits and risks involved, and
should consult their own advisors to determine the merits and risks of such an investment. Reports based on technical
and derivative analysis center on studying charts of a stock's price movement, outstanding positions and trading vol-
ume. The information in this document has been printed on the basis of publicly available information, internal data and
other reliable sources believed to be true, but we do not represent that it is accurate or complete and it should not be
relied on as such, as this document is for general guidance only. Trade Nivesh shall not be in any way responsible for
any loss or damage that may arise.