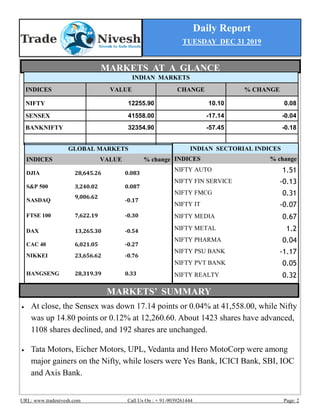
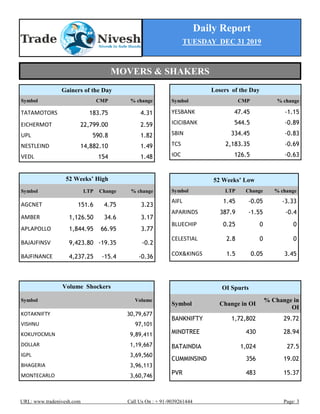
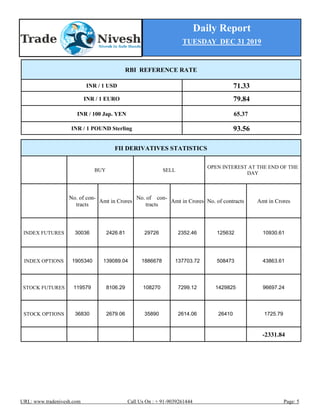
2. Daily Report
TUESDAY DEC 31 2019
URL: www.tradenivesh.com Call Us On : + 91-9039261444 Page: 2
At close, the Sensex was down 17.14 points or 0.04% at 41,558.00, while Nifty
was up 14.80 points or 0.12% at 12,260.60. About 1423 shares have advanced,
1108 shares declined, and 192 shares are unchanged.
Tata Motors, Eicher Motors, UPL, Vedanta and Hero MotoCorp were among
major gainers on the Nifty, while losers were Yes Bank, ICICI Bank, SBI, IOC
and Axis Bank.
GLOBAL MARKETS
INDICES VALUE % change
DJIA 28,645.26 0.083
S&P 500 3,240.02 0.087
NASDAQ
9,006.62
-0.17
FTSE 100 7,622.19 -0.30
DAX 13,265.30 -0.54
CAC 40 6,021.05 -0.27
NIKKEI 23,656.62 -0.76
HANGSENG 28,319.39 0.33
MARKETS AT A GLANCE
INDIAN MARKETS
INDICES VALUE CHANGE % CHANGE
NIFTY 12255.90 10.10 0.08
SENSEX 41558.00 -17.14 -0.04
BANKNIFTY 32354.90 -57.45 -0.18
INDIAN SECTORIAL INDICES
INDICES % change
NIFTY AUTO 1.51
NIFTY FIN SERVICE -0.13
NIFTY FMCG 0.31
NIFTY IT -0.07
NIFTY MEDIA 0.67
NIFTY METAL 1.2
NIFTY PHARMA 0.04
NIFTY PSU BANK -1.17
NIFTY PVT BANK 0.05
NIFTY REALTY 0.32
MARKETS’ SUMMARY
3. Daily Report
TUESDAY DEC 31 2019
URL: www.tradenivesh.com Call Us On : + 91-9039261444 Page: 4
Share price of Gateway Distriparks added 12 percent after the company decided to sell its entire stake
in Snowman Logistics.
Oricon Enterprises share price rose 5 percent after the company prepaid the term loan to Indiabulls
Housing Finance.
Skipper gained 9 percent after the company became the first company in India to have successfully
designed, fabricated and type tested a 765 KV S/C Monopole.
Punjab & Sind Bank share price shed 5 percent after CARE revised its rating outlook to negative
from stable
Bata India: Buy Bata India has retraced marginally after making a record high at 1,814 and is cur-
rently consolidating in a narrow range while holding firmly above the support zone of 100-Days EMA
on the daily chart.Indications are in the favor of a fresh breakout in the near future. We advise initi-
ating fresh longs as per the given levels.
Hindalco: Buy A falling channel breakout containing the last two years price action suggests the end
of a corrective phase and resumption of a fresh uptrend.The last week's consolidation has helped the
stock to work off the overbought condition in daily stochastic. We expect the recent breakout area of
210 will act as immediate support and the stock is expected to head towards 230 levels in the coming
weeks as it is the 80% retracement of the previous decline (245-171).
Manappuram Finance: Buy On the daily chart, the stock is sustaining above its daily breakout level
of 170 indicating bullish sentiments.The stock is sustaining above its 20, 50, 100-Days SMA which
supports upside rally. Daily and weekly indicators are in positive mode indicating strength ahead.
DAILY NEWS
4. Daily Report
TUESDAY DEC 31 2019
URL: www.tradenivesh.com Call Us On : + 91-9039261444 Page: 3
Losers of the Day
Symbol CMP % change
YESBANK 47.45 -1.15
ICICIBANK 544.5 -0.89
SBIN 334.45 -0.83
TCS 2,183.35 -0.69
IOC 126.5 -0.63
52 Weeks’ High
Symbol LTP Change % change
AGCNET 151.6 4.75 3.23
AMBER 1,126.50 34.6 3.17
APLAPOLLO 1,844.95 66.95 3.77
BAJAJFINSV 9,423.80 -19.35 -0.2
BAJFINANCE 4,237.25 -15.4 -0.36
52 Weeks’ Low
Symbol LTP Change % change
AIFL 1.45 -0.05 -3.33
APARINDS 387.9 -1.55 -0.4
BLUECHIP 0.25 0 0
CELESTIAL 2.8 0 0
COX&KINGS 1.5 0.05 3.45
Gainers of the Day
Symbol CMP % change
TATAMOTORS 183.75 4.31
EICHERMOT 22,799.00 2.59
UPL 590.8 1.82
NESTLEIND 14,882.10 1.49
VEDL 154 1.48
OI Spurts
Symbol Change in OI
% Change in
OI
BANKNIFTY 1,72,802 29.72
MINDTREE 430 28.94
BATAINDIA 1,024 27.5
CUMMINSIND 356 19.02
PVR 483 15.37
Volume Shockers
Symbol Volume
KOTAKNIFTY 30,79,677
VISHNU 97,101
KOKUYOCMLN 9,89,411
DOLLAR 1,19,667
IGPL 3,69,560
BHAGERIA 3,96,113
MONTECARLO 3,60,746
MOVERS & SHAKERS
5. Daily Report
TUESDAY DEC 31 2019
URL: www.tradenivesh.com Call Us On : + 91-9039261444 Page: 5
FII DERIVATIVES STATISTICS
BUY SELL
OPEN INTEREST AT THE END OF THE
DAY
No. of con-
tracts
Amt in Crores
No. of con-
tracts
Amt in Crores No. of contracts Amt in Crores
INDEX FUTURES 30036 2426.81 29726 2352.46 125632 10930.61
INDEX OPTIONS 1905340 139089.04 1886678 137703.72 508473 43863.61
STOCK FUTURES 119579 8106.29 108270 7299.12 1429825 96697.24
STOCK OPTIONS 36830 2679.06 35890 2614.06 26410 1725.79
-2331.84
RBI REFERENCE RATE
INR / 1 USD 71.33
INR / 1 EURO 79.84
INR / 100 Jap. YEN 65.37
INR / 1 POUND Sterling 93.56
6. Daily Report
TUESDAY DEC 31 2019
URL: www.tradenivesh.com Call Us On : + 91-9039261444 Page: 6
1 UPL FUTURE : (BUY )
1. BPCL FUTURE (BUY )
PIVOT LEVELS
R2 R1 PIVOT S1 S2
602.22 597.93 590.42 586.13 578.62
UPL FUTURE :IN DAILY CHARTS BULLISH
WIDE RANGE CANDELSTRICK PATTERN IS
FOMRED AND RANGE BREAKOUT GIVEN
LEVEL ABOVE 588 MAJOR SUPPORT LEVEL
578 AND MAJOR RESISTANCE LEVEL 500,
30 MIN CHARTS ROUDNING BOTTOM
BREAKOUT GIEVN ,RSI GIVES BUY SIG-
NALS .
BUY UPL IN FUTURE ABOVE 595 TGT
601/609 SL BELOW 488
BPCL FUTURE :IN DAILY CHARTS A BULL-
ISH HAMMER CANDELSTRICK PATTERN IS
FOMRED AND RANGE BREAKOUT WILL
GIVES ABOVE 495,MAJOR RESISTANCE LEV-
EL 500 AND MAJOR SUPPORT LEVEL
478 .AND DOUBLE BOTTOM FORMED
BREAK OUT LEVEL ABOVE 495 AT 30 MIN
CHARTS.
BUY BPCL IN FUTURE ABOVE 495 TGT
500/507 SL BELOW 489
PIVOT LEVELS
R2 R1 PIVOT S1 S2
504.88 499.42 491.98 486.52 479.08
TECHNICAL RECOMMENDATIONS
7. Daily Report
TUESDAY DEC 31 2019
URL: www.tradenivesh.com Call Us On : + 91-9039261444 Page: 7
TECHNICAL VIEW : BPCL LTD( BUY )
TECHNICAL VIEW: TATASTEEL LTD CASH (BUY )
PIVOT LEVELS
R2 R1 PIVOT S1 S2
502.87 497.78 489.72 484.63 476.57
BPCL LTD :IN DAILY CHARTS A BULLISH
HAMMER CANDELSTRICK PATTERN IS
FOMRED AND RANGE BREAKOUT WILL
GIVES ABOVE 495,MAJOR RESISTANCE LEV-
EL 500 AND MAJOR SUPPORT LEVEL
478 .AND DOUBLE BOTTOM FORMED
BREAK OUT LEVEL ABOVE 495 AT 30 MIN
CHARTS.
BUY BPCL IN CASH ABOVE 495 TGT
500/507 SL BELOW 489
TATASTEEL LTD : ITS UP TREND IN DAILY
CHARTS A BULLISH HAMMER CANDEL-
STRICK PATTERN IS FOMRED AND UP-
PER SIDE RANGE BREAKOUT WILL GIVES
ABOVE 475 ,AND 30 MIN CHARTS AT
DOUBLE BOTTOM BREAKOUT GIVEN ,RSI
GIVES BUY SIGNALS .
BUY TATASTEEL IN CASH ABOVE 475 TGT
480/485 SL BELOW 469
PIVOT LEVELS
R2 R1 PIVOT S1 S2
483.03 478.57 471.83 467.37 460.63
TECHNICAL RECOMMENDATIONS
8. Daily Report
TUESDAY DEC 31 2019
URL: www.tradenivesh.com Call Us On : + 91-9039261444 Page: 8
3. NIFTY FUTURE (BUY )
4. BANK NIFTY FUTURE (SELL )
PIVOT LEVELS
R2 R1 PIVOT S1 S2
12,390.80 12,361.60 12,318.80 12,289.60 12,246.80
NIFTY FUTURE: IN DAILY A CHARTS BULLISH
HAMMER CANDELSTRICK PATTERN FORMED
AND BULLISH FLAG PATTERN BREKAOUT GIV-
EN . AND MAJORS RESISTANCE LEVEL 12350
MAJOR SUPPORT LEVEL 12000 ,IF 12350 LEV-
EL BREAKOUT NIFTY WILL GOING UPPER
SIDES ,RSI IS BUY SIGNALS .
BUY NIFTY IN FUTURE ABOVE 12350 TGT
12440/12550 SL BELOW 12250
BANKNIFTY FUTURE: IN DAILYS CHARTS
SPIN TOP CANDELSTRICK PATTERN FOMRED
AND IN 30 MIN RANGE BREAKOUT LEVEL
32500 THE ITS WILL DOWN SIDE MAJORS
RESISTANCE LEVEL 32800 AND MAJORS
SUPPORT LEVEL 32500 , ,RSI IS SELL SIG-
NALS.
SELL BANK NIFTY FUTURE BELOW 32500
TGT 32400/32280 SL ABOVE 32610
PIVOT LEVELS
R2 R1 PIVOT S1 S2
32,928.67 32,740.63 32,585.82 32,397.78 32,242.97
TECHNICAL RECOMMENDATIONS
9. Daily Report
TUESDAY DEC 31 2019
URL: www.tradenivesh.com Call Us On : + 91-9039261444 Page: 9
PREVIOUS DAY’S PERFORMANCE
CALL
SEG-
MENT
ADVISE ENTRY TGT SL STATUS
NIFTY INDEX SELL
12320 12270-12220 12370
MAKE A LOW
12,276.00
BANKNIFTY INDEX SELL 32600 32500-32400 32700 HIT FIRST TGT
CANARA
BANK LTD
CASH BUY 225
228-231 222.
NOT EXECUTED
BANK BARO-
DA LTD
CASH SELL
103 101.50-100 104.50
MAKE LOW 102.05
CANARABANK FUTURE BUY 225
228-231 222.
SL TRG
BANK BARO-
DA
FUTURE SELL
103 101.50-100 104.50
MAKE LOW 102..65
DISCLAIMER
This document is solely for the personal information of the recipient, and must not be singularly used as the basis of any
investment decision. Nothing in this document should be construed as investment or financial advice. Each recipient of
this document should make such investigations as they deem necessary to arrive at an independent evaluation of an in-
vestment in the securities of the companies referred to in this document including the merits and risks involved, and
should consult their own advisors to determine the merits and risks of such an investment. Reports based on technical
and derivative analysis center on studying charts of a stock's price movement, outstanding positions and trading vol-
ume. The information in this document has been printed on the basis of publicly available information, internal data and
other reliable sources believed to be true, but we do not represent that it is accurate or complete and it should not be
relied on as such, as this document is for general guidance only. Trade Nivesh shall not be in any way responsible for
any loss or damage that may arise.