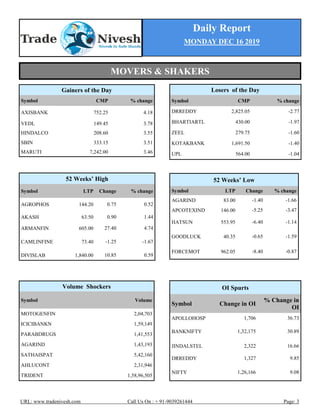
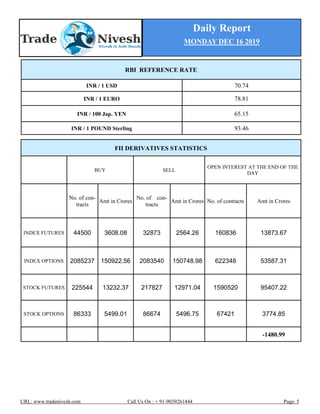
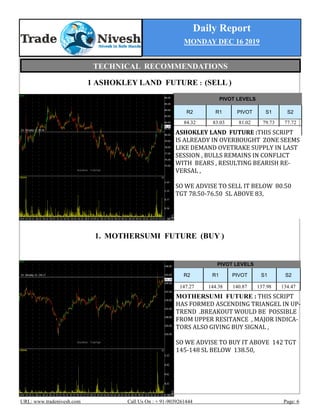
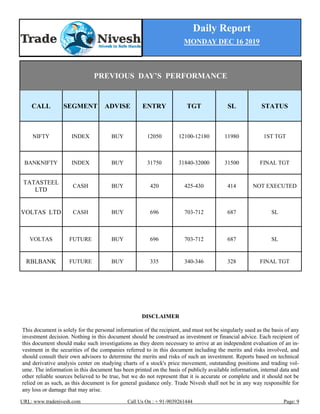
The document is a daily market report from www.tradenivesh.com dated December 16, 2019. It provides an overview of the performance of key stock indices in India and globally. It also summarizes news about top gaining and losing stocks in the Indian markets, as well as other market indicators such as open interest, volume, and futures prices. Technical recommendations are provided for certain stocks and indices to buy or sell.
1. Daily Report
MONDAY DEC 16 2019
URL: www.tradenivesh.com Call Us On : + 91-9039261444 Page: 1
2. Daily Report
MONDAY DEC 16 2019
URL: www.tradenivesh.com Call Us On : + 91-9039261444 Page: 2
At close, the Sensex was up 428 points or 1.05% at 41009.71, while Nifty was up 114.90
points or 0.96% at 12086.70. About 1518 shares have advanced, 981 shares declined, and 161
shares are unchanged.
Axis Bank, Vedanta, Coal India, Hindalco Industries and SBI were among major gainers on
the Nifty, while losers include Dr Reddys Laboratories, Bharti Airtel, Zee Entertainment, Ko-
tak Mahindra Bank and Bajaj Auto.
GLOBAL MARKETS
INDICES VALUE % change
DJIA 28,135.38 0.01
S&P 500 3,168.80 0.00
NASDAQ 8,734.88 0.20
FTSE 100 7,353.44 1.10
DAX 13,282.72 0.46
CAC 40 5,919.02 0.59
NIKKEI 24,023.10 2.55
HANGSENG 27,687.76 2.57
MARKETS AT A GLANCE
INDIAN MARKETS
INDICES VALUE CHANGE % CHANGE
NIFTY 12086.70 114.90 0.96
SENSEX 41009.71 428.00 1.05
BANKNIFTY 32014.30 348.80 1.10
INDIAN SECTORIAL INDICES
INDICES % change
NIFTY AUTO 1.61
NIFTY FIN SERVICE 0.82
NIFTY FMCG 0.66
NIFTY IT 1.52
NIFTY MEDIA 0.43
NIFTY METAL 2.26
NIFTY PHARMA 0.00
NIFTY PSU BANK 4.03
NIFTY PVT BANK 0.97
NIFTY REALTY 1.68
MARKETS’ SUMMARY
3. Daily Report
MONDAY DEC 16 2019
URL: www.tradenivesh.com Call Us On : + 91-9039261444 Page: 4
Nifty PSU Bank is the outperforming sector, up over 3 percent led by Union Bank of India, Punjab
National Bank, OBC, Canara Bank, State Bank of India, Bank of Baroda and Bank of India.
PSU banks gained the most on December 13 amid media reports which suggested that banks are
likely to get payments from Essar Steel resolution this month.
The Union Cabinet on Wednesday approved changes to the insolvency law, including a provision to
ring-fence successful resolution applicants from criminal proceedings with regard to offences com-
mitted by previous promoters of a company.
The top gainers included Vedanta, Tata Steel, Hindalco Industries, Coal India, SAIL, Hindustan
Copper and MOIL.
The top gainers from the Nifty index are Vedanta, Coal India, State Bank of India, Axis Bank and
Hindalco Industries while the top losers include Dr Reddy's Labs, Bharti Airtel, Kotak Mahindra
Bank, Zee Entertainment and Britannia Industries.
The most active stocks are Indiabulls Housing Finance, Tata Motors, TCS, Axis Bank and State
Bank of India.
The Finance Minister of India is to address media later today and the market is expecting some
fresh government measures to address the slowdown in the economy.
DAILY NEWS
4. Daily Report
MONDAY DEC 16 2019
URL: www.tradenivesh.com Call Us On : + 91-9039261444 Page: 3
Losers of the Day
Symbol CMP % change
DRREDDY 2,825.05 -2.77
BHARTIARTL 430.00 -1.97
ZEEL 279.75 -1.60
KOTAKBANK 1,691.50 -1.40
UPL 564.00 -1.04
52 Weeks’ High
Symbol LTP Change % change
AGROPHOS 144.20 0.75 0.52
AKASH 63.50 0.90 1.44
ARMANFIN 605.00 27.40 4.74
CAMLINFINE 73.40 -1.25 -1.67
DIVISLAB 1,840.00 10.85 0.59
52 Weeks’ Low
Symbol LTP Change % change
AGARIND 83.00 -1.40 -1.66
APCOTEXIND 146.00 -5.25 -3.47
HATSUN 553.95 -6.40 -1.14
GOODLUCK 40.35 -0.65 -1.59
FORCEMOT 962.05 -8.40 -0.87
Gainers of the Day
Symbol CMP % change
AXISBANK 752.25 4.18
VEDL 149.45 3.78
HINDALCO 208.60 3.55
SBIN 333.15 3.51
MARUTI 7,242.00 3.46
OI Spurts
Symbol Change in OI
% Change in
OI
APOLLOHOSP 1,706 36.73
BANKNIFTY 1,32,175 30.89
JINDALSTEL 2,322 16.66
DRREDDY 1,327 9.85
NIFTY 1,26,166 9.08
Volume Shockers
Symbol Volume
MOTOGENFIN 2,04,703
ICICIBANKN 1,59,149
PARABDRUGS 1,41,553
AGARIND 1,43,193
SATHAISPAT 5,42,160
AHLUCONT 2,31,946
TRIDENT 1,58,96,505
MOVERS & SHAKERS
5. Daily Report
MONDAY DEC 16 2019
URL: www.tradenivesh.com Call Us On : + 91-9039261444 Page: 5
FII DERIVATIVES STATISTICS
BUY SELL
OPEN INTEREST AT THE END OF THE
DAY
No. of con-
tracts
Amt in Crores
No. of con-
tracts
Amt in Crores No. of contracts Amt in Crores
INDEX FUTURES 44500 3608.08 32873 2564.26 160836 13873.67
INDEX OPTIONS 2085237 150922.56 2083540 150748.98 622348 53587.31
STOCK FUTURES 225544 13232.37 217827 12971.04 1590520 95407.22
STOCK OPTIONS 86333 5499.01 86674 5496.75 67421 3774.85
-1480.99
RBI REFERENCE RATE
INR / 1 USD 70.74
INR / 1 EURO 78.81
INR / 100 Jap. YEN 65.15
INR / 1 POUND Sterling 93.46
6. Daily Report
MONDAY DEC 16 2019
URL: www.tradenivesh.com Call Us On : + 91-9039261444 Page: 6
1 ASHOKLEY LAND FUTURE : (SELL )
1. MOTHERSUMI FUTURE (BUY )
PIVOT LEVELS
R2 R1 PIVOT S1 S2
84.32 83.03 81.02 79.73 77.72
ASHOKLEY LAND FUTURE :THIS SCRIPT
IS ALREADY IN OVERBOUGHT ZONE SEEMS
LIKE DEMAND OVETRAKE SUPPLY IN LAST
SESSION , BULLS REMAINS IN CONFLICT
WITH BEARS , RESULTING BEARISH RE-
VERSAL ,
SO WE ADVISE TO SELL IT BELOW 80.50
TGT 78.50-76.50 SL ABOVE 83,
MOTHERSUMI FUTURE : THIS SCRIPT
HAS FORMED ASCENDING TRIANGEL IN UP-
TREND .BREAKOUT WOULD BE POSSIBLE
FROM UPPER RESITANCE , MAJOR INDICA-
TORS ALSO GIVING BUY SIGNAL ,
SO WE ADVISE TO BUY IT ABOVE 142 TGT
145-148 SL BELOW 138.50,
PIVOT LEVELS
R2 R1 PIVOT S1 S2
147.27 144.38 140.87 137.98 134.47
TECHNICAL RECOMMENDATIONS
7. Daily Report
MONDAY DEC 16 2019
URL: www.tradenivesh.com Call Us On : + 91-9039261444 Page: 7
TECHNICAL VIEW : ORISSAMINE LTD( SELL )
TECHNICAL VIEW: MOTHERSUMI LTD CASH (BUY )
PIVOT LEVELS
R2 R1 PIVOT S1 S2
1,535.33 1,452.67 1,366.33 1,283.67 1,197.33
ORISSAMINE LTD :THIS SCRIPT IS AL-
READY IN OVERBOUGHT ZONE SEEMS LIKE
DEMAND OVETRAKE SUPPLY IN LAST SES-
SION , BULLS REMAINS IN CONFLICT WITH
BEARS , RESULTING BEARISH REVERSAL ,
SO WE ADVISE TO SELL IT BELOW 1360 TGT
1330-1300 SL ABOVE 1395,
MOTHERSUMI LTD : THIS SCRIPT HAS
FORMED ASCENDING TRIANGEL IN UP-
TREND .BREAKOUT WOULD BE POSSIBLE
FROM UPPER RESITANCE , MAJOR INDICA-
TORS ALSO GIVING BUY SIGNAL ,
SO WE ADVISE TO BUY IT ABOVE 142 TGT
145-148 SL BELOW 138.50,
PIVOT LEVELS
R2 R1 PIVOT S1 S2
147.52 144.43 140.32 137.23 133.12
TECHNICAL RECOMMENDATIONS
8. Daily Report
MONDAY DEC 16 2019
URL: www.tradenivesh.com Call Us On : + 91-9039261444 Page: 8
3. NIFTY FUTURE (SELL )
4. BANK NIFTY FUTURE (SELL )
PIVOT LEVELS
R2 R1 PIVOT S1 S2
12,216.47 12,183.88 12,119.42 12,086.83 12,022.37
NIFTY FUTURE: NIFTY IS SHOWING OVEROP-
TIMISIM, FORMING DOJI CANDLE AT THE
TOP, BEARISH REVERSAL CAN BE SEEN FROM
THE TOP , NIFTY IS APPROACHING EX-
TREMES OF UPPER 2 STANDARD DEVIA-
TION , MINOR CORRECTION CAN BE SEEN,
SO WE ADVISE TO SELL IT BELOW 12130 TGT
12080-12030 SL ABOVE 12185,
BANKNIFTY FUTURE: BANKNIFTY IS SHOW-
ING OVEROPTIMISM, FORMING SPINNING TOP
CANDLE AT THE TOP, BEARISH REVERSAL
CAN BE SEEN FROM THE TOP , BANNIFTY IS
APPROACHING EXTREMES OF UPPER 2
STANDARD DEVIATION , MINOR CORRECTION
CAN BE SEEN,
SO WE ADVISE TO SELL IT BELOW 32100 TGT
32000-31900 SL ABOVE 32210,
PIVOT LEVELS
R2 R1 PIVOT S1 S2
32,468.30 32,281.95 32,043.65 31,857.30 31,619.00
TECHNICAL RECOMMENDATIONS
9. Daily Report
MONDAY DEC 16 2019
URL: www.tradenivesh.com Call Us On : + 91-9039261444 Page: 9
PREVIOUS DAY’S PERFORMANCE
CALL SEGMENT ADVISE ENTRY TGT SL STATUS
NIFTY INDEX BUY 12050 12100-12180 11980 1ST TGT
BANKNIFTY INDEX BUY 31750 31840-32000 31500 FINAL TGT
TATASTEEL
LTD
CASH BUY 420 425-430 414 NOT EXECUTED
VOLTAS LTD CASH BUY 696 703-712 687 SL
VOLTAS FUTURE BUY 696 703-712 687 SL
RBLBANK FUTURE BUY 335 340-346 328 FINAL TGT
DISCLAIMER
This document is solely for the personal information of the recipient, and must not be singularly used as the basis of any
investment decision. Nothing in this document should be construed as investment or financial advice. Each recipient of
this document should make such investigations as they deem necessary to arrive at an independent evaluation of an in-
vestment in the securities of the companies referred to in this document including the merits and risks involved, and
should consult their own advisors to determine the merits and risks of such an investment. Reports based on technical
and derivative analysis center on studying charts of a stock's price movement, outstanding positions and trading vol-
ume. The information in this document has been printed on the basis of publicly available information, internal data and
other reliable sources believed to be true, but we do not represent that it is accurate or complete and it should not be
relied on as such, as this document is for general guidance only. Trade Nivesh shall not be in any way responsible for
any loss or damage that may arise.