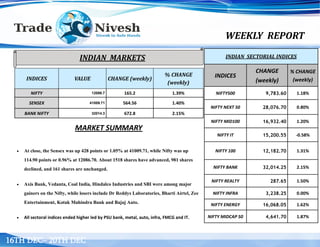
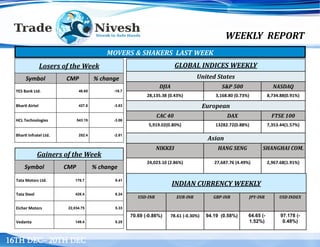
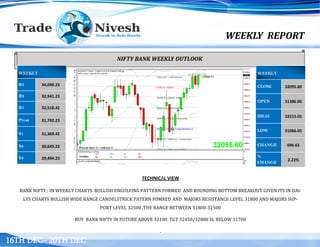
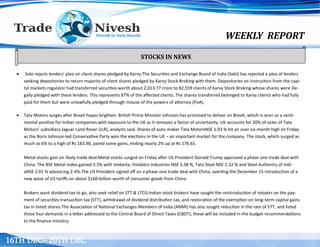
- The key indices in India ended higher for the week led by gains in the banking, metal and auto sectors. Axis Bank, Vedanta and Coal India were the top gainers.
- Globally, Asian markets rose led by a 4.5% gain in the Hang Seng while European markets were up around 1% and US markets rose less than 1%.
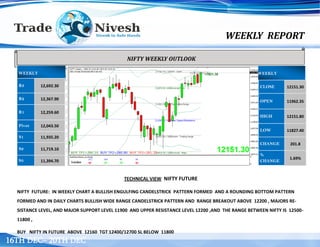
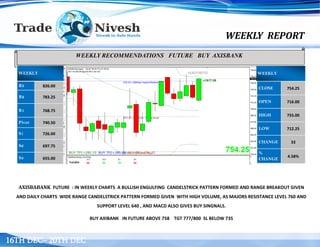
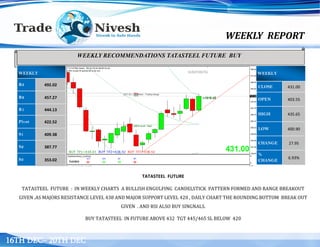
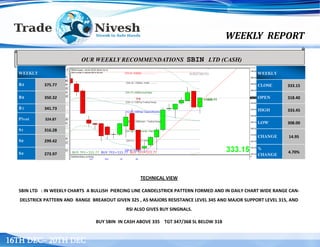
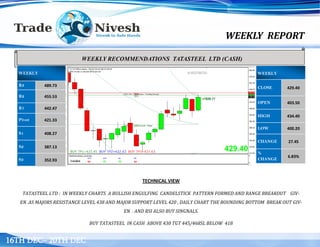
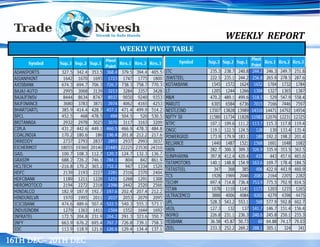
- Technically, charts indicate bullish patterns in Axis Bank, Tata Steel, SBI and Tata Motors suggesting these as buy recommendations. Support and resistance levels are provided.