
![Any Questions? [email_address] Graphs: LMIC – www.lmic.info Data: LMIC, USDA-NASS](https://image.slidesharecdn.com/2010cowcalfoutlook-100425163635-phpapp01/85/2010-Cow-Calf-Outlook-53-320.jpg)

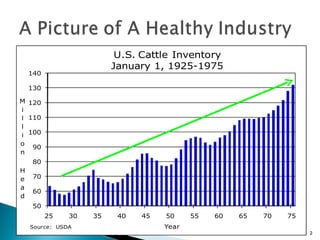
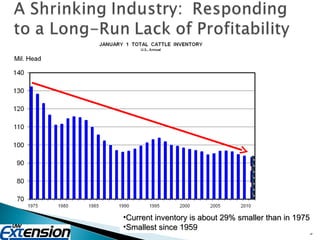
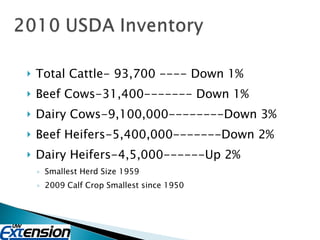
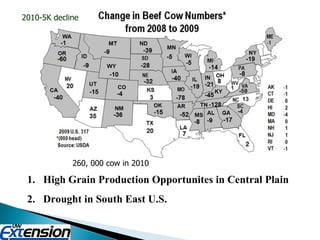
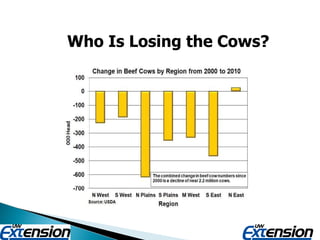
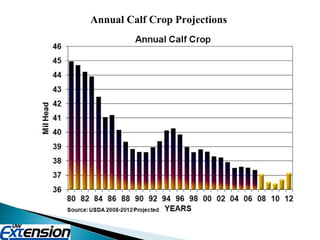
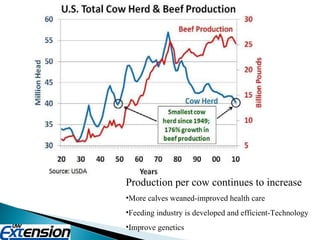
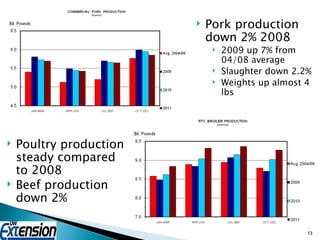
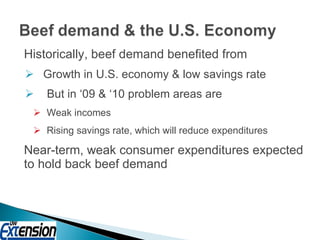
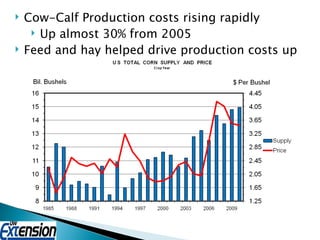
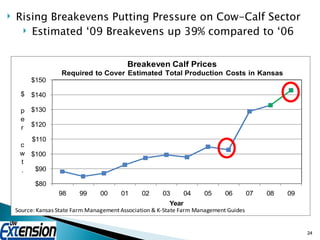
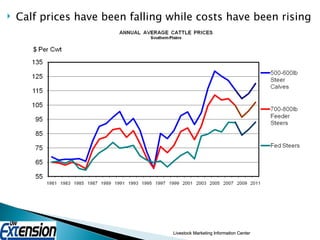
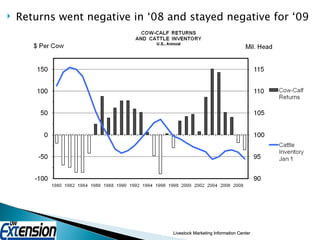
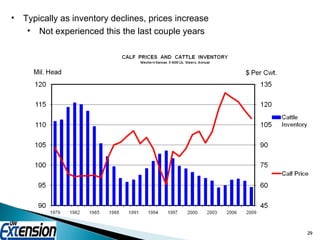
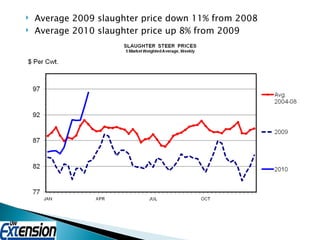
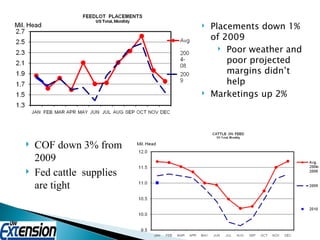
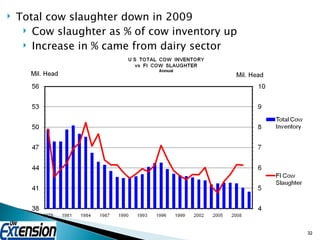
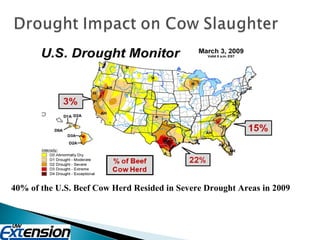
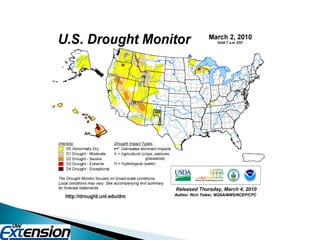
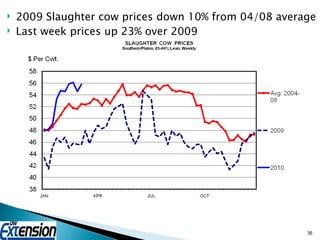
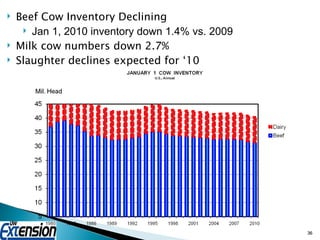
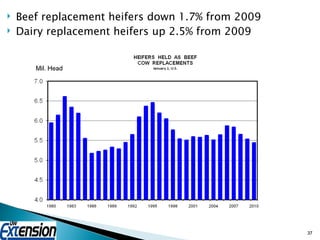
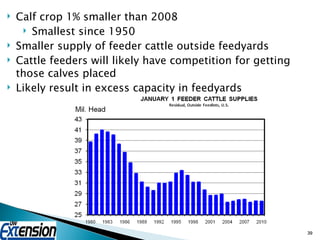
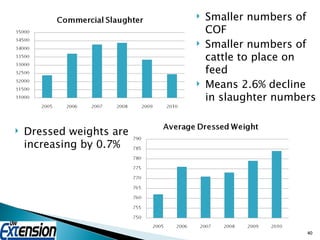
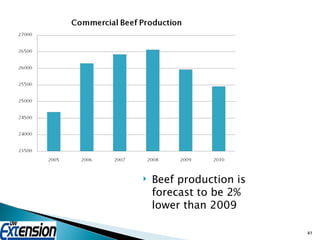
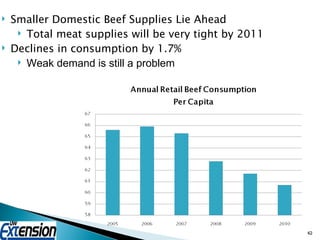
The document discusses trends in the US cattle industry from 2009-2010, including declining cattle inventories, rising costs of production, and tight domestic beef supplies. Cattle numbers were at their lowest since 1959. Beef cow inventory declined 1% in 2010 while milk cow numbers dropped 2.7%. Smaller cattle supplies supported higher prices for calves and feeders in 2010. Beef production was forecast to decline 2% from 2009 levels due to smaller feeder cattle availability and cattle placements.


![Dubai1[1]](https://cdn.slidesharecdn.com/ss_thumbnails/dubai11-124277949939-phpapp01-thumbnail.jpg?width=640&height=640&fit=bounds)


![[BeefSummit Brasil] Jesse Womack: Os produtores de carne nos EUA: hoje e aman...](https://cdn.slidesharecdn.com/ss_thumbnails/jesse-131219115107-phpapp02-thumbnail.jpg?width=640&height=640&fit=bounds)


