D3 & MeteorJS allows developers to rapidly prototype data-driven web applications by combining MeteorJS and D3. D3 allows binding of data to HTML documents to dynamically generate vector graphics like charts and maps. It handles common tasks like data binding, scaling, and transitions. While D3 provides control, it does not offer canned solutions and is not ideal for quick projects. Core D3 concepts involve selecting elements and binding data to them. Examples of bar charts and maps generated with D3 and MeteorJS are provided.

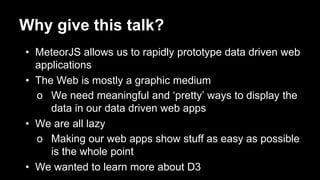


![Core D3 Concepts: Data Binding
● Map data to selected elements, loop
○ D3 handles many data types: arrays, dictionaries
data = [1, 2, 3, 4];
d3.select("body").selectAll("p")
.data(data)
.enter()
.append("p")
.text("Paragraph Tag");
• Creates 4 new <p>Paragraph Tag</p>](https://image.slidesharecdn.com/d3meteorjs-140525141046-phpapp01/85/D3-MeteorJS-9-320.jpg)


![[3DIR] BIM Search Engine: Exploiting Interrelations between Objects when Ass...](https://cdn.slidesharecdn.com/ss_thumbnails/demianicccbe2018v3-180607150516-thumbnail.jpg?width=640&height=640&fit=bounds)


![[DSC Europe 25] Dragan Jerosimovic - The Anatomy of a Narrative Simulation.pdf](https://cdn.slidesharecdn.com/ss_thumbnails/vzputuprdqr6zwbrwdcw-1-dragan-jerosimovic-the-anatomy-of-a-narrative-simulation-260114111931-9d04fba2-thumbnail.jpg?width=640&height=640&fit=bounds)

![[DSC Europe 25] Srba Markovic - From Pilot to Production: Overcoming AI Deplo...](https://cdn.slidesharecdn.com/ss_thumbnails/yjjmrtytmwbalxlba7px-4-srba-markovic-from-pilot-to-production-overcoming-ai-deployment-blockers-with-260114111931-4a892d44-thumbnail.jpg?width=640&height=640&fit=bounds)


![[DSC Europe 25] Nikola Vasiljevic - Player segmentation by combat playstyles ...](https://cdn.slidesharecdn.com/ss_thumbnails/mnvbf0yvrwaqsipzrrv3-2-nikola-vasiljevic-player-segmentation-by-playstyles-in-action-shooter-games-260114111931-b4d766cd-thumbnail.jpg?width=640&height=640&fit=bounds)
![[DSC Europe 25] Ivica Milaric - The Future of Gaming and AI Tools.pptx](https://cdn.slidesharecdn.com/ss_thumbnails/tijgzsmgse2kj2y5pzzp-5-ivica-milaric-the-future-of-gaming-x-ai-tools-260114111931-87c2b3ac-thumbnail.jpg?width=640&height=640&fit=bounds)