This document summarizes baseline data and assumptions for calculating the potential energy and emissions savings from shifting goods transport to cycle logistics in European cities. It finds that 15% of urban trips are for freight and services, with the majority being light goods transported by cars, vans, and small trucks. While freight transport accounts for 15-30% of urban transport emissions and energy use, over 99% of freight trips are currently motorized. The document establishes baselines and definitions to calculate the potential shift to cycle logistics for light urban freight transport.


![D 7.1: Performance indicators and baseline assumptions
www.cyclelogistics.eu Page 6 of 24
The TEMS data of 322 European cities show an average amount of motorised passenger trips of
45% (out of 85%) of all passenger trips. There are plenty of data available concerning the modal
split for the number of trips in European cities. But the methods on how these data are collected
and analysed differ remarkably. No uniform standard method on carrying out surveys on mobility
behaviour in cities /urban areas exists. In 2010 a country wide survey, in 27 EU-countries
xvi
,
analysed the main mode of transport. It resulted in a 3 % higher share of motorisation that the
average of the TEMS cities. This can be used as a plausibility check for our calculations, because
the motorisation in cities is usually lower than the country average.
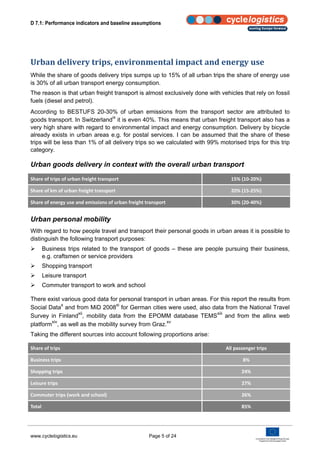
85 %
Personal trips
15 %
Cargoand
service
trips
Share of all trips in an average European city
Trips done by car and lorry
The share of motorized transport that is involved in trips associated with the transport of goods is
calculated for each trip purpose. To calculate the rate of motorisation per trip purpose surveys
were considered that are close to the mean value of the 322 European cities taken from the TEMS
database
xvii
,
xviii
.
Motorisation by trip purpose
xix
,
xx]
%
Level of motorization in urban freight and services 99%
Level of motorization in business transport 73%
Level of motorization in shopping transport 56%
Level of motorization in leisure transport 53%
Level of motorization in commuter transport 46%
The average number of all trips done by car, weighted against the share of trips that can be shifted
results in an average factor for the choice for motorized means of transport. This factor, 0.6, was
used for the calculation of the long term outcomes.](https://image.slidesharecdn.com/uoa0ptb4swa1zmrhbpmt-140522082941-phpapp02/85/Cycle-logistics-baseline_study_external-8-320.jpg)