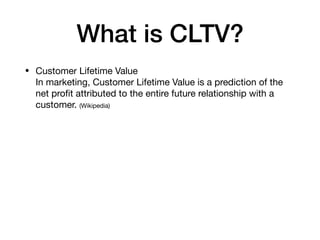
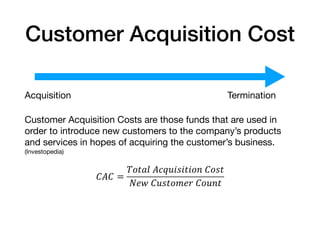
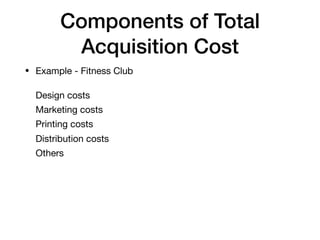
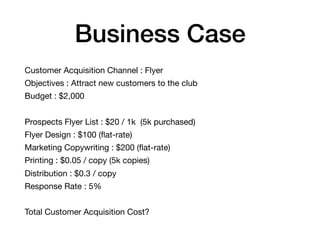
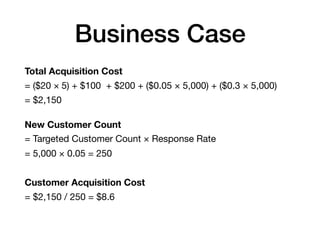
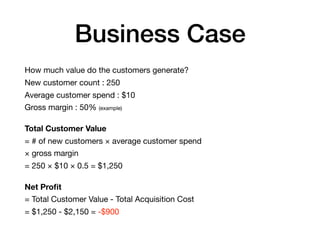
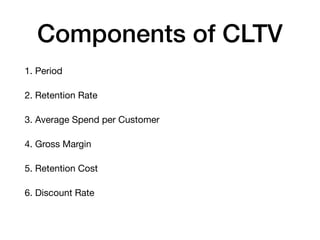
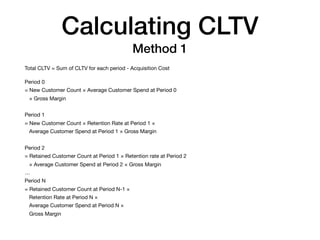
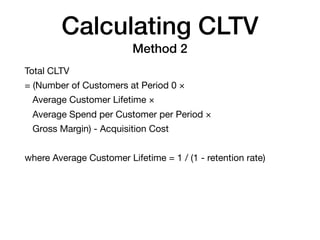
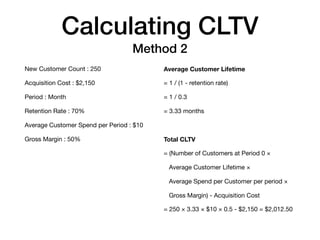
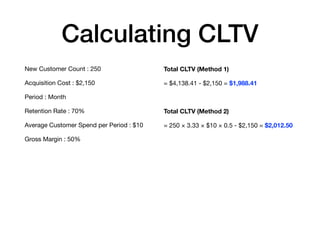
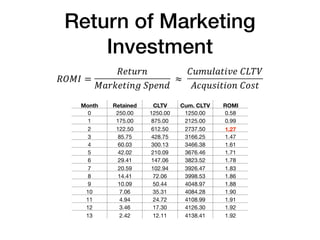
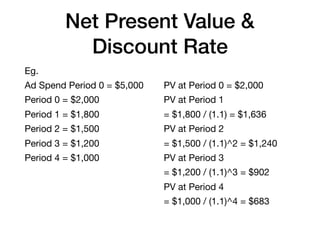
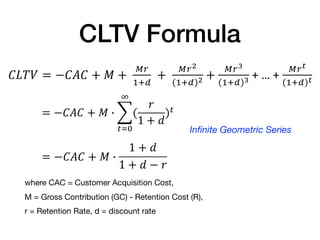
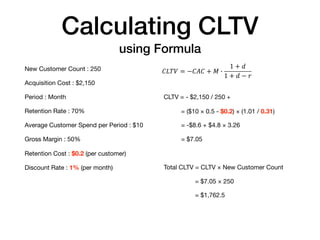
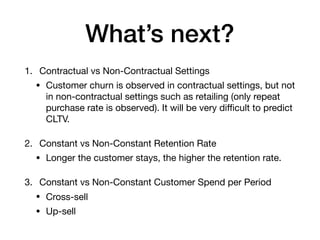
This presentation provides insight into how to forecast and calculate customer lifetime value (CLV). Here a startup applied a scientific approach to maximise customer retention and minimise churn. The outputs of the analytics were built into the system and business processes driving the success of the company and helping it to win the customer service of the year award, and to achieve a successful exit through acquisition.
This deck consists of total of thirty four slides. It has PPT slides highlighting important topics of Customer Journey Powerpoint Presentation Slides. This deck comprises of amazing visuals with thoroughly researched content. Each template is well crafted and designed by our PowerPoint experts. Our designers have included all the necessary PowerPoint layouts in this deck. From icons to graphs, this PPT deck has it all. The best part is that these templates are easily customizable. Just click the DOWNLOAD button shown below. Edit the colour, text, font size, add or delete the content as per the requirement. Download this deck now and engage your audience with this ready made presentation.
Perception and Marketing- Consumer BehaviorAqib Syed
A research technique that enables marketers to plot graphically consumers’ perceptions concerning product attributes of specific brands.
Perception and Marketing- Consumer Behavior
Consumer behaviour is the study of how individual customers, groups or organizations select, buy, use, and dispose ideas, goods, and services to satisfy their needs and wants
Targeting the most desirable new customers is often missed in favor of throwing a non-selective, broad net. This brief presentation suggests approaches for acquiring the best prospective customers
Sales Management - Meaning, Characteristics of Sales Management, Objectives of Sales Management, Importance of Sales Management, Evolution of Sales Management - Pre Industrial Revolution Period, Production Oriented Period, Sales Oriented Period, Customer Oriented Period, Sales Department, Role of Sales Department, Interface of Sales with other Management Functions, Qualities of Sales Manager, Development in Sales Management, Sales Organization, Structure of Sales Organization, Distribution - Meaning, Distribution Channel, Intermediaries, Role of Distribution Channel, Evolution of Distribution Channel, Distribution Management - Meaning, Importance of Distribution Management, Integration of Marketing, Sales and Distribution
STUDENTS Andres Hoyos Joy Hwang Alicia Klassanoff L.docxAASTHA76
STUDENTS:
Andres Hoyos Joy Hwang Alicia Klassanoff Ljubomir Petrovic
Bronco Vuskovich Maira Alejandra Soto Alice Benatar
ASSIGNMENT 2
Problem 1:
There are three major business organization forms from start-up to a major corporation. What are
these three business organization forms? What are advantages and disadvantages for each
organization form?
Advantages and Disadvantages of Business Organizations
Easy to
create
Easy to
raise
capital
Taxes
paid once
as
personal
income
Limited
Liability
Unlimited
Life
Easy to
transfer
Ownership
Management
by the
owners
Easy to
make
decisions
Sole
Proprietorship
Partnership
Corporation
100% possible
50% possible
Difficult or impossible
Problem 2:
Based on the chart below, answer the following two questions.
1. If the value of the firm is 10 million, and $F is 12 million, how much will be the payoff to debt
holders and how much will be the payoff to shareholders?
Debt Holders: $ 10 million
Shareholders: $ 0
2. If the value of the firm is 25 million, and $F is 12 million, how much will be the payoff to debt
holders and how much will be the payoff to shareholders?
Debt Holders: $ 12 million
Shareholders: $ 13 million
Problem 3:
Assume that you are nearing graduation and have applied for a job with a local bank. As part of
the bank's evaluation process, you have been asked to take an examination that covers several
financial analysis techniques. The first section of the test addresses discounted cash flow
analysis. See how you would do by answering the following questions.
a. Draw time lines for (1) a $100 lump sum cash flow at the end of Year 2, and (2) an uneven
cash flow stream of -$50, $100, $75, and $50 at the end of Years 0 through 3.
b. What's the future value of an initial $100 after 3 years if it is invested in an account paying
10% annual interest and compounded annually? How about if the interest is compounded
monthly, daily or hourly?
Compounded
Annually
Compounded
Monthly
Compounded Daily Compounded Hourly
Rate 𝑟 = 0.1 𝑟 =
0.1
12
= 0.0083 𝑟 =
0.1
365
= 0.00027 𝑟 =
0.1
365 × 24
= 0.000011
Period 𝑛 = 3 𝑛 = 3 × 36 𝑛 = 3 × 365 = 1095 𝑛 = 3 × 365 × 24 = 26280
𝑭𝑽 = 𝑷𝑽 × (𝟏 + 𝒓)𝒏
𝐹𝑉 = 100 × (1 + 0.1)3
𝐹𝑉 = 100 × 0.0083)36
𝐹𝑉 = 100 × (1 +
0.1
0.00027
)1095
𝐹𝑉 = 100 × (1 +
0.1
0.000011
)26280
FUTURE
VALUE
$133.10 $134.82 $134.98 $134.99
c. What is the present value of $100 to be received in 3 years if the annual interest rate is
10% and compounded annually? How about if the interest is compounded monthly, daily
or hourly?
Compounded
Annually
Compounded
Monthly
Compounded Daily Compounded Hourly
Rate 𝑟 = 0.1 𝑟 =
0.1
12
= 0.0083 𝑟 =
0.1
365
= 0.00027 𝑟 =
0.1
365 × 24
= 0.000011
Period 𝑛 = 3 𝑛 = 3 × 36 𝑛 = 3 × 365 = 1095 𝑛 = 3 × 365 × 24 = 2
Working Capital Optimization PowerPoint Presentation SlidesSlideTeam
Enhance your audiences knowledge with this well researched complete deck. Showcase all the important features of the deck with perfect visuals. This deck comprises of total of thirty slides with each slide explained in detail. Each template comprises of professional diagrams and layouts. Our professional PowerPoint experts have also included icons, graphs and charts for your convenience. All you have to do is DOWNLOAD the deck. Make changes as per the requirement. Yes, these PPT slides are completely customizable. Edit the colour, text and font size. Add or delete the content from the slide. And leave your audience awestruck with the professionally designed Working Capital Optimization PowerPoint Presentation Slides complete deck.
httpswww.azed.govoelaselpsUse this to see the English Lang.docxpooleavelina
https://www.azed.gov/oelas/elps/
Use this to see the English Language Proficiency Standards of Arizona-Pick a grade level
https://cms.azed.gov/home/GetDocumentFile?id=54de1d88aadebe14a87070f0
http://www.corestandards.org/ELA-Literacy/introduction/how-to-read-the-standards/
how to read standards
Week 04
Acquisition and Customer Lifetime Value (CLV)
https://www.smh.com.au/politics/federal/nbn-customers-face-higher-prices-or-poorer-internet-connection-audit-warns-20190813-p52go7.html
Customer Relationship Management?
CRM is the process of carefully managing detailed information about individual
customers and all customer touch points to maximize customer loyalty.
Now closely associated with data warehousing and mining
Relationship
Relationship
Identifying good customers: RFM Model
Recency
Frequency
Monetary Value
Time/purchase occasions since the last purchase
Number of purchase occasions since first purchase
Amount spent since the first purchase
R
F
M
Total RFM Score: R Score + F score + M Score
CASE: Database for BookBinders Book Club
Predict response to a mailing for the book, Art History of Florence, based on the
following variables accumulated in the database and the responses to a test mailing:
Gender
Amount purchased
Months since first purchase
Months since last purchase
Frequency of purchase
Past purchases of art books
Past purchases of children’s books
Past purchases of cook books
Past purchases of DIY books
Past purchases of youth books
Recency
Frequency
Monetary
Example: RFM Model Scoring Criteria
R
Months from last
purchase
13-max 10-12 7-9 3-6 0-2
Score 5pts 10 15 20 25
F
Frequency > 30 21-30 16-20 11-15 0-10
Score 25pts 20 15 10 5
M
Amount
purchased
> 400 301-400 201-300 101- 200 100
Score 50 45 30 15 10
Implement using Nested If statements in Excel
Decile Classification
• Standard Assessment Method
• Apply the results of approach and
calculate the “score” of each individual
• Order the customers based on “score”
from the highest to the lowest
• Divide into deciles
• Calculate profits per deciles
Customer 1 Score 1.00
Customer 2 Score 0.99
….
Customer 230 Score 0.92
Customer 2300 Score 0.00
Decile1
Decile10
…
..
…
..
Output for Bookbinders club
Decile Score RFM No. of Mailings Cost of mailing RFM Units sold RFM Profit
10 17.6% 5000 $3,250 783 $4,733
20 34.8% 10000 $6,500 1,543 $9,243
30 46.1% 15000 $9,750 2,043 $11,093
40 53.4% 20000 $13,000 2,370 $11,170
50 65.2% 25000 $16,250 2,891 $13,241
60 77.9% 30000 $19,500 3,457 $15,757
70 83.3% 35000 $22,750 3,696 $14,946
80 91.7% 40000 $26,000 4,065 $15,465
90 97.5% 45000 $29,250 4,326 $14,876
100 100.0% 50000 $32,500 4,435 $12,735
Note: Market Potential = 4435 units and margin = $10.20
Leaky bucket
New customer
acquisition
Purchase increase by
current customers
Purchase decrease by
current customers
Lost customers
Lost customers
Credit Card Rewards Program ...
Explore our comprehensive data analysis project presentation on predicting product ad campaign performance. Learn how data-driven insights can optimize your marketing strategies and enhance campaign effectiveness. Perfect for professionals and students looking to understand the power of data analysis in advertising. for more details visit: https://bostoninstituteofanalytics.org/data-science-and-artificial-intelligence/
Opendatabay - Open Data Marketplace.pptxOpendatabay
Opendatabay.com unlocks the power of data for everyone. Open Data Marketplace fosters a collaborative hub for data enthusiasts to explore, share, and contribute to a vast collection of datasets.
First ever open hub for data enthusiasts to collaborate and innovate. A platform to explore, share, and contribute to a vast collection of datasets. Through robust quality control and innovative technologies like blockchain verification, opendatabay ensures the authenticity and reliability of datasets, empowering users to make data-driven decisions with confidence. Leverage cutting-edge AI technologies to enhance the data exploration, analysis, and discovery experience.
From intelligent search and recommendations to automated data productisation and quotation, Opendatabay AI-driven features streamline the data workflow. Finding the data you need shouldn't be a complex. Opendatabay simplifies the data acquisition process with an intuitive interface and robust search tools. Effortlessly explore, discover, and access the data you need, allowing you to focus on extracting valuable insights. Opendatabay breaks new ground with a dedicated, AI-generated, synthetic datasets.
Leverage these privacy-preserving datasets for training and testing AI models without compromising sensitive information. Opendatabay prioritizes transparency by providing detailed metadata, provenance information, and usage guidelines for each dataset, ensuring users have a comprehensive understanding of the data they're working with. By leveraging a powerful combination of distributed ledger technology and rigorous third-party audits Opendatabay ensures the authenticity and reliability of every dataset. Security is at the core of Opendatabay. Marketplace implements stringent security measures, including encryption, access controls, and regular vulnerability assessments, to safeguard your data and protect your privacy.
06-04-2024 - NYC Tech Week - Discussion on Vector Databases, Unstructured Data and AI
Discussion on Vector Databases, Unstructured Data and AI
https://www.meetup.com/unstructured-data-meetup-new-york/
This meetup is for people working in unstructured data. Speakers will come present about related topics such as vector databases, LLMs, and managing data at scale. The intended audience of this group includes roles like machine learning engineers, data scientists, data engineers, software engineers, and PMs.This meetup was formerly Milvus Meetup, and is sponsored by Zilliz maintainers of Milvus.
Data Centers - Striving Within A Narrow Range - Research Report - MCG - May 2...pchutichetpong
M Capital Group (“MCG”) expects to see demand and the changing evolution of supply, facilitated through institutional investment rotation out of offices and into work from home (“WFH”), while the ever-expanding need for data storage as global internet usage expands, with experts predicting 5.3 billion users by 2023. These market factors will be underpinned by technological changes, such as progressing cloud services and edge sites, allowing the industry to see strong expected annual growth of 13% over the next 4 years.
Whilst competitive headwinds remain, represented through the recent second bankruptcy filing of Sungard, which blames “COVID-19 and other macroeconomic trends including delayed customer spending decisions, insourcing and reductions in IT spending, energy inflation and reduction in demand for certain services”, the industry has seen key adjustments, where MCG believes that engineering cost management and technological innovation will be paramount to success.
MCG reports that the more favorable market conditions expected over the next few years, helped by the winding down of pandemic restrictions and a hybrid working environment will be driving market momentum forward. The continuous injection of capital by alternative investment firms, as well as the growing infrastructural investment from cloud service providers and social media companies, whose revenues are expected to grow over 3.6x larger by value in 2026, will likely help propel center provision and innovation. These factors paint a promising picture for the industry players that offset rising input costs and adapt to new technologies.
According to M Capital Group: “Specifically, the long-term cost-saving opportunities available from the rise of remote managing will likely aid value growth for the industry. Through margin optimization and further availability of capital for reinvestment, strong players will maintain their competitive foothold, while weaker players exit the market to balance supply and demand.”
2. What is CLTV?
• Customer Lifetime Value
In marketing, Customer Lifetime Value is a prediction of the
net profit attributed to the entire future relationship with a
customer. (Wikipedia)
3. Customer Acquisition Cost
Acquisition Termination
Customer Acquisition Costs are those funds that are used in
order to introduce new customers to the company’s products
and services in hopes of acquiring the customer’s business.
(Investopedia)
!"! =
$%&'( "*+,-.-&-%/ !%.&
012 !,.&%314 !%,/&
4. Components of Total
Acquisition Cost
• Example - Fitness Club
Design costs
Marketing costs
Printing costs
Distribution costs
Others
5. Business Case
Customer Acquisition Channel : Flyer
Objectives : Attract new customers to the club
Budget : $2,000
Prospects Flyer List : $20 / 1k (5k purchased)
Flyer Design : $100 (flat-rate)
Marketing Copywriting : $200 (flat-rate)
Printing : $0.05 / copy (5k copies)
Distribution : $0.3 / copy
Response Rate : 5%
Total Customer Acquisition Cost?
7. Business Case
How much value do the customers generate?
New customer count : 250
Average customer spend : $10
Gross margin : 50% (example)
Total Customer Value
= # of new customers × average customer spend
× gross margin
= 250 × $10 × 0.5 = $1,250
Net Profit
= Total Customer Value - Total Acquisition Cost
= $1,250 - $2,150 = -$900
9. Things to Consider…
Will they purchase again?
How much value will they generate subsequently?
How long will they keep a relationship with the business before
switching or terminating?
Will they ever become a customer if it weren’t for the acquisition
campaign?
10. Components of CLTV
1. Period
2. Retention Rate
3. Average Spend per Customer
4. Gross Margin
5. Retention Cost
6. Discount Rate
11. Calculating CLTV
Method 1
Total CLTV = Sum of CLTV for each period - Acquisition Cost
Period 0
= New Customer Count × Average Customer Spend at Period 0
× Gross Margin
Period 1
= New Customer Count × Retention Rate at Period 1 ×
Average Customer Spend at Period 1 × Gross Margin
Period 2
= Retained Customer Count at Period 1 × Retention rate at Period 2
× Average Customer Spend at Period 2 × Gross Margin
…
Period N
= Retained Customer Count at Period N-1 ×
Retention Rate at Period N ×
Average Customer Spend at Period N ×
Gross Margin
12. Calculating CLTV
Method 1
CLTV for month 0 = 250 × $10 × 0.5 = $1,250
# of retained customers for month 1
= 250 × 0.7 = 175
CLTV for month 1 = 175 × $10 × 0.5 = $875
# of retained customers for month 2
= 175 × 0.7 = 122.5
CLTV for month 2 = 122.5 × $10 × 0.5 = $612.5
…
# of retained customers for month 12
= 4.94 × 0.7 = 3.46
CLTV for month 12 = 3.46 × $10 × 0.5 = $17.30
# of retained customers for month 13
= 3.46 × 0.7 = 2.42
CLTV for month 13 = 2.42 × $10 × 0.5 = $12.11
Total CLTV
= Sum of All Periods - Acquisition Cost
= $4,138.41 - $2,150 = $1,988.41
CTLV per Customer = $1,988.41 / 250 = $7.95 (It worth it!)
New Customer Count : 250
Acquisition Cost : $2,150
Period : Month
Retention Rate : 70%
Average Customer Spend per Period : $10
Gross Margin : 50%
13. Calculating CLTV
Method 2
Total CLTV
= (Number of Customers at Period 0 ×
Average Customer Lifetime ×
Average Spend per Customer per Period ×
Gross Margin) - Acquisition Cost
where Average Customer Lifetime = 1 / (1 - retention rate)
14. Calculating CLTV
Method 2
Average Customer Lifetime
= 1 / (1 - retention rate)
= 1 / 0.3
= 3.33 months
Total CLTV
= (Number of Customers at Period 0 ×
Average Customer Lifetime ×
Average Spend per Customer per period ×
Gross Margin) - Acquisition Cost
= 250 × 3.33 × $10 × 0.5 - $2,150 = $2,012.50
New Customer Count : 250
Acquisition Cost : $2,150
Period : Month
Retention Rate : 70%
Average Customer Spend per Period : $10
Gross Margin : 50%
15. Calculating CLTV
Total CLTV (Method 1)
= $4,138.41 - $2,150 = $1,988.41
Total CLTV (Method 2)
= 250 × 3.33 × $10 × 0.5 - $2,150 = $2,012.50
New Customer Count : 250
Acquisition Cost : $2,150
Period : Month
Retention Rate : 70%
Average Customer Spend per Period : $10
Gross Margin : 50%
17. Net Present Value &
Discount Rate
Net Present Value (NPV)
NPV is the difference between the present value of cash inflows
and the present value of cash outflows over a period of time.
(Investopedia)
Discount Rate (d)
Discount rate refers to the interest rate used in discounted cash
flow (DCF) analysis to determine the present value of future cash
flows. (Investopedia)
18. Net Present Value &
Discount Rate
Eg.
Ad Spend Period 0 = $5,000
Period 0 = $2,000
Period 1 = $1,800
Period 2 = $1,500
Period 3 = $1,200
Period 4 = $1,000
PV at Period 0 = $2,000
PV at Period 1
= $1,800 / (1.1) = $1,636
PV at Period 2
= $1,500 / (1.1)^2 = $1,240
PV at Period 3
= $1,200 / (1.1)^3 = $902
PV at Period 4
= $1,000 / (1.1)^4 = $683
22. What’s next?
1. Contractual vs Non-Contractual Settings
• Customer churn is observed in contractual settings, but not
in non-contractual settings such as retailing (only repeat
purchase rate is observed). It will be very difficult to predict
CLTV.
2. Constant vs Non-Constant Retention Rate
• Longer the customer stays, the higher the retention rate.
3. Constant vs Non-Constant Customer Spend per Period
• Cross-sell
• Up-sell