![Daily traffic
by weekday
1st Boxplot
[built with R]](https://image.slidesharecdn.com/customreportsiwishihadingoogleanalytics-180121175003/75/Custom-reports-I-wish-I-had-in-Google-Analytics-5-2048.jpg)
![Daily traffic by
month of year
2nd Boxplot
[built with Tableau]](https://image.slidesharecdn.com/customreportsiwishihadingoogleanalytics-180121175003/75/Custom-reports-I-wish-I-had-in-Google-Analytics-6-2048.jpg)
![Daily traffic by
weekday - split
by gender
3rd Boxplot
[built with Tableau]](https://image.slidesharecdn.com/customreportsiwishihadingoogleanalytics-180121175003/75/Custom-reports-I-wish-I-had-in-Google-Analytics-7-2048.jpg)
![Conversion
rate
comparison
4th & 5th Boxplots
[built with Tableau & R]](https://image.slidesharecdn.com/customreportsiwishihadingoogleanalytics-180121175003/75/Custom-reports-I-wish-I-had-in-Google-Analytics-8-2048.jpg)

![Conversion
rate
distribution
1st Histogram
[built with Tableau]](https://image.slidesharecdn.com/customreportsiwishihadingoogleanalytics-180121175003/75/Custom-reports-I-wish-I-had-in-Google-Analytics-10-2048.jpg)
![Traffic by
day part
2nd Histogram
[built with R]](https://image.slidesharecdn.com/customreportsiwishihadingoogleanalytics-180121175003/75/Custom-reports-I-wish-I-had-in-Google-Analytics-11-2048.jpg)
![7-day rolling
average
1st average line
[built with Tableau]](https://image.slidesharecdn.com/customreportsiwishihadingoogleanalytics-180121175003/75/Custom-reports-I-wish-I-had-in-Google-Analytics-13-2048.jpg)
![7-day rolling average 2nd average line [built with R]](https://image.slidesharecdn.com/customreportsiwishihadingoogleanalytics-180121175003/75/Custom-reports-I-wish-I-had-in-Google-Analytics-14-2048.jpg)
![Conversion
rate average
3rd average line
[built with Tableau]](https://image.slidesharecdn.com/customreportsiwishihadingoogleanalytics-180121175003/75/Custom-reports-I-wish-I-had-in-Google-Analytics-15-2048.jpg)
![All-time
traffic
decomposition
[built with R]](https://image.slidesharecdn.com/customreportsiwishihadingoogleanalytics-180121175003/75/Custom-reports-I-wish-I-had-in-Google-Analytics-17-2048.jpg)
![Traffic forecast (daily) [built with R]](https://image.slidesharecdn.com/customreportsiwishihadingoogleanalytics-180121175003/75/Custom-reports-I-wish-I-had-in-Google-Analytics-18-2048.jpg)
![Traffic
forecast
(monthly)
[built with Tableau]](https://image.slidesharecdn.com/customreportsiwishihadingoogleanalytics-180121175003/75/Custom-reports-I-wish-I-had-in-Google-Analytics-19-2048.jpg)
![Monthly traffic
comparison
side by side
Year-over-Year bar chart
[built with Tableau]](https://image.slidesharecdn.com/customreportsiwishihadingoogleanalytics-180121175003/75/Custom-reports-I-wish-I-had-in-Google-Analytics-21-2048.jpg)
![Year over year
growth rate
Percentage of growth
[built with Tableau]](https://image.slidesharecdn.com/customreportsiwishihadingoogleanalytics-180121175003/75/Custom-reports-I-wish-I-had-in-Google-Analytics-22-2048.jpg)
![Month over
month growth
Percentage of growth
[built with Tableau]](https://image.slidesharecdn.com/customreportsiwishihadingoogleanalytics-180121175003/75/Custom-reports-I-wish-I-had-in-Google-Analytics-23-2048.jpg)
![Cumulative
sessions &
transactions
Total amounts
[built with Tableau]](https://image.slidesharecdn.com/customreportsiwishihadingoogleanalytics-180121175003/75/Custom-reports-I-wish-I-had-in-Google-Analytics-24-2048.jpg)
![Traffic sources
overview
Traffic vs conversions
[built with Tableau]](https://image.slidesharecdn.com/customreportsiwishihadingoogleanalytics-180121175003/75/Custom-reports-I-wish-I-had-in-Google-Analytics-26-2048.jpg)
![Traffic sources
(clustered)
Traffic vs conversions
grouped into colored clusters
[built with Tableau]](https://image.slidesharecdn.com/customreportsiwishihadingoogleanalytics-180121175003/75/Custom-reports-I-wish-I-had-in-Google-Analytics-27-2048.jpg)
![6. Pareto analysis [80 - 20]](https://image.slidesharecdn.com/customreportsiwishihadingoogleanalytics-180121175003/75/Custom-reports-I-wish-I-had-in-Google-Analytics-28-2048.jpg)
![20% of
Landing Pages
that bring 80%
of Transactions
Pareto chart - conversions
[built with Tableau]](https://image.slidesharecdn.com/customreportsiwishihadingoogleanalytics-180121175003/75/Custom-reports-I-wish-I-had-in-Google-Analytics-29-2048.jpg)
![20% of
Landing Pages
that bring 80%
of Traffic
Pareto chart - organic traffic
[built with Tableau]](https://image.slidesharecdn.com/customreportsiwishihadingoogleanalytics-180121175003/75/Custom-reports-I-wish-I-had-in-Google-Analytics-30-2048.jpg)
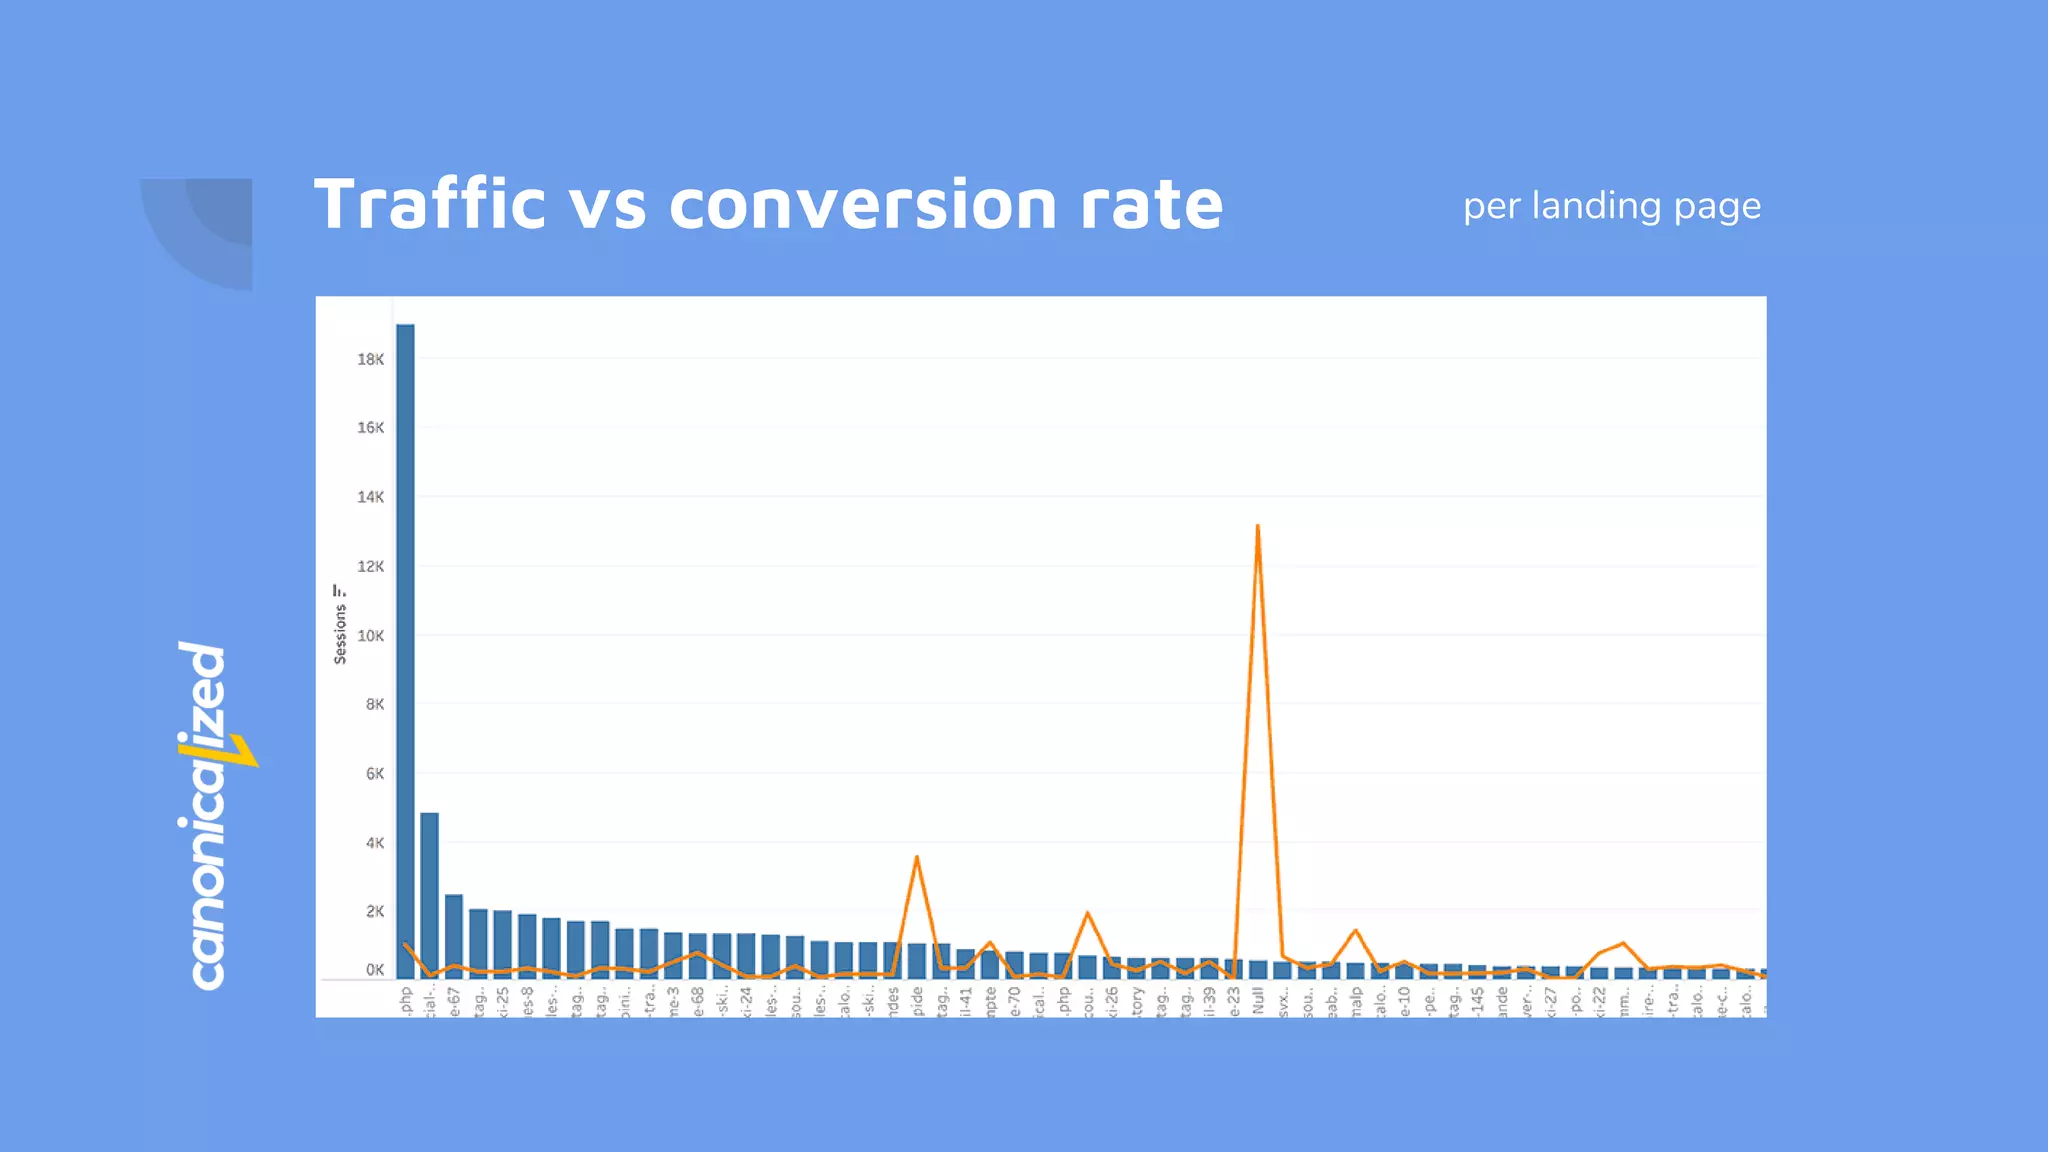
![Traffic vs
conversion rate
per browser
resolution
Bars vs Lines
[built with Tableau]](https://image.slidesharecdn.com/customreportsiwishihadingoogleanalytics-180121175003/75/Custom-reports-I-wish-I-had-in-Google-Analytics-33-2048.jpg)
![Traffic source
paths to
conversion
Sunburst - assisted conversions
[built with R & D3]](https://image.slidesharecdn.com/customreportsiwishihadingoogleanalytics-180121175003/75/Custom-reports-I-wish-I-had-in-Google-Analytics-35-2048.jpg)


The document outlines eight advanced visualization techniques for analyzing Google Analytics data, emphasizing the need to discover insights beyond standard reports. Techniques include box plots, rolling averages, forecasting, growth comparisons, bubble charts, Pareto analysis, and multi-channel analysis, each illustrated with examples built using tools like R and Tableau. The goal is to enhance understanding of traffic patterns and conversion metrics through creative data representation.


![[DSC Europe 25] Miodrag Pesovic & Vladislav Radonjic - Federated Data Archite...](https://cdn.slidesharecdn.com/ss_thumbnails/gsbe3y5it5uhndi4e08e-1-251212103249-f1008e0c-thumbnail.jpg?width=640&height=640&fit=bounds)


![[DSC Europe 25] Marko Krstic - Understanding the AI Threat Landscape - Risks,...](https://cdn.slidesharecdn.com/ss_thumbnails/tiyim1ins5jvbrvzpzla-2-251209104645-c69d3553-thumbnail.jpg?width=640&height=640&fit=bounds)


![[DSC Europe 25] Dunja Adzic Jovanovic - AI and Cybersecurity: Defending Data ...](https://cdn.slidesharecdn.com/ss_thumbnails/o1zylpbhrtwnixxq2xj8-7-251211083048-185086f6-thumbnail.jpg?width=640&height=640&fit=bounds)

![[DSC Europe 25] Branko Urosevic -Rethinking Financial Talent: Integrating Cod...](https://cdn.slidesharecdn.com/ss_thumbnails/8jjrus8ttko6qj64f58f-3-251212103250-642c6374-thumbnail.jpg?width=640&height=640&fit=bounds)


![[DSC Europe 25] Katherine Forrest - AI NOW: Understanding the Velocity of Cha...](https://cdn.slidesharecdn.com/ss_thumbnails/wvvbruqfrci0sfq9xwgb-4-251212104007-e5ad1987-thumbnail.jpg?width=640&height=640&fit=bounds)
