Download to read offline

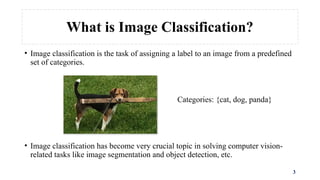
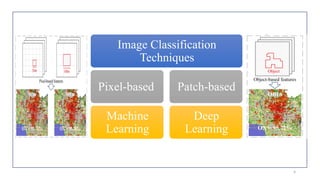


The document outlines a seminar on crop image classification using machine learning (ML) and deep learning (DL) techniques, highlighting essential concepts, methodologies, and applications in agriculture. It discusses the advantages and limitations of ML and DL, specifically in tasks like crop yield prediction, pest detection, and weed management. The presentation includes case studies demonstrating the efficacy of these technologies in enhancing automated and precise crop classification processes.