Download to read offline

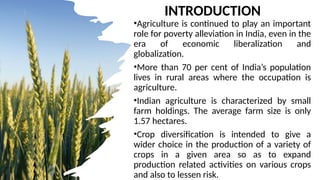
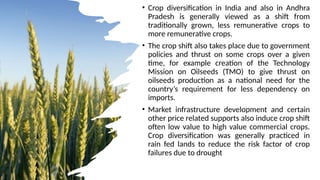
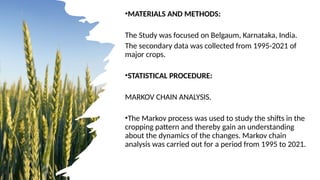
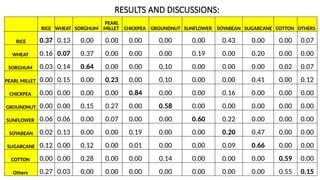
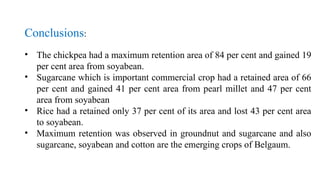


This document analyzes crop shifts in Belgaum, Karnataka, using Markov chain analysis from 1995 to 2021. It highlights the importance of crop diversification for risk reduction in agriculture, with key findings indicating high retention areas for chickpea (84%), sugarcane (66%), and groundnut (58%), while rice saw a significant loss of area to more profitable crops like soyabean. The study provides insights into changing cropping patterns influenced by market and government policies.


