Downloaded 10 times


![Take a look at this graphic and the data for your community and address these questions:
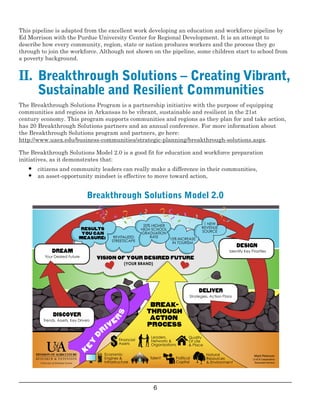
Discussion Questions
1) Does this confirm your understanding of your community?
2) Are there any surprises?
3) Is there a gap between the unfilled jobs that are available and the unemployment rate? How would
you explain this?
4) What is working well in your community?
5) What issues or opportunities need to be addressed?
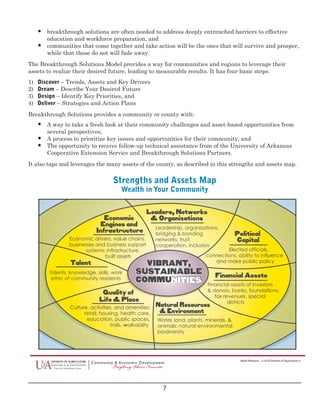
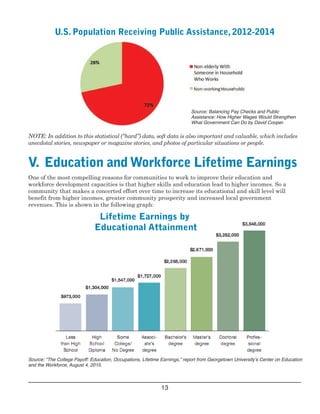
The Working Poor
In every community, there is a class of worker often labeled “the working poor,” a significant portion of
our workforce. As you can see from the following graphics,
• 28 percent of American workers in 2011 earn povertylevel wages.
• 71.6 percent of families or individuals receiving public assistance under the age of 65 have
someone in the household working. See “Balancing paychecks and public assistance: How
higher wages would strengthen what government can do” Briefing Paper #418 by David
Cooper, February 3, 2016.
The Bureau of Labor Statistics defines the working poor as people who spend 27 weeks or more in a
year in the labor force either working or looking for work but whose incomes fall below the poverty
level [1]. In 2015 an estimated 9.5 million workers are classified as working poor [2]. It is useful to
keep in mind the poverty rate for a family of four is $24,300 in 2016, a threshold that is considered by
many researchers to be too low [3]. The working poor are more likely to be female, black or Hispanic,
have low levels of educational attainment and be single parents [4].
The stagnation of wages for all workers over the last forty years has created a large class of low wage
workers, estimated to be as much as onethird of the entire workforce, who are teetering on the brink
of poverty [5, 6]. Unlike many workforce development approaches, the Workforce Pipeline recognizes
this segment of the workforce and provides a context for the community to identify and implement
programs and services to address the needs of these workers.
United States Workforce
Source: The State of Working America, 12th
Edition, Economic Policy Institute.
12](https://image.slidesharecdn.com/workforcedevelopmentpipelinearkansas-180622154542/85/Creating-an-Education-and-Workforce-Development-Pipeline-for-Your-Community-or-Region-11-320.jpg)
![References
[1] http://poverty.ucdavis.edu/faq/whoareworkingpooramerica
[2] http://www.census.gov/library/publications/2016/demo/p60256.html
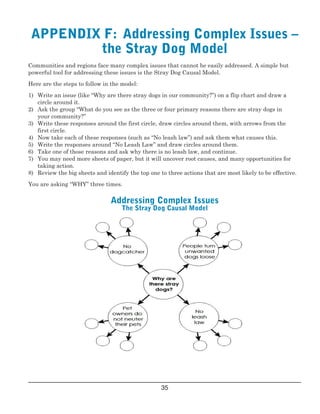
[3] https://www.americanprogress.org/issues/poverty/reports/2009/08/25/6582/itstimeforabetterpovertymeasure/
[4] http://www.bls.gov/opub/reports/workingpoor/archive/aprofileoftheworkingpoor2013.pdf
[5] http://www.epi.org/publication/chartingwagestagnation/
[6] https://www.oxfamamerica.org/static/media/files/WorkingPoorinAmericareportOxfamAmerica.pdf
22](https://image.slidesharecdn.com/workforcedevelopmentpipelinearkansas-180622154542/85/Creating-an-Education-and-Workforce-Development-Pipeline-for-Your-Community-or-Region-21-320.jpg)
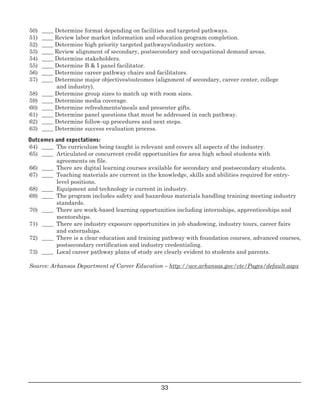


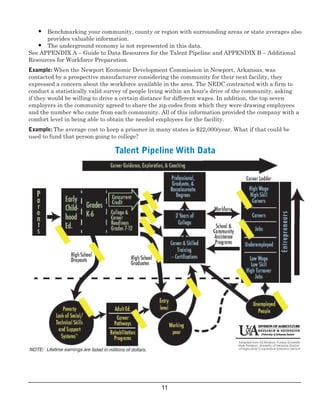
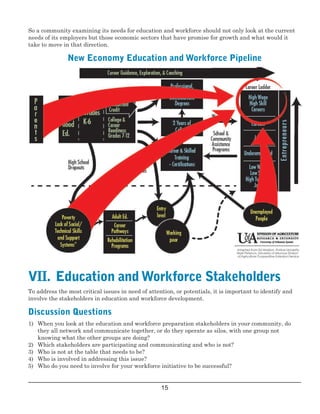
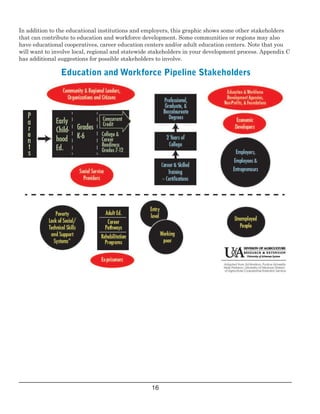
The document outlines the critical importance of education and workforce development in fostering economic growth within communities, highlighting challenges such as shortages of skilled labor and mismatches between education and job requirements. It introduces the concept of a workforce pipeline as a comprehensive model for connecting education and economic needs, while proposing a breakthrough solutions model to enable communities to leverage their assets effectively. The document emphasizes the need for collaboration among local institutions and stakeholders to enhance workforce preparation and create opportunities for job seekers.


