Download to read offline

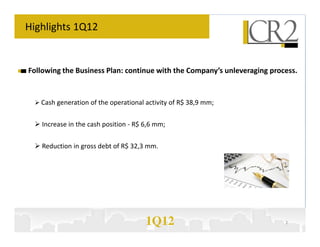
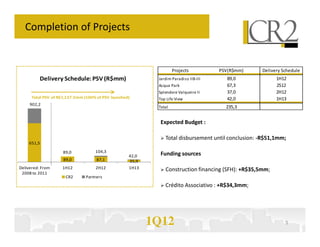
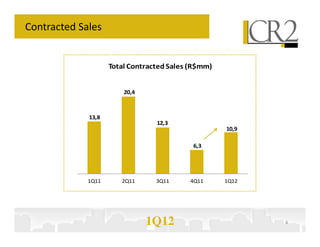
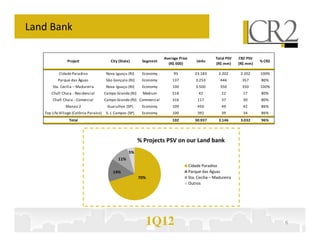
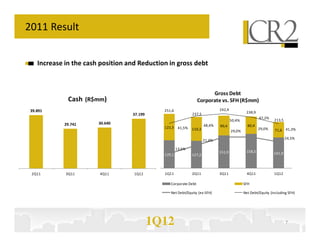
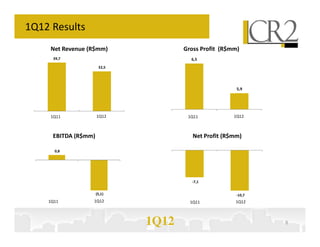
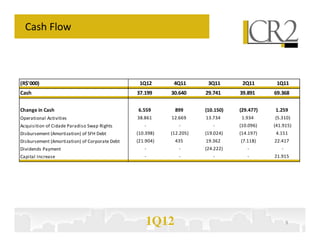

- The company generated R$38.9 million in cash from operations in 1Q12 and increased its cash position by R$6.6 million while reducing gross debt by R$32.3 million. - Four projects are scheduled for completion in 2012 and 2013 with a total PSV of R$235.3 million. - Contracted sales totaled R$20.4 million in 1Q12. - The company has a land bank of 7 projects with a total PSV of R$3.146 billion, of which 96% is from CR2 projects.


![Cr2 apresentação institucional eng - dez-10 - 10-12 [compatibility mode]](https://cdn.slidesharecdn.com/ss_thumbnails/cr2-apresentaoinstitucionaleng-dez-10-10-12compatibilitymode-120614112427-phpapp02-thumbnail.jpg?width=640&height=640&fit=bounds)


