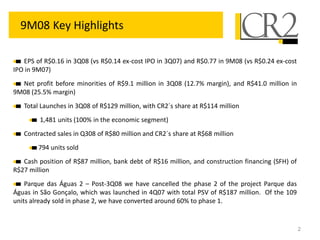
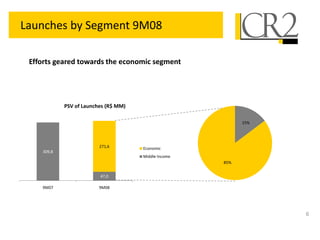
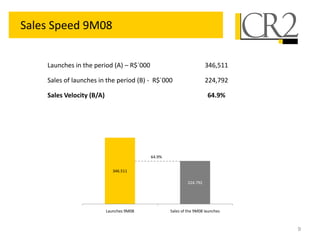
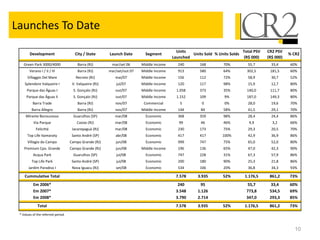
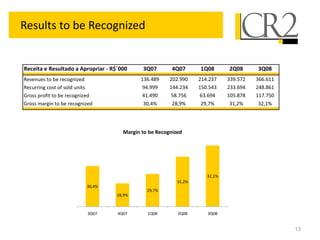
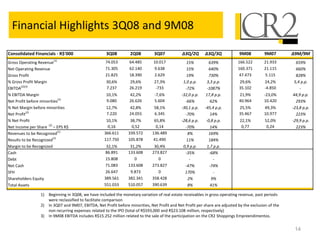
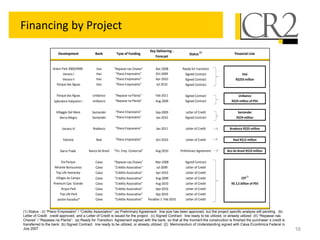
The global outsourcing industry is constantly evolving through new contracting award characteristics and an expanding universe of successful service providers. ISG's TPI Index helps industry participants, enterprises and organizations keep pace and capitalize from the latest data on outsourcing trends. It is the authoritative source for marketplace intelligence related to outsourcing: transaction structures and terms, industry adoption, geographic prevalence and service provider metrics.
Financial Assets: Debit vs Equity Securities.pptxWrito-Finance
financial assets represent claim for future benefit or cash. Financial assets are formed by establishing contracts between participants. These financial assets are used for collection of huge amounts of money for business purposes.
Two major Types: Debt Securities and Equity Securities.
Debt Securities are Also known as fixed-income securities or instruments. The type of assets is formed by establishing contracts between investor and issuer of the asset.
• The first type of Debit securities is BONDS. Bonds are issued by corporations and government (both local and national government).
• The second important type of Debit security is NOTES. Apart from similarities associated with notes and bonds, notes have shorter term maturity.
• The 3rd important type of Debit security is TRESURY BILLS. These securities have short-term ranging from three months, six months, and one year. Issuer of such securities are governments.
• Above discussed debit securities are mostly issued by governments and corporations. CERTIFICATE OF DEPOSITS CDs are issued by Banks and Financial Institutions. Risk factor associated with CDs gets reduced when issued by reputable institutions or Banks.
Following are the risk attached with debt securities: Credit risk, interest rate risk and currency risk
There are no fixed maturity dates in such securities, and asset’s value is determined by company’s performance. There are two major types of equity securities: common stock and preferred stock.
Common Stock: These are simple equity securities and bear no complexities which the preferred stock bears. Holders of such securities or instrument have the voting rights when it comes to select the company’s board of director or the business decisions to be made.
Preferred Stock: Preferred stocks are sometime referred to as hybrid securities, because it contains elements of both debit security and equity security. Preferred stock confers ownership rights to security holder that is why it is equity instrument
<a href="https://www.writofinance.com/equity-securities-features-types-risk/" >Equity securities </a> as a whole is used for capital funding for companies. Companies have multiple expenses to cover. Potential growth of company is required in competitive market. So, these securities are used for capital generation, and then uses it for company’s growth.
Concluding remarks
Both are employed in business. Businesses are often established through debit securities, then what is the need for equity securities. Companies have to cover multiple expenses and expansion of business. They can also use equity instruments for repayment of debits. So, there are multiple uses for securities. As an investor, you need tools for analysis. Investment decisions are made by carefully analyzing the market. For better analysis of the stock market, investors often employ financial analysis of companies.
US Economic Outlook - Being Decided - M Capital Group August 2021.pdfpchutichetpong
The U.S. economy is continuing its impressive recovery from the COVID-19 pandemic and not slowing down despite re-occurring bumps. The U.S. savings rate reached its highest ever recorded level at 34% in April 2020 and Americans seem ready to spend. The sectors that had been hurt the most by the pandemic specifically reduced consumer spending, like retail, leisure, hospitality, and travel, are now experiencing massive growth in revenue and job openings.
Could this growth lead to a “Roaring Twenties”? As quickly as the U.S. economy contracted, experiencing a 9.1% drop in economic output relative to the business cycle in Q2 2020, the largest in recorded history, it has rebounded beyond expectations. This surprising growth seems to be fueled by the U.S. government’s aggressive fiscal and monetary policies, and an increase in consumer spending as mobility restrictions are lifted. Unemployment rates between June 2020 and June 2021 decreased by 5.2%, while the demand for labor is increasing, coupled with increasing wages to incentivize Americans to rejoin the labor force. Schools and businesses are expected to fully reopen soon. In parallel, vaccination rates across the country and the world continue to rise, with full vaccination rates of 50% and 14.8% respectively.
However, it is not completely smooth sailing from here. According to M Capital Group, the main risks that threaten the continued growth of the U.S. economy are inflation, unsettled trade relations, and another wave of Covid-19 mutations that could shut down the world again. Have we learned from the past year of COVID-19 and adapted our economy accordingly?
“In order for the U.S. economy to continue growing, whether there is another wave or not, the U.S. needs to focus on diversifying supply chains, supporting business investment, and maintaining consumer spending,” says Grace Feeley, a research analyst at M Capital Group.
While the economic indicators are positive, the risks are coming closer to manifesting and threatening such growth. The new variants spreading throughout the world, Delta, Lambda, and Gamma, are vaccine-resistant and muddy the predictions made about the economy and health of the country. These variants bring back the feeling of uncertainty that has wreaked havoc not only on the stock market but the mindset of people around the world. MCG provides unique insight on how to mitigate these risks to possibly ensure a bright economic future.
The secret way to sell pi coins effortlessly.DOT TECH
Well as we all know pi isn't launched yet. But you can still sell your pi coins effortlessly because some whales in China are interested in holding massive pi coins. And they are willing to pay good money for it. If you are interested in selling I will leave a contact for you. Just telegram this number below. I sold about 3000 pi coins to him and he paid me immediately.
Telegram: @Pi_vendor_247
Introduction to Indian Financial System ()Avanish Goel
The financial system of a country is an important tool for economic development of the country, as it helps in creation of wealth by linking savings with investments.
It facilitates the flow of funds form the households (savers) to business firms (investors) to aid in wealth creation and development of both the parties
The European Unemployment Puzzle: implications from population agingGRAPE
We study the link between the evolving age structure of the working population and unemployment. We build a large new Keynesian OLG model with a realistic age structure, labor market frictions, sticky prices, and aggregate shocks. Once calibrated to the European economy, we quantify the extent to which demographic changes over the last three decades have contributed to the decline of the unemployment rate. Our findings yield important implications for the future evolution of unemployment given the anticipated further aging of the working population in Europe. We also quantify the implications for optimal monetary policy: lowering inflation volatility becomes less costly in terms of GDP and unemployment volatility, which hints that optimal monetary policy may be more hawkish in an aging society. Finally, our results also propose a partial reversal of the European-US unemployment puzzle due to the fact that the share of young workers is expected to remain robust in the US.
when will pi network coin be available on crypto exchange.DOT TECH
There is no set date for when Pi coins will enter the market.
However, the developers are working hard to get them released as soon as possible.
Once they are available, users will be able to exchange other cryptocurrencies for Pi coins on designated exchanges.
But for now the only way to sell your pi coins is through verified pi vendor.
Here is the telegram contact of my personal pi vendor
@Pi_vendor_247
BYD SWOT Analysis and In-Depth Insights 2024.pptxmikemetalprod
Indepth analysis of the BYD 2024
BYD (Build Your Dreams) is a Chinese automaker and battery manufacturer that has snowballed over the past two decades to become a significant player in electric vehicles and global clean energy technology.
This SWOT analysis examines BYD's strengths, weaknesses, opportunities, and threats as it competes in the fast-changing automotive and energy storage industries.
Founded in 1995 and headquartered in Shenzhen, BYD started as a battery company before expanding into automobiles in the early 2000s.
Initially manufacturing gasoline-powered vehicles, BYD focused on plug-in hybrid and fully electric vehicles, leveraging its expertise in battery technology.
Today, BYD is the world’s largest electric vehicle manufacturer, delivering over 1.2 million electric cars globally. The company also produces electric buses, trucks, forklifts, and rail transit.
On the energy side, BYD is a major supplier of rechargeable batteries for cell phones, laptops, electric vehicles, and energy storage systems.
how can i use my minded pi coins I need some funds.DOT TECH
If you are interested in selling your pi coins, i have a verified pi merchant, who buys pi coins and resell them to exchanges looking forward to hold till mainnet launch.
Because the core team has announced that pi network will not be doing any pre-sale. The only way exchanges like huobi, bitmart and hotbit can get pi is by buying from miners.
Now a merchant stands in between these exchanges and the miners. As a link to make transactions smooth. Because right now in the enclosed mainnet you can't sell pi coins your self. You need the help of a merchant,
i will leave the telegram contact of my personal pi merchant below. 👇 I and my friends has traded more than 3000pi coins with him successfully.
@Pi_vendor_247
The Evolution of Non-Banking Financial Companies (NBFCs) in India: Challenges...beulahfernandes8
Role in Financial System
NBFCs are critical in bridging the financial inclusion gap.
They provide specialized financial services that cater to segments often neglected by traditional banks.
Economic Impact
NBFCs contribute significantly to India's GDP.
They support sectors like micro, small, and medium enterprises (MSMEs), housing finance, and personal loans.
what is the best method to sell pi coins in 2024DOT TECH
The best way to sell your pi coins safely is trading with an exchange..but since pi is not launched in any exchange, and second option is through a VERIFIED pi merchant.
Who is a pi merchant?
A pi merchant is someone who buys pi coins from miners and pioneers and resell them to Investors looking forward to hold massive amounts before mainnet launch in 2026.
I will leave the telegram contact of my personal pi merchant to trade pi coins with.
@Pi_vendor_247
What website can I sell pi coins securely.DOT TECH
Currently there are no website or exchange that allow buying or selling of pi coins..
But you can still easily sell pi coins, by reselling it to exchanges/crypto whales interested in holding thousands of pi coins before the mainnet launch.
Who is a pi merchant?
A pi merchant is someone who buys pi coins from miners and resell to these crypto whales and holders of pi..
This is because pi network is not doing any pre-sale. The only way exchanges can get pi is by buying from miners and pi merchants stands in between the miners and the exchanges.
How can I sell my pi coins?
Selling pi coins is really easy, but first you need to migrate to mainnet wallet before you can do that. I will leave the telegram contact of my personal pi merchant to trade with.
Tele-gram.
@Pi_vendor_247
how to swap pi coins to foreign currency withdrawable.DOT TECH
As of my last update, Pi is still in the testing phase and is not tradable on any exchanges.
However, Pi Network has announced plans to launch its Testnet and Mainnet in the future, which may include listing Pi on exchanges.
The current method for selling pi coins involves exchanging them with a pi vendor who purchases pi coins for investment reasons.
If you want to sell your pi coins, reach out to a pi vendor and sell them to anyone looking to sell pi coins from any country around the globe.
Below is the contact information for my personal pi vendor.
Telegram: @Pi_vendor_247
If you are looking for a pi coin investor. Then look no further because I have the right one he is a pi vendor (he buy and resell to whales in China). I met him on a crypto conference and ever since I and my friends have sold more than 10k pi coins to him And he bought all and still want more. I will drop his telegram handle below just send him a message.
@Pi_vendor_247
Empowering the Unbanked: The Vital Role of NBFCs in Promoting Financial Inclu...Vighnesh Shashtri
In India, financial inclusion remains a critical challenge, with a significant portion of the population still unbanked. Non-Banking Financial Companies (NBFCs) have emerged as key players in bridging this gap by providing financial services to those often overlooked by traditional banking institutions. This article delves into how NBFCs are fostering financial inclusion and empowering the unbanked.
Empowering the Unbanked: The Vital Role of NBFCs in Promoting Financial Inclu...
3 q08 presentation
1. 3Q08 Conference Call Results
Cidade Paradiso (Nova Iguaçu, RJ) – Biggest Undertaking Residential of the Baixada Fluminense
November 11th, 2008
2. 9M08 Key Highlights
EPS of R$0.16 in 3Q08 (vs R$0.14 ex-cost IPO in 3Q07) and R$0.77 in 9M08 (vs R$0.24 ex-cost
IPO in 9M07)
Net profit before minorities of R$9.1 million in 3Q08 (12.7% margin), and R$41.0 million in
9M08 (25.5% margin)
Total Launches in 3Q08 of R$129 million, with CR2´s share at R$114 million
1,481 units (100% in the economic segment)
Contracted sales in Q308 of R$80 million and CR2´s share at R$68 million
794 units sold
Cash position of R$87 million, bank debt of R$16 million, and construction financing (SFH) of
R$27 million
Parque das Águas 2 – Post-3Q08 we have cancelled the phase 2 of the project Parque das
Águas in São Gonçalo, which was launched in 4Q07 with total PSV of R$187 million. Of the 109
units already sold in phase 2, we have converted around 60% to phase 1.
2
3. Business Model
Pure-play developer that outsources construction and brokerage services;
Partnership model with niche “players” :
Projects origination mechanism;
Market analysis;
Low fixed costs (around 80 employees);
Agility/Operational flexibility.
CR2 Focus: Offer products where there is credit availability.
3
4. Segments of Operation
Diversified portfolio to support growing
Economic Middle Income Commercial
12 projects with total PSV of 14 projects with total PSV of 4 projects with total PSV of
R$2.8 billion (R$2.7 billion R$1.1 billion (R$804 million R$1.6 billion (R$565 million
CR2) CR2) CR2)
Main project: Nova Iguaçu
Total PSV of R$2.3 billion
with 32 thousand units (in
phases)
Deal with Caixa for
financing up to R$2.5
billion in PSV The segments are classified by price per m² and
by unit price:
Segment R$ / m² Unit Price
Economic up to 2.200 up to R$ 125 mil
Middle-Income 2.200 - 3.500 R$ 125 – R$ 400 mil
Middle-High 3.500 - 4.500 R$ 400 – R$ 600 mil
High-Income higher than 4.500 higher than R$ 600 mil
4
5. Launches 3T08/9M08
Total launches in 3Q08 of R$129 million, with CR2 s share at R$114 million. In 9M08 we launched
R$347 million of which R$293 million CR2 s share
9 projects launched in 2008: 4 in São Paulo (total PSV of R$164 million, 1,732 units) and 5 in
Rio de Janeiro (total PSV of R$183 million, 2,072 units)
Launches PSV – R$ million
129,4
120,9 347,0
15,5
309,8
53,7
45,2
125,5
113,9
293,3
75,7
184,3
3Q07 3Q08 9M07 9M08
CR2 Partners CR2 Partners
5
6. Launches by Segment 9M08
Efforts geared towards the economic segment
PSV of Launches (R$ MM)
15%
271,6 Economic
309,8
Middle Income
85%
47,0
9M07 9M08
6
7. Launches history
Efforts geared towards the economic segment
3,069
2,741
2,572
1,822
1,716
1,533
7
8. Contracted sales 3T08/9M08
Total contracted sales of R$301 million, with CR2 s share at $239 million
Contracted sales – R$ million
80,4
12,8 301,4
62,3
50,8
50.8
18,4
67,6
136,4
239,1
54,0
32,4
82,4
3Q07 3Q08 9M07 9M08
CR2 Partners CR2 Partners
8
9. Sales Speed 9M08
Launches in the period (A) – R$´000 346,511
Sales of launches in the period (B) - R$´000 224,792
Sales Velocity (B/A) 64.9%
64.9%
346.511
224.792
Launches 9M08 Sales of the 9M08 launches
9
10. Launches To Date
Units Total PSV CR2 PSV
Development City / State Launch Date Segment Units Sold % Units Solds % CR2
Launched (R$ 000) (R$ 000)
Green Park 3000/4000 Barra (RJ) mar/set 06 Middle Income 240 168 70% 55,7 33,4 60%
Verano I / II / III Barra (RJ) mar/set/out 07 Middle Income 913 580 64% 302,5 181,5 60%
Villaggio Del Mare Recreio (RJ) mai/07 Middle Income 156 112 72% 58,9 30,7 52%
Splendore Valqueire I V. Valqueire (RJ) jul/07 Middle Income 120 117 98% 15,9 12,7 80%
Parque das Águas I S. Gonçalo (RJ) out/07 Middle Income 1.058 373 35% 140,0 111,7 80%
Parque das Águas II S. Gonçalo (RJ) out/07 Middle Income 1.152 109 9% 187,0 149,3 80%
Barra Trade Barra (RJ) nov/07 Commercial 5 0 0% 28,0 19,6 70%
Barra Allegro Barra (RJ) nov/07 Middle Income 144 84 58% 41,5 29,1 70%
Mirante Bonsucesso Guarulhos (SP) mar/08 Economic 368 359 98% 28,4 24,4 86%
Via Parque Caxias (RJ) mar/08 Economic 99 46 46% 4,9 3,2 66%
Felicittá Jacarepaguá (RJ) mar/08 Economic 230 173 75% 29,3 20,5 70%
Top Life Itamaraty Santo André (SP) abr/08 Economic 417 417 100% 42,9 36,9 86%
Villagio do Campo Campo Grande (RJ) jun/08 Economic 999 747 75% 65,0 52,0 80%
Premium Cpo. Grande Campo Grande (RJ) jun/08 Middle Income 196 136 65% 47,0 42,3 90%
Acqua Park Guarulhos (SP) jul/08 Economic 747 228 31% 67,3 57,9 86%
Top Life Park Santo André (SP) jul/08 Economic 200 180 90% 25,3 21,8 86%
Jardim Paradiso I Nova Iguacu (RJ) set/08 Economic 534 106 20% 36,8 34,3 93%
Cummulative Total 7.578 3.935 52% 1.176,5 861,2 73%
Em 2006* 240 95 55,7 33,4 60%
Em 2007* 3.548 1.126 773,8 534,5 69%
Em 2008* 3.790 2.714 347,0 293,3 85%
Total 7.578 3.935 52% 1.176,5 861,2 73%
* Values of the referred period.
10
11. Land Bank (to be launched)
Total PSV (R$ CR2's PSV (R$
Development City (State) Segment Units % CR2
MM) MM)
Jardim Paradiso II – III Nova Iguaçu (RJ) Economic 1,283 87.0 80.9 93%
Javri Santo André (SP) Middle 190 33.0 28.4 86%
Colônia Paraíso S. J. Campos (SP) Economic 392 32.0 27.5 86%
Manaú 2 Guarulhos (SP) Economic 420 34.0 29.2 86%
Sta. Cecília – Madureira I Nova Iguaçu (RJ) Economic 1,613 80.0 64.0 80%
Pinheiro Guimarães Rio de Janeiro (RJ) Middle 128 49.0 34.3 70%
Barrartes Rio de Janeiro (RJ) Commercial 507 120.0 84.0 70%
Splendore Valqueire II Rio de Janeiro (RJ) Middle 160 25.0 20.0 80%
Warehouse ABEAR Rio de Janeiro (RJ) Commercial 389 230.0 161.0 70%
Cidade da Barra Rio de Janeiro (RJ) Commercial n.d. 1,200.0 300.0 25%
Pq. das Águas III São Gonçalo (RJ) Middle 492 84.0 67.2 80%
Pq. das Águas IV São Gonçalo (RJ) Middle 942 84.0 67.2 80%
Sta. Cecília – Madureira II Nova Iguaçu (RJ) Economic 1,612 80.0 64.0 80%
Cidade Paradiso Nova Iguaçu (RJ) Economic 30,183 2,180.0 2,180.0 100%
Total 38,311 4,318.0 3,207.8 74%
11
12. Land Bank by Segment (to be launched)
Total PSV CR2's PSV Units % Land Cost
Segment Physical Financial
RS (MM) % RS (MM) % Qty % Cash
Swap Swap
Economic 2.493,0 58% 2.445,7 76% 35.503 93% 0% 90% 10%
Middle 275,0 6% 217,1 7% 1.912 5% 64% 0% 36%
Commercial 1.550,0 36% 545,0 17% 896 2% 42% 0% 58%
Total 4.318,0 3.207,8 38.311 15% 60% 25%
Land Bank - PSV CR2
17%
Economic
7%
Middle Income
Commercial
76%
12
13. Results to be Recognized
Receita e Resultado a Apropriar - R$´000 3Q07 4Q07 1Q08 2Q08 3Q08
Revenues to be recognized 136.489 202.990 214.237 339.572 366.611
Recurring cost of sold units 94.999 144.234 150.543 233.694 248.861
Gross profit to be recognized 41.490 58.756 63.694 105.878 117.750
Gross margin to be recognized 30,4% 28,9% 29,7% 31,2% 32,1%
Margin to be Recognized
32,1%
31,2%
30,4%
29,7%
28,9%
3Q07 4Q07 1Q08 2Q08 3Q08
13
14. Financial Highlights 3Q08 and 9M08
Consolidated Financials - R$'000 3Q08 2Q08 3Q07 ∆3Q/2Q ∆3Q/3Q 9M08 9M07 ∆9M/9M
(1)
Gross Operating Revenue 74.053 64.485 10.017 15% 639% 166.522 21.933 659%
Net Operating Revenue 71.305 62.140 9.638 15% 640% 160.371 21.115 660%
Gross Profit 21.825 18.390 2.629 19% 730% 47.473 5.115 828%
% Gross Profit Margin 30,6% 29,6% 27,3% 1,0 p.p. 3,3 p.p. 29,6% 24,2% 5,4 p.p.
EBITDA(2)(3) 7.237 26.219 -733 -72% -1087% 35.102 -4.850 -
% EBITDA Margin 10,1% 42,2% -7,6% -32,0 p.p. 17,8 p.p. 21,9% -23,0% 44,9 p.p.
Net Profit before minorities(2) 9.080 26.626 5.604 -66% 62% 40.964 10.420 293%
% Net Margin before minorities 12,7% 42,8% 58,1% -30,1 p.p. -45,4 p.p. 25,5% 49,3% -23,8 p.p.
Net Profit(2) 7.220 24.055 6.345 -70% 14% 35.467 10.977 223%
% Net Profit 10,1% 38,7% 65,8% -28,6 p.p. -0,8 p.p. 22,1% 52,0% -29,9 p.p.
Net Income per Share (2) – EPS R$ 0,16 0,52 0,14 -70% 14% 0,77 0,24 223%
Revenues to be Recognized(1) 366.611 339.572 136.489 8% 169%
Results to be Recognized(1) 117.750 105.878 41.490 11% 184%
Margin to be Recognized 32,1% 31,2% 30,4% 0,9 p.p. 1,7 p.p.
Cash 86.891 133.608 273.827 -35% -68%
Debt 15.808 0 0 - -
Net Cash 71.083 133.608 273.827 -47% -74%
SFH 26.647 9.873 0 170% -
Shareholders Equity 389.561 382.341 358.428 2% 9%
Total Assets 551.033 510.057 390.639 8% 41%
1) Beginning in 3Q08, we have included the monetary variation of real estate receivables in gross operating revenue, past periods
were reclassified to facilitate comparison
2) In 3Q07 and 9M07, EBITDA, Net Profit before minorities, Net Profit and Net Profit per share are adjusted by the exclusion of the
non recurring expenses related to the IPO (total of R$593,000 and R$23.108 million, respectively)
3) In 9M08 EBITDA includes R$15.252 million related to the sale of the participation on the CR2 Shoppings Empreendimentos.
14
16. Financing by Project
Key Delivering -
Development Bank Tyoe of Funding Status (1) Financial Line
Forecast
Green Park 3000/4000 Itaú "Repasse nas Chaves" Dec-2008 Ready for transition
Verano I Itaú "Plano Empresário" Oct-2009 Signed Contract Itaú
Verano II Itaú "Plano Empresário" Apr-2010 Signed Contract R$250 million
Parque das Águas Itaú "Plano Empresário" Jul-2010 Signed Contract
Parque das Águas Unibanco "Repasse na Planta" Feb-2011 Signed Contract Unibanco
Splendore Valqueire I Unibanco "Repasse na Planta" Aug-2009 Signed Contract R$29 million of PSV
Villaggio Del Mare Santander "Plano Empresário" Sep-2009 Letter of Credit Santander
Barra Allegro Santander "Plano Empresário" Jan-2010 Signed Contract R$29 million
Verano III Bradesco "Plano Empresário" Jan-2011 Letter of Credit Bradesco R$35 million
Felicittá Real "Plano Empresário" Oct-2010 Letter of Credit Real R$12 million
Barra Trade Banco do Brasil "Fin. Emp. Comercial" Aug-2010 Preliminary Agreement Bco do Brasil R$10 million
Via Parque Caixa "Repasse nas Chaves" Mar-2008 Signed Contract
Mirante Bonsucesso Caixa "Crédito Associativo" Jul-2009 Letter of Credit
Top Life Itamaraty Caixa "Crédito Associativo" Apr-2010 Letter of Credit
Villagio do Campo Caixa "Crédito Associativo" Aug-2009 Letter of Credit CEF(2)
Premium Cpo. Grande Caixa "Crédito Associativo" Aug-2010 Letter of Credit R$ 2,5 billion of PSV
Acqua Park Caixa "Crédito Associativo" Sep-2010 Letter of Credit
Top Life Park Caixa "Crédito Associativo" Sep-2010 Letter of Credit
Jardim Paradiso* Caixa "Crédito Associativo" Paradiso 1: Feb-2010 Letter of Credit
(1) Status - (I) “Plano Empresário” / “Crédito Associativo”: (a) Preliminary Agreement: line size has been approved, but the project specific analysis still pending. (b)
Letter of Credit: credit approved, and a Letter of Credit is issued for the project. (c) Signed Contract: line ready to be utilized, or already utilized (II) “Repasse nas
Chaves” / “Repasse na Planta”: (a) Ready for Transition: Agreement signed with the bank, so that at the moment the construction is finished the purchaser´s credit is
transferred to the bank. (b) Signed Contract: line ready to be utilized, or already utilized (2) Memorandum of Understanding signed with Caixa Econômica Federal in
July 2007. 16
18. IR Contact
Investors Relations
Rogério Furtado
CFO and IR Officer
Daniel Grozdea
IR Manager
www.cr2.com.br/ir
phone: (21) 3095-4600
(21) 3031-4600
18
19. Disclaimer
This presentation contains certain statements that are neither reported financial results or other historical information. They
are forward-looking statements.
Because these forward-looking statements are subject to risks and uncertainties, actual future results may differ materially
from those expressed in or implied by the statements. Many of these risks and uncertainties relate to factors that are
beyond CR2´s ability to control or estimate precisely, such as future market conditions, currency fluctuations, the behavior of
other market participants, the actions of governmental regulators, the Company's ability to continue to obtain sufficient
financing to meet its liquidity needs; and changes in the political, social and regulatory framework in which the Company
operates or in economic or technological trends or conditions, inflation and consumer confidence, on a global, regional or
national basis.
Readers are cautioned not to place undue reliance on these forward-looking statements, which speak only as of the date of
this document. CR2 does not undertake any obligation to publicly release any revisions to these forward looking statements
to reflect events or circumstances after the date of this presentation.
19