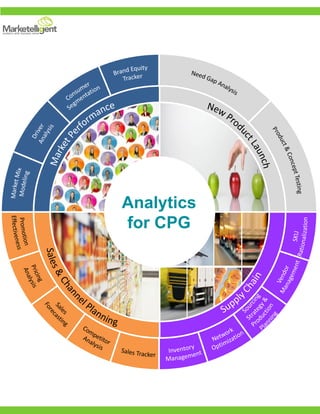
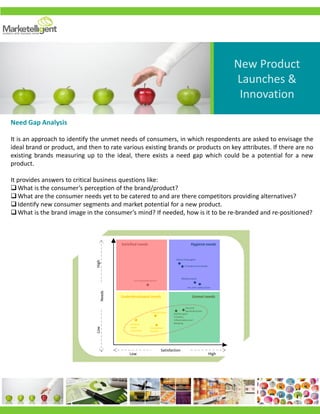
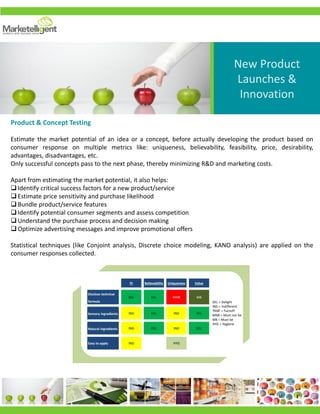
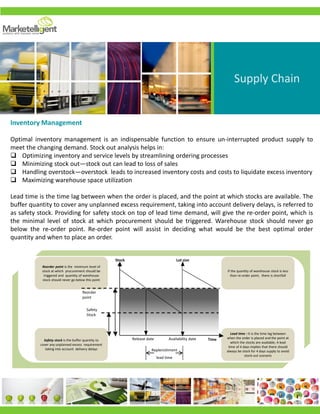
Marketelligent provides analytic services to help Consumer Packaged Goods (CPG), Manufacturing, and Retail companies make better business decisions. Their services include optimizing marketing investments, managing product pricing and promotions, rationalizing stock keeping units, understanding markets and shopper behavior, and designing supply chains and distribution networks. They offer global analytic capabilities leveraging domain expertise to maximize sales and profits.
The document discusses the role of analytics in the consumer packaged goods (CPG) industry. It notes that analytics can help CPG companies with pricing strategies, optimizing marketing mix, portfolio optimization, inventory management, and other areas. Analytics provides insights into profit drivers, demand elasticity, trade spend effectiveness, and more. It concludes that CPG companies must invest in analytics to stay competitive as consumer behavior changes rapidly.
Accenture: Commercial analytics insights CPG Companies 27-7-12 Brian Crotty
A fully integrated analytics operating model can help consumer packaged goods (CPG) companies focus commercial analytics resources on high-value processes to grow market share and sustain profit margins.
Market and economic uncertainty is making it difficult for CPG companies to achieve sustainable growth. Value-driven consumers are more demanding than ever before, and retailers are increasingly pushing private labels and looking for ways to control the consumer relationship. Additionally, “big data” has left many marketing and sales organizations with an information overload, yielding little insight into how to win consumer loyalty. This uncertain environment requires CPG companies to make faster, better-informed commercial decisions and take concrete action to improve market performance.
In this point of view, Accenture outlines an approach that can help CPG companies improve their commercial analytics capability to generate significant value.
June 27, 2012
Creating Business Value - Use Cases in CPG/RetailBig Data Pulse
This document discusses how big data analytics can help consumer packaged goods, fast moving consumer goods, retail, and e-commerce companies. It provides examples of use cases like predictive demand forecasting, pricing optimization, and markdown optimization. One case study describes how a department store used a forecasting and optimization model to improve markdown strategies and increase margins by $90 million annually. In conclusion, analyzing large, diverse customer data in real-time can provide actionable insights to increase market share, revenue and profits.
Insights Throughout the CPG Brand LifecycleNM Incite
NM Incite’s social media research and analytics offer brands insight into real-time, authentic consumer expression that can transform how marketers build strong brands, create passionate and engaged communities and ultimately achieve superior sales outcomes. Learn how NM Incite’s solutions can be layered with other Nielsen assets to produce powerful insights, providing a valuable competitive advantage.
Business intelligence (BI) helps businesses in various ways. For fast moving consumer goods companies, BI helps increase customer relationships, respond quickly to market changes, and launch new products faster. For retailers, BI helps align operations around revenue and profitability, identify and analyze trends, and increase cost savings through benchmarking. A US food distribution major uses BI for strategic goals like demand management, sales force effectiveness, trade promotion effectiveness, and supplier performance analysis.
Cross-selling in the New Era: A Win-win for Banks and Customersaccenture
In this new Accenture document we discuss how banks can reinvent cross-selling. The presentation introduces a sales paradigm that serves the financial well-being of customers better and demonstrates a bank's value as a trusted advisor. For more information, read our blog post on bank cross-selling: bit.ly/2hLpxO1
Digital Collaboration between Retailers-ManufacturersAnthony Levesanos
1) The document discusses obstacles that hinder effective digital collaboration between retailers and manufacturers, such as divergent agendas, lack of trusted data, information asymmetry, and shallow customer knowledge.
2) It proposes a collaboration framework to overcome these obstacles, including agreeing on strategic objectives and priorities, sharing a common set of data and metrics, using data-driven insights, and establishing time-bound and balanced metrics.
3) The framework emphasizes starting with deep customer understanding, optimizing supply chains, and monitoring execution and results through a shared analytics platform and coordinated processes.
The document discusses various analytics techniques used in retail decision making including store layout planning, merchandising, assortment optimization, sales forecasting, inventory management, vendor management, loyalty analytics, pricing analysis, promotion optimization, and market basket analysis. The key goal of applying these decision science techniques is to maximize revenue, sales, footfalls, and profitability through optimal allocation of space, inventory, pricing, promotions and understanding of consumer purchasing behavior.
Analytics For Retail Banking - MarketelligentMarketelligent
MarketIntelligent provides analytic services to help clients make better business decisions. They offer expertise in credit risk and marketing analytics across various banking products. Their services include developing scorecards to predict customer behavior, maximize profits from assets and fees, reduce losses, acquire profitable customers, increase activation and cross-sell revenues.
Driving Marketing Efficiency In The Consumer Goods Business With Advanced Ana...Gina Shaw
"Information is the oil of the 21st century, and analytics is the combustion engine" – Gartner
A large percentage of marketing efforts in a consumer goods business has little to no impact on sales. One primary reason for low-yield marketing campaigns is the inability to leverage data. Success in the consumer goods industry largely depends on the speed and accuracy of decision-making.
This eBook will help you discover:
1. Challenges marketers face in in the consumer goods business
2. The current state of marketing analytics
3. The overview and importance of advanced analytics
4. Traditional analytics vs advanced analytics
5. Advanced analytics solutions use cases in the areas of
- Measuring marketing effectiveness
- Optimizing marketing and advertising spend
- Sales forecasting
- Product portfolio management
- Marketing mix modelling
6. Driving analytics adoption within your organization with AI
7. Case study: How a global CPG company reduced marketing spend by 5% with advanced analytics
8. How you can get started right away?
Business Intelligence for FMCG BusinessLi Ken Chong
Empower the FMCG business with data framework to consolidate Modern Trade & General Trade business information into a single repository for performance review around sales, distribution channel, inventory efficiency and many more KPI driven analysis.
The document discusses the use of business intelligence (BI) in the fast-moving consumer goods (FMCG) and retail industries. It outlines key performance indicators and frameworks for BI systems in retail. It also describes data modeling approaches for retail scenarios and discusses how BI can help address challenges and questions in areas like inventory, pricing, promotions and customer analytics. Major trends include increased competition and expectations, and the need for greater organizational alignment through BI.
Arun Gupta, Customer Care Associate and Group Chief Technology Officer, Shoppers Stop presented at the Premier Business Leadership Series 2010, http://www.sas.com/theserieshk.
With many retailers worldwide struggling to maintain revenues, how do you grow in such a tough competitive landscape? As a leading Indian retailer and pioneer in using technology, especially business analytics, Shoppers Stop is not only thriving but has helped revolutionise the retail sector. Gupta will share insights on using analytics to drive business value, reduce operational costs and provide better products and customer experience.
How An AI-Powered Trade Promotion Optimization Software Can Improve Consumer ...Gina Shaw
Artificial Intelligence (AI) will happen in both TPx and Retail Execution sooner than you probably think – Promotion Optimization Institute
According to Nielsen Holdings, 40% of Consumer Goods trade promotion spending doesn’t drive the desired results. Even though the trade promotions spend take up a lion’s share of the organizational revenue, traditionally manufacturers have always struggled in optimizing their promotion mix for the maximum bang for the buck.
With the advancements in AI technologies, it is now possible to powerfully harness data and run high-yield trade promotions.
What You Can Expect From The eBook?
1. Key Trade Promotion Optimization (TPO) challenges faced today
2. What is AI in the context of TPO?
3. How AI helps run profitable trade promotions?
4. What an AI-Powered analysis looks like?
5. Case-studies
6. How you can get started right away!
VIAPROM provides Analytics Solutions which involved deep problem solving and usage of a range of statistical techniques from regression to ML based models for Clients in Retail industries across the world.
The document describes JAGGAER ONE, a procurement platform that offers end-to-end spend management from source to pay. It provides modular solutions on a single digital platform to streamline sourcing, contracting, procurement, supplier management, and payment processes. Key features include spend analytics, category management, supplier enablement, automated workflows, and tailoring to different industries and spend categories. The goal is to help organizations gain better visibility, control, and value across procurement through a comprehensive and flexible platform.
"Marketing Analytics and Applications": Course IntroductionMasao Kakihara
This document outlines the course introduction for the MITB - B.11 Marketing Analytics and Applications course. The instructor, Masao Kakihara, introduces himself and provides an overview of the course objectives, topics, structure and evaluation. Key topics to be covered include trends in marketing analytics, macro/micro environments, and challenges of data abundance. The course will help students understand marketing analytics landscapes, integrate various data methodologies and translate data into actionable strategies.
The retail industry is undergoing a massive transformation driven by consumers' adoption of new digital technologies. By 2020, brick-and-mortar retailers will need to fundamentally change how they do business to survive. Seven key trends will impact brick-and-mortar stores: leveraging social media data; embracing "showrooming"; tailoring store inventories; rationalizing store sizes; using mobile technologies; fulfilling online orders from stores; and developing "dark stores" for online order fulfillment. To adapt, retailers must implement an integrated online and in-store shopping experience, understand demand across all channels, customize product assortments for each customer, and enable flexible, real-time supply chains.
Moving Forward with Big Data: The Future of Retail AnalyticsBill Bishop
Out new report Moving Forward with Big Data: The Future of Retail Analytics goes deeper into new territory that's relevant to changes taking place across retailing.
It calls out significant progress in the past 9 months.
• The definition of big data has grown beyond technical, i.e. “what it is,” to include “what it does.”
• A lot more companies are executing big data projects (an increase from < 20% to now 65% of sample respondents).
• Most of the focus is on driving top line growth.
S&OP and Demand Management 2016 Summary Charts - 16 AUG 2016Lora Cecere
Summary: S&OP and Demand Management Study Summary Charts. Based on an online survey conducted by Supply Chain Insights (February 12-May 26, 2016). The objective of the survey was to understand the current state of decision-making processes (S&OP and demand management were the focus) and their respective technologies. The results are among 79 respondents: manufacturers, distributors, and retailers who are familiar with the S&OP and/or demand management processes at their company.
The document discusses 5 ways that retail CEOs can increase corporate profits through strategic information management. It outlines initiatives to 1) speed time to market for new products, 2) reduce costly product returns, 3) optimize inaccurate inventory levels, 4) streamline the expensive supplier onboarding process, and 5) improve up-sell and cross-sell conversions. A strategic information management platform provides a single source of product truth across systems to enable these initiatives.
Top 20 Reasons Why Agent-based Modeling is Disrupting Marketing MixThinkVine
Misallocated ad dollars may be costing brands more than 25 percent in lost sales. Based on an analysis of ThinkVine customers with average annual sales of more than $1 billion, we found that companies were spending too much or too little on specific media 85 percent of the time. By optimizing their marketing budgets, the companies added anywhere from 7 to 81 percent in additional revenue attributed to marketing activities – an average of 28 percent.
Don’t lose out on the additional sales your marketing could be driving. Brands have been relying too heavily on outdated, backward-looking marketing mix methods that leave money on the table.
Companies are now turning to agent-based modeling to make better strategic decisions that will deliver the results they need, and here is why.
If you have a retail product that needs a sales boost or you're launching a new product - you should consider a custom designed and manufactured point of sale product display unit.
Big data why big data is huge for CPG manufacturersJanet Dorenkott
CPG manufacturers need to understand big data and understand the value of big data. This presentation explains big data, the evolution of big data and how big data can be used.
Spatial Processing with SAP HANA Infographic shows the different spatial data types, functions, services, and content available natively on the platform and also delivered via 3rd party mapping services. For more information please visit saphana.com/spatial
This document provides a summary of Gilt's performance for Luxury Link and outlines their merchandising strategy for Q2. It shows that Gilt drives a significant portion of traffic and sales. Data on customer demographics, behaviors, and best performing content is analyzed. Actions taken include changes to site tiles, emails, and landing pages based on learnings. The ongoing Q2 plan is to regularly audit analytics, adjust merchandising calendars, and test themes and destinations with a focus on high value customers and international members.
CPG Innovation From Ideation to Aisle: New Techniques for Staying Ahead of Co...Instantly
Eighty-five percent of new products fail. How do you beat those odds? Instantly VP of Product Innovation Justin Wheeler and Supermarket Guru Phil Lempert offer up different solutions to make sure your next new product avoids failure.
Click here for the full recording of Wheeler and Lempert during our August 6, 2015 webinar: http://bit.ly/1P7zL2c
The document discusses challenges facing retail, consumer packaged goods, travel, and logistics firms. It outlines four key challenges: unifying the business ecosystem dealing with customers, streamlining complex supply chains, ensuring operational and process efficiency, and leveraging social media intelligence. It then describes Mahindra Satyam's solutions to address these challenges, including offerings for order management, extending legacy systems, customer service, working capital reduction, location-based mobility, and using social media for business intelligence. The solutions aim to provide greater agility, operational efficiency, improved time to market, on-demand content, and location-based responses to patients.
SAP HANA & HADOOP Implementation - Predictive Analytics – CPG and Retail on U...Cloneskills
• Objective of this demonstration is to provide enough functional and technical details about our pre-configured SAP HANA enabled predictive analytics on SAP COPA and social media data - “Big Data”
• In this demonstration we will be presenting the out of the box analytics capabilities of SAP HANA. Viewers will learn on how our pre-packaged solutions will cut-down the implementation time, and risk with low predictable cost
• An ideal Advanced Analytics solution should have the capability to extract business values from unstructured information and convert that into actionable insight. We will show how to analyze and integrate an un-structured social media data to provide valuable insight on customer behavior and sales trends. All these on our hosted solutions over an Amazon cloud infrastructure
• Our readily deployable solutions uses the new features of SAP HANA 1.0 SPS5 including the new Text Analysis engine for entity extraction (for example persons, locations, products), and "Voice of Customer" fact extraction (for example sentiments, requests, topics)
CPG Companies: Evolving Your Analytics-driven Organizationsaccenture
Accenture surveyed 90 large, global consumer packaged goods companies and found three important dimensions toward building an analytics-driven organization.
Read our other analytics research on accenture.com: http://www.accenture.com/CPGanalytics
The document discusses the use of procurement analytics. It begins by explaining what procurement analytics is and why organizations should use it. Analytics can increase demand forecasting accuracy and contract negotiation power. The document then discusses how analytics can be applied in areas like vendor evaluation, spend analysis, and demand forecasting. It also outlines challenges to implementation and provides recommendations for next steps like gaining leadership support, collaborating cross-functionally, developing skills, and integrating systems.
Big Data in Retail - Examples in ActionDavid Pittman
This use case looks at how savvy retailers can use "big data" - combining data from web browsing patterns, social media, industry forecasts, existing customer records, etc. - to predict trends, prepare for demand, pinpoint customers, optimize pricing and promotions, and monitor real-time analytics and results. For more information, visit http://www.IBMbigdatahub.com
Follow us on Twitter.com/IBMbigdata
Tridant for FMCG - Data Analytics and PlanningRana Banerji
Looking to transform your FMCG business into a more competitive organisation using analytics and planning. This documents shares details on some of initiatives that can be done using Big Data Analytics, AI, Forecasting, Planning, Data Visualisation and Predictive Algorithms
This document discusses inventory optimization strategies for companies. It begins by stating that optimal inventory levels balance inventory costs, service levels, and sales. It then explores key drivers of inventory optimization, including sales and operations planning, inventory management, demand planning, vendor management, and key performance indicators. The document emphasizes that inventory optimization requires balancing inventory reduction with maintaining adequate service levels.
- Purchasing organizations must become both strategic and tactical by understanding customer needs, improving response times, having an educated workforce, and focusing on continuous supply chain improvements.
- To succeed in the 21st century, purchasing departments must forge supplier alliances, develop best-in-class global suppliers, and improve processes to support business goals.
- Purchasing is undergoing changes like department name changes to reflect an increased focus on strategic sourcing, global procurement, and supply chain management.
Module 16 - The Role of Data Systems and Tools in Internal and External Analy...caniceconsulting
This document outlines various metrics and key performance indicators (KPIs) that can be monitored within a company to identify early signs of issues or opportunities for improvement. It discusses KPIs related to human resources, research and development, procurement, operations, outbound logistics, marketing and sales, customer service, and a minimum set of core indicators that should always be monitored including sales, procurement, financials, employees, production, and external factors. Monitoring these internal data sources can help generate important information about the state of the company over time.
This document discusses improving supply chain performance by linking it to the balanced scorecard. It outlines current supply chain measures and perspectives in the balanced scorecard. It then proposes linking the two by identifying performance measures that align the internal, financial, innovation/learning, and customer perspectives of the balanced scorecard with goals like unit cost reduction, time reduction, waste reduction, and flexible response in the supply chain. Aligning key performance indicators across these perspectives can help optimize supply chain performance.
The document discusses supply chain best practices and provides an overview of key topics including metrics, inventory velocity, cycle time compression, lean logistics, technology, supplier performance, and segmenting supply chains. It emphasizes that companies should develop multiple, tailored supply chain approaches rather than a one-size-fits-all model in order to improve flexibility, responsiveness, and demand planning. Metrics like inventory turns and reducing cycle times are important for optimizing supply chain performance.
The Supply Chain Management has the potential to improve Company’s competitiveness. Supply chain capability is as important to a company's overall strategy as overall product strategy. It encourages management of processes across departments. By linking supply chain objectives to company strategy, decisions can be made between competing demands on the supply chain. The impact of managing overall product demand and the supply of product will impact the profitability of the company.
IronStar Consulting provides procurement consulting services to help clients reduce costs and improve profitability. They have an experienced team with expertise in various sectors. IronStar analyzes all areas of a client's spending to identify savings opportunities. They use a Return on Invested Capital model where they only earn fees from actual savings achieved. IronStar implements best practices and works with clients on a strategic and long-term basis to continuously realize procurement savings.
The document discusses how supply chain analytics can help organizations optimize their supply chain operations. It describes how the changing role of consumers has impacted supply chains and the need for collaboration, visibility, and efficiency across the supply chain. It then provides examples of different types of supply chain analytics and insights organizations can gain in areas like executive dashboards, supply chain design, demand forecasting, pricing, inventory management, and more. It also provides a brief case study of how Team Computers implemented an analytics solution for Parle Products to track stock levels, sales, and shortfalls.
The document discusses lean supply chain management and its benefits for companies. It outlines key elements of a lean supply chain including procurement, manufacturing, logistics, demand management, and information technology. Implementing a lean supply chain can help companies reduce costs, become more responsive to customers, and improve overall profitability. Critical to success is understanding customer needs, having the right systems and expertise in place, and removing inconsistencies across the supply chain.
Supply At the most fundamental level, supply chain management (SCM) is management of the flow of goods, data, and finances related to a product or service, from the procurement of raw materials to the delivery of the product at its final destination managementThe Top-level of this model has five different processes which are also known as components of Supply Chain Management – Plan, Source, Make, Deliver and ReturnINTEGRATION. Integration starts at your strategic planning phase and is critical throughout your communications and information sharing and data analysis and storage. ...
OPERATIONS. ...
PURCHASING. ...
DISTRIBUTIONHere are six types of supply chain models that can drive supply chain management for a business:
Continuous Flow. This is one of the most traditional models on the list. ...
Fast chain. The fast chain model is one of the new names in supply chain strategies. ...
Efficient Chain. ...
Agile. ...
Custom-configured. ...
FlexibleThere are three main flows of supply chain management: the product flow, the information flow, and the finances flow. The Product Flow – The product flow involves the movement of goods from a supplier to a customer. This supply chain management flow also concerns customer returns and service needsSupply chain management is the process of delivering a product from raw material to the consumer. It includes supply planning, product planning, demand planning, sales and operations planning, and supply management.Adapt Supply Chain to Customer's Needs. ...
Customize Logistics Network. ...
Align Demand Planning Across Supply Chain. ...
Differentiate Products Close to Customer. ...
Outsource Strategically. ...
Develop IT that Support Multi-Level Decision Making. ...
Adopt Both Service and Financial MetricsIntegration, operations, purchasing and distribution are the four elements of the supply chain that work together to establish a path to competition that is both cost-effective and competitive. Communicating and collaborating with all parties is a business strategy that eliminates errors and saves money.Buying products or services. Purchasing is a key component of any procurement role. ...
Managing procurement processes. ...
Supplier relations. ...
Understand business goals and objectives. ...
Policy management. ...
Sustainability & Ethics. ...
Manufacturing. ...
Merchandising.Four major steps of manufacturing are: Protect raw materials, components, and finished goods during storage, handling, and transportation by using appropriate packaging. Assemble raw materials and components into a final product. Test and improve the final product. Remove disposable components and waste.The best way to understand the various stages of supply chain management and their influence on one another is to take a look at the three levels of supply chain management: the strategic level, the tactical level, and the operational levelShippers' Top 5 Supply Chain Challenges:
Keeping transportation costs down.
Keeping up with customer/i
LOGISTICS AND SUPPLY CHAIN MANAGEMENT.pptxranganayaki10
The document discusses supply chain management. It defines supply chain management as the process of delivering a product from raw material to the consumer. It notes that supply chain management includes planning, sourcing, production, delivery, and handling customer complaints. It also discusses the importance of supply chain management in improving customer satisfaction and business performance. Finally, it outlines the key components of an effective supply chain management process.
The document discusses using inventory modeling to develop a holistic inventory strategy. It describes how companies aim to improve service levels while reducing inventory levels, but it is difficult to do both simultaneously without modeling. The document outlines factors like demand variability, supply chain complexity, different types of inventory levels, and demand patterns that must be considered in developing an effective inventory strategy. It provides an example of how modeling helped a manufacturer optimize inventory levels at dealers and distribution centers.
- Inventory is held for various reasons like covering process time, allowing for decoupling of processes, and buffering against uncertainties in demand, supply, delivery, and manufacturing.
- There are strategic, tactical, and operational decisions around inventory including what to carry, where to hold it, and how much.
- An effective inventory strategy consists of analytics, transparency into current and desired states, and accountability through metrics and reviews.
- Inventory should be classified and optimized based on part behavior and importance, balancing costs and service levels.
The document discusses strategies for managing strategic supplier relationships and collaboration. It outlines key questions purchasing officers should consider around understanding their supply base and spend. It then covers the strategic sourcing process, including analyzing spend, identifying requirements, analyzing the market, developing a strategy, managing negotiations, awarding contracts, and implementing the strategy. It also discusses optimizing the supplier base, performing supplier financial analysis, managing risk, and improving supplier performance.
This document discusses strategic sourcing, which involves analyzing an organization's spending to make more effective business decisions about acquiring commodities and services. It outlines the mission, goals, and critical success factors of strategic sourcing, including executive sponsorship, end user involvement, data integrity, appropriate technology use, and continuous process improvement. A roadmap is provided that shows how strategic sourcing can increase customer satisfaction and significantly reduce costs through implementing best practices, identifying opportunities, and technology.
The document discusses how retail energy providers can apply decision science techniques like forecasting, predictive modeling, segmentation, and optimization to improve operations in areas such as demand planning, customer acquisition, loyalty analytics, campaign management, product design, and driving profitability. It provides examples of how these techniques are used to more accurately predict demand, target high value customers, increase customer lifetime value, optimize marketing spend, and reduce costs like bad debt. The goal is to help energy providers better manage risks, increase revenues and margins, and make more informed business decisions.
Marketelligent Capabilities & Offerings for Sales AnalyticsMarketelligent
The document summarizes Marketelligent's capabilities in sales analytics for consumer packaged goods (CPG) companies. It provides examples of how Marketelligent helps clients track sales performance, identify drivers of share loss, and conduct pricing simulations. Marketelligent also offers forecasting, trade promotion optimization, market mix modeling, and SKU rationalization to improve business decisions. The management team descriptions suggest Marketelligent provides data-driven consulting services to consumer industries globally.
The document discusses applying decision science techniques to solve various business problems in customer relationship management. It covers topics like prospect targeting and acquisition, customer segmentation, profitability and loyalty analysis, cross-selling and upselling strategies, campaign management, customer lifetime value analysis, and customer retention through churn management. Decision science helps businesses make targeted decisions at each customer lifecycle stage to optimize acquisition, usage, retention, and customer lifetime value.
Analytics in action - How Marketelligent helped increase customer engagement ...Marketelligent
The client is a US-based database publisher with 12-15 products for enterprise markets including research documents, tools to aid research processes, databases on new technologies and partners. The task is to build cross-sell and up-sell strategies to identify customers likely to purchase additional products or upgrade to higher versions. An analytical framework using market basket analysis scores each customer and product to generate targeted recommendations, resulting in an 18% revenue increase from current customers in the first two quarters of 2013 compared to the previous year.
Analytics in action - How Marketelligent helped an Online Remittance firm ide...Marketelligent
The client, an online remittance service provider, faced issues with fraud and money laundering that slowed transaction processing. They developed a risk scoring model using transaction history and other data to automatically classify transactions as low, moderate, high, or extremely high risk. Transactions classified as moderate or higher risk would require manual review, reducing review volume by over 500 per day and cutting processing time in half. The model helped compliance staff focus their manual reviews on higher-risk cases.
Analytics in Action - How Marketelligent helped a Beverage Manufacturer bette...Marketelligent
A beverage manufacturer needed to accurately forecast daily empty bottle returns for 10 SKUs to optimize production planning. They developed predictive models using 2 years of returns data and techniques like ARIMA, Holt Winters, and year-on-year growth. The models achieved 75% accuracy on average for May-June 2011 forecasts, and 92% accuracy for the highest-return SKU specifically. This significantly improved upon existing forecasting methods.
Analytics in Action - How Marketelligent helped a Bank validate a Predictive ...Marketelligent
The client, a subsidiary of an insurance and financial services group, wanted to validate a predictive collection model. The task was to evaluate the model's performance on new data by comparing key metrics from model development to those from a validated sample. Results showed the development and validation metrics were aligned, indicating the model still performs well at predicting collection outcomes. Key metrics like ROC, GINI, and lift remained consistent between the samples, concluding the model retains good predictive power.
The document discusses how analytics can be used to solve business problems in the retail banking industry. It describes how analytics can be applied to various areas of a bank's profit and loss statement, including acquiring new customers, reducing customer attrition, improving account activation rates, and maximizing revenue from interest, fees, and cross-selling. It also discusses how strategic reporting, marketing analytics, and data-driven insights can be used for segmentation, customer lifetime value analysis, profitability and loyalty analysis, cross-selling strategies, and customer retention programs. The overall aim is to provide a top-down analytical approach to optimize all areas of a bank's operations and financial performance.
Analytics in action - how marketelligent helped a retailer rationalize sku'sMarketelligent
A SKU rationalization approach was taken that focused on customers rather than individual products. This reduced the business's complexity from over 5,000 SKUs to approximately 3,500 SKUs while maintaining revenues, profitability, and customer satisfaction. By analyzing which style groups and colors contributed most to sales each year, approximately 30% of the SKUs accounting for a small portion of revenues were removed. This led to significant cost savings with minimal impact on customers or financial performance.
Companies spend nearly 15-20% of annual revenue on trade promotions, totaling $700 billion worldwide. However, only 30% of promotions are profitable. TPO uses modeling to identify optimal prices and discounts to maximize sales lift and ROI. It helps high power brands maintain relationships and low power brands gain negotiating power. An effective process includes modeling past performance, budget planning, execution, analysis, and incorporating lessons into future planning.
Analytics in action how marketelligent helped an auto oem identify 'hot' leadsMarketelligent
The automotive OEM wanted to classify incoming leads into categories based on their likelihood to purchase a new car within 30 days. They developed a predictive model that analyzed lead information and tagged each lead as "hot", "warm", or "cold". The model was able to double the auto purchase rate for "hot" leads compared to the average lead. After routing "hot" leads to dealerships for immediate follow up, auto sales increased by 12% across dealerships within 3 months.
Unlocking value in merchandise returns marketelligentMarketelligent
Retailers lose 8-15% of annual sales to merchandise returns, costing over $165 billion annually in return expenses. Advanced analytics can help optimize return policies and reduce fraudulent returns by analyzing customer return patterns and behaviors. This can enhance retailer profits by up to 5% of annual sales through minimizing expenses, boosting repeat sales, and detecting return abuse.
Analytics in action how marketelligent helped a card issuer combat transact...Marketelligent
The credit card issuer was facing significant losses from transaction fraud despite having a real-time scoring application. A 5-step analytical process was used to develop optimized authorization rules, improve the transaction scoring mechanism, identify new fraud strategies, and measure fraud operations performance. This resulted in fraud detection rates improving by 70 basis points year-over-year and reductions in false positives, false negatives, and missed opportunities to identify fraud.
Analytics In Action - How Marketelligent Helped A Bank Retain Its Profitable ...Marketelligent
The client, a major credit card issuer, was experiencing significant balance runoff that was reducing profitability. Analytics identified that 3% of accounts were responsible for 80% of the losses. Models were built and strategies implemented to retain profitable customers, including lowering interest rates for likely payers and offering alternative products. These approaches led to a 30% drop in balances lost and 45% greater response to alternative products, maintaining overall profitability.
This document discusses how analytics can be added to CRM to improve customer acquisition, development, retention, and lifetime value. It shows how analytics can be used across the customer lifecycle to win the right customers, create lasting bonds, and protect customers for life. Specifically, it discusses how analytics can be used to understand customers, acquire new customers through improved targeting, cross-sell and upsell the right products, design new products, and improve post-sales servicing. The key benefits highlighted are lowering direct marketing costs with predictive scorecards, increasing product revenues through better customer segmentation, focusing on high value customers, and maximizing yield through optimal pricing.
Analytics For Cash Advance Industry - MarketelligentMarketelligent
This document discusses various types of scorecards and analytics used for customer acquisition, credit risk management, and portfolio profitability in the cash advance industry, including: revenue scorecards, campaign management, cross-sell scorecards, re-activation scorecards, credit delinquency scorecards, customer approval and conversion scorecards, collections analytics, fraud analytics, and portfolio loss forecasting. It also discusses using these analytics to maximize profitable customer acquisition, forecast portfolio performance, and optimize underwriting and collections.
The document discusses various analytical techniques used to solve business problems in areas like new product launches, marketing, supply chain management, and sales. It provides examples of how techniques like gap analysis, concept testing, SKU rationalization, and inventory management can help companies optimize processes, minimize costs, and maximize profits. Key performance metrics are tracked to evaluate vendors, forecast demand, analyze competitors, and identify optimal pricing strategies.
Storytelling is an incredibly valuable tool to share data and information. To get the most impact from stories there are a number of key ingredients. These are based on science and human nature. Using these elements in a story you can deliver information impactfully, ensure action and drive change.
Part 2 Deep Dive: Navigating the 2024 Slowdownjeffkluth1
Introduction
The global retail industry has weathered numerous storms, with the financial crisis of 2008 serving as a poignant reminder of the sector's resilience and adaptability. However, as we navigate the complex landscape of 2024, retailers face a unique set of challenges that demand innovative strategies and a fundamental shift in mindset. This white paper contrasts the impact of the 2008 recession on the retail sector with the current headwinds retailers are grappling with, while offering a comprehensive roadmap for success in this new paradigm.
Discover innovative uses of Revit in urban planning and design, enhancing city landscapes with advanced architectural solutions. Understand how architectural firms are using Revit to transform how processes and outcomes within urban planning and design fields look. They are supplementing work and putting in value through speed and imagination that the architects and planners are placing into composing progressive urban areas that are not only colorful but also pragmatic.
Ellen Burstyn: From Detroit Dreamer to Hollywood Legend | CIO Women MagazineCIOWomenMagazine
In this article, we will dive into the extraordinary life of Ellen Burstyn, where the curtains rise on a story that's far more attractive than any script.
Unveiling the Dynamic Personalities, Key Dates, and Horoscope Insights: Gemin...my Pandit
Explore the fascinating world of the Gemini Zodiac Sign. Discover the unique personality traits, key dates, and horoscope insights of Gemini individuals. Learn how their sociable, communicative nature and boundless curiosity make them the dynamic explorers of the zodiac. Dive into the duality of the Gemini sign and understand their intellectual and adventurous spirit.
NIMA2024 | De toegevoegde waarde van DEI en ESG in campagnes | Nathalie Lam |...BBPMedia1
Nathalie zal delen hoe DEI en ESG een fundamentele rol kunnen spelen in je merkstrategie en je de juiste aansluiting kan creëren met je doelgroep. Door middel van voorbeelden en simpele handvatten toont ze hoe dit in jouw organisatie toegepast kan worden.
The Steadfast and Reliable Bull: Taurus Zodiac Signmy Pandit
Explore the steadfast and reliable nature of the Taurus Zodiac Sign. Discover the personality traits, key dates, and horoscope insights that define the determined and practical Taurus, and learn how their grounded nature makes them the anchor of the zodiac.
Digital Marketing with a Focus on Sustainabilitysssourabhsharma
Digital Marketing best practices including influencer marketing, content creators, and omnichannel marketing for Sustainable Brands at the Sustainable Cosmetics Summit 2024 in New York
Zodiac Signs and Food Preferences_ What Your Sign Says About Your Tastemy Pandit
Know what your zodiac sign says about your taste in food! Explore how the 12 zodiac signs influence your culinary preferences with insights from MyPandit. Dive into astrology and flavors!
❼❷⓿❺❻❷❽❷❼❽ Dpboss Matka Result Satta Matka Guessing Satta Fix jodi Kalyan Final ank Satta Matka Dpbos Final ank Satta Matta Matka 143 Kalyan Matka Guessing Final Matka Final ank Today Matka 420 Satta Batta Satta 143 Kalyan Chart Main Bazar Chart vip Matka Guessing Dpboss 143 Guessing Kalyan night
The Genesis of BriansClub.cm Famous Dark WEb PlatformSabaaSudozai
BriansClub.cm, a famous platform on the dark web, has become one of the most infamous carding marketplaces, specializing in the sale of stolen credit card data.
Discover timeless style with the 2022 Vintage Roman Numerals Men's Ring. Crafted from premium stainless steel, this 6mm wide ring embodies elegance and durability. Perfect as a gift, it seamlessly blends classic Roman numeral detailing with modern sophistication, making it an ideal accessory for any occasion.
https://rb.gy/usj1a2
Brian Fitzsimmons on the Business Strategy and Content Flywheel of Barstool S...Neil Horowitz
On episode 272 of the Digital and Social Media Sports Podcast, Neil chatted with Brian Fitzsimmons, Director of Licensing and Business Development for Barstool Sports.
What follows is a collection of snippets from the podcast. To hear the full interview and more, check out the podcast on all podcast platforms and at www.dsmsports.net
SATTA MATKA SATTA FAST RESULT KALYAN TOP MATKA RESULT KALYAN SATTA MATKA FAST RESULT MILAN RATAN RAJDHANI MAIN BAZAR MATKA FAST TIPS RESULT MATKA CHART JODI CHART PANEL CHART FREE FIX GAME SATTAMATKA ! MATKA MOBI SATTA 143 spboss.in TOP NO1 RESULT FULL RATE MATKA ONLINE GAME PLAY BY APP SPBOSS
3. New Product
Launches &
Innovation
Need Gap Analysis
It is an approach to identify the unmet needs of consumers, in which respondents are asked to envisage the
ideal brand or product, and then to rate various existing brands or products on key attributes. If there are no
existing brands measuring up to the ideal, there exists a need gap which could be a potential for a new
product.
It provides answers to critical business questions like:
What is the consumer’s perception of the brand/product?
What are the consumer needs yet to be catered to and are there competitors providing alternatives?
Identify new consumer segments and market potential for a new product.
What is the brand image in the consumer’s mind? If needed, how is it to be re-branded and re-positioned?
Needs
Satisfaction
HighLow
HighLow
Hygiene needs
Unmet needs
Satisfied needs
Underdevelopedneeds
Has enjoyable flavour
Cleans thoroughly
Provides fresh breath
Whitens teeth
Has anti-cavity action
Has anti-
bacterial action
Soothes gum
irritation,
inflammationand
bleedingRelieves
teeth
sensitivity
Controls tartar
Strengthens
enamel
4. Product & Concept Testing
PI Believability Uniqueness Value
Disclose technical
formula
DEL DEL MNB MB
Sensory ingredients IND DEL IND DEL
Natural ingredients IND DEL IND DEL
Easy to apply IND HYG
DEL = Delight
IND = Indifferent
TRNF = Turnoff
MNB = Must not be
MB = Must be
HYG = Hygiene
New Product
Launches &
Innovation
Product & Concept Testing
Estimate the market potential of an idea or a concept, before actually developing the product based on
consumer response on multiple metrics like: uniqueness, believability, feasibility, price, desirability,
advantages, disadvantages, etc.
Only successful concepts pass to the next phase, thereby minimizing R&D and marketing costs.
Apart from estimating the market potential, it also helps:
Identify critical success factors for a new product/service
Estimate price sensitivity and purchase likelihood
Bundle product/service features
Identify potential consumer segments and assess competition
Understand the purchase process and decision making
Optimize advertising messages and improve promotional offers
Statistical techniques (like Conjoint analysis, Discrete choice modeling, KANO analysis) are applied on the
consumer responses collected.
5. Supply Chain
SKU rationalization exercise is usually
supplemented with an impact study to
answer questions like:
What is the revenue impact associated
and how can it be minimized?
What is the inventory carrying impact
and overall savings?
Will it result in consumer dissatisfaction?
What is the consumer reactivation rate
on rationalized SKUs?
Is the product seasonal? What is the time
frame to rationalize the category?
What are the substitute products that
the consumer can be offered?
CumulativeRevenue
85%
Top Selling
CumulativeRevenue
SKU in order of
decreasing Revenue
Contribution
100%
98%
80%
Top Mid Bottom
Recommended for Rationalization
80%
Mid Selling
CumulativeRevenue
SKU Rationalization
The objective of SKU rationalization is to reduce the business complexities arising from a burgeoning product
portfolio, from managing too many items, product life cycles, consumer preferences, etc., while ensuring
consumer satisfaction. It is the process of re-looking at the product portfolio and optimizing it.
It starts with the parameters that form the basis—identifying and retaining high margin SKUs, high volume
SKUs, SKUs that have a higher shelf life and those which are in tune with consumer preferences.
After analyzing the cost drivers for each SKU, the portfolio can be assorted and rejected products can be re-
evaluated for further action (merge, sell, milk or kill).
6. Pricing: Competitive pricing
(comparable to other vendors),
stability (low variance), accuracy,
advance notice of price changes.
Quality: Compliance with purchase
order, conformity to specifications,
reliability (rate of product failures),
durability, support, warranty.
Delivery: Time, quantity, lead time,
packaging, emergency delivery and
technical support.
Partner Strategic Fit Brand Equity Financial Health
Ability to
operationalize
Final Score Status
Vendor 1 9 8 10 7.4 8.75 Pass
Vendor 3 10 9 8 7.4 9.00 Pass
Vendor 3 10 7 6 7.4 7.50 Pass
Vendor 4 10 10 8 10.0 9.50 Underleveraged
Vendor 5 9 7 8 7.4 7.75 Pass
Vendor 6 2 7 6 8.2 5.50 Risky
Partner Filtration Methodology & Process Flow
Supply Chain
Vendor Management
It enables organizations to control costs, strive towards service excellence and mitigate risks to gain increased
value from their vendor by:
Minimizing potential business disruption
Avoiding deal and delivery failure
Improving operational efficiencies, controlling costs and planning of workforce and labor
It includes vendor identification, recruitment, monitoring, tracking and evaluating vendors on certain KPIs:
7. INSOURCE
High
Demand Flexibility?
Low
High
OUTSOURCE
Low
Competitive advantage?
Capability of
supplier
Process maturity of
supplier
Strategic risk with
supplier
IMPLEMENT
OUTSOURCE
High High Low
Low
Establish norms for product
quality, process for transferring
knowledge& monitor quality
tracking measures
Establish process monitoring
measures, plans to
continuously improveprocess
and knowledgesharing across
teams
Actions Actions
Low
High
Ensure flexibility and penalty
clauses are established for
product delivery, establish
alternatesourceof activity and
divulgeas littleproprietary
information as possible.
Actions
Establish control need based on
three secondary factors,
develop appropriate
contracting relationship type
and negotiatecontract
Supply Chain
Sourcing Strategy & Production Planning
Strategic sourcing continuously improves and re-evaluates the purchasing activities of a company. Sourcing
optimization helps evaluate different procurement inputs by considering supply market, specific supply chain
conditions, individual supplier conditions and offers alternatives to address the buyer’s sourcing goals.
It helps in:
Assessing the supply market, the company’s spending and identifying suitable suppliers
Optimizing production related sourcing decisions, concerning where to produce or source products,
based on a total supply chain cost analysis
Selecting a suitable manufacturing site, optimal capacity utilization of plants and product allocation
among the different plants and distribution centers
Strategic planning for manufacturing and inventory optimization
Increasing manufacturing and distribution asset utilization
8. Project Area Identified Savings (to date)
Transportation 16%
Warehouse 12%
Supply Chain 3%
Total 15%
Supply Chain
Network Optimization
Network optimization helps in designing the optimal supply chain network with the lowest total cost
structure, given operational constraints. It uses statistical modeling to describe the transport network to be
followed. It helps senior management in making the most efficient use of resources while identifying the
most economical routes.
It aids in:
Reducing transportation overheads and ensuring that the right product reaches the right location on
time
Improving transportation mode selection, load consolidation and resource utilization
Quantifying operational, financial costs of alternative networks and identifying scopes of improvement
Ensuring reduced freight costs and increased operating efficiency
Streamlining warehouse activities, thereby reducing time to dispatch and optimizing productivity levels
9. Lead time : It is the time lag between
when the order is placed and the point at
which the stocks are available; A lead
time of 4 days implies that there should
always be stock for 4 days supply to avoid
stock-out scenario
Safety stock is the buffer quantity to
cover any unplanned excess requirement
taking into account delivery delays
Reorder point is the minimum level of
stock at which procurement should be
triggered and quantity of warehouse
stock should never go below this point
If the quantity of warehouse stock is less
than re-order point, there is shortfall
Stock
TimeRelease date
Safety
Stock
Reorder
point
Availability date
Lot size
Replenishment
lead time
Supply Chain
Inventory Management
Optimal inventory management is an indispensable function to ensure un-interrupted product supply to
meet the changing demand. Stock out analysis helps in:
Optimizing inventory and service levels by streamlining ordering processes
Minimizing stock out—stock out can lead to loss of sales
Handling overstock—overstock leads to increased inventory costs and costs to liquidate excess inventory
Maximizing warehouse space utilization
Lead time is the time lag between when the order is placed, and the point at which stocks are available. The
buffer quantity to cover any unplanned excess requirement, taking into account delivery delays, is referred to
as safety stock. Providing for safety stock on top of lead time demand, will give the re-order point, which is
the minimal level of stock at which procurement should be triggered. Warehouse stock should never go
below the re-order point. Re-order point will assist in deciding what would be the best optimal order
quantity and when to place an order.
10. States
States
States
States
Zones
YTD
MOM
Salience
Brand share
YOY
States
Zones
States
Zone
Increase in brand share
Decrease in brand share
No change in brand share
25.6,61.3
6.5,56.54.4,78.1
16.8,79.7
12.3,73.3
8.3,76.0
1.0,66.7
10.9,84.8
0.3,82.7
3.0,50.5
2.5,60.0
0.2,65.2
1.0,33.9
1.0,61.9
0.2,68.7
% Salience, %Brand Share
Sales & Channel
Planning
Sales Tracker
Constant monitoring and tracking provides the sales team with accurate information related to market
dynamics, so that they can have an action plan before the next sales cycle starts. Also, it serves as the base
for formulating sales strategies. It:
Identifies which products and SKUs are selling the most
Analyses market trends and geographic buying patterns
Evaluates growth potential for product portfolio (products, regions, markets)
Identifies the epicenter for market share loss – Root-cause analysis
Interactive visual dashboards on market performance across geographies provide further assistance vs.
analyzing large volumes of data.
11. AP, 178.6
Dam, 8.2
Delhi, 269.3
Goa, 187.7
Har, 76.2
Kar, 83.4
Ker, 75.7
Mah, 41.9
Mum, 76.5
Pondi, 24.8
Raj, 127.1
UP, 62.0
0%
5%
10%
15%
20%
25%
0% 5% 10% 15% 20% 25% 30%
CompetitorbrandMarketshareYTD2012
Industry salience YTD 2012
CompetitorBrandshare:4.0%
AP, 213.6
Bih, 11.7
Dam, 6.9
Delhi, 243.6
Goa, 238.3
Har, 77.0
Kar, 60.1
Ker, 164.1
Mah, 40.8
Mum, 66.7
Oriss, 10.8
Pondi, 9.6
Raj, 36.9
TN, 173.5
UP, 64.4
0%
2%
4%
6%
8%
10%
12%
14%
16%
18%
20%
0% 5% 10% 15% 20% 25%
CompetitorbrandMarketshareYTD2011
Industry salience YTD 2011
CompetitorBrandshare:4.4%
YTD 2011 YTD 2012Change in competitor brand strategy
Sales & Channel
Planning
Competitor Analysis
Monitoring the performance of the brand versus key competitors on a continuous basis assists in:
Detailed understanding of competitors’ portfolio, marketing and sales strategies
Studying competitors’ response to any new strategy in place
Evaluating the expansion and growth strategy of competitor brands across markets
Based on competitor assessment and their impact on brand’s share, the micro and macro level strategies are
outlined.
High industry salience,
Low competitor brand share
High industry salience,
High competitor brand share
12. 0.0
1.0
2.0
3.0
4.0
5.0 Actual Sales Forecasted Sales Base Line Sales
Millioncasessold
Sales & Channel
Planning
Sales Forecasting
A good demand forecast helps improve sales volume, cash flow and hence the profitability, by optimizing
inventory and by minimizing out-of-stock. Besides considering historical data, external factors like promotion,
seasonality, price changes, macro-economic conditions are also considered for more accurate forecasts. It
helps create better solutions for:
Inventory Control: Optimizing inventory & service levels by streamlining ordering processes
Minimizing Out of Stock: Out of stocks equal lost sales which can have a negative impact on sales
Improving product freshness & warehouse efficiency: Too much inventory can result in excess “expired
inventory” that must be liquidated at or below cost, which is a cash flow drain
Maximizing warehouse space utilization: As SKU proliferation continues, forecasting can help maximize
the use of warehouse space
Capitalizing on peak sales weeks: Accurate forecasting ensures the right product mix to take full
advantage of operational capacity and peak market demands
Statistical techniques (like Moving Average, Holt Winters, Regression, ARIMA) are applied on historical data.
13. 53.2
44.0
30.4
20.4 19.1 18.3
0
10
20
30
40
50
60
70
0
5
10
15
20
25
30
35
$0.90
to
$0.98
$0.99 $1.00
to
$1.08
$1.09 $1.10
to
$1.18
$1.19 $1.20
to
$1.28
$1.29 $1.30
to
$1.38
$1.39 $1.40
to
$1.48
$1.49
% ACV Brand A sales rate
Identify price threshold
0
10
20
30
40
50
60
70
80
90
100
110
120
Wk-1('09)
Wk-4('09)
Wk-7('09)
Wk-10('09)
Wk-13('09)
Wk-16('09)
Wk-19('09)
Wk-22('09)
Wk-25('09)
Wk-28('09)
Wk-31('09)
Wk-34('09)
Wk-37('09)
Wk-40('09)
Wk-43('09)
Wk-46('09)
Wk-49('09)
Wk-52('09)
Wk-3('10)
Wk-6('10)
Wk-9('10)
Wk-12('10)
Wk-15('10)
Wk-18('10)
Wk-21('10)
Wk-24('10)
Wk-27('10)
Wk-30('10)
Wk-33('10)
Wk-36('10)
Wk-39('10)
Wk-42('10)
Wk-45('10)
Wk-48('10)
Wk-51('10)
Wk-2('11)
Wk-5('11)
Wk-8('11)
Wk-11('11)
Wk-14('11)
Wk-17('11)
Wk-20('11)
Wk-23('11)
Wk-26('11)
Wk-29('11)
Wk-32('11)
Wk-35('11)
Wk-38('11)
Wk-41('11)
Wk-44('11)
Wk-47('11)
Wk-50('11)
Price index vs. competition Volume share
Optimum price corridor
Identify optimum price corridor
Sales & Channel
Planning
Pricing Analysis
Pricing strategies are crafted to meet two key objectives: profit and revenue maximization. It helps in
identifying the best pricing strategy in a dynamic market, in response to the competitive scenario, by:
Evaluating the brand’s own price elasticity and competitor brands’ cross price elasticity
Identifying price gaps/thresholds which can result in significant share changes for the brand
Identifying the right price gap/threshold with respect to the key competitors
14. Simulator for effective allocation of trade spends
Sales & Channel
Planning
Promotional Effectiveness
Promotions provide great value for brand through both incremental sales and increased brand awareness. It
is a technique of evaluating the extent of success of an activity using past data, by correlating the sales data
and marketing efforts. Main objective is to assess the impact and effectiveness of promotions.
Trade promotion optimization (TPO) utilizes advanced econometric modeling techniques to help brands
refine their promotion strategies, identify the right price and discount point that maximized sales lift and ROI,
and eventually help manufacturers enlarge their consumer basket and have a sustained impact on baseline
sales.
TPO helps companies:
Allocate more for promotion sensitive brands and SKUs
Collaborate with retailers and restructure their trade programs
Design unique programs specific to a retailer/channel instead of following a “one-size fits all” approach
15. Streaming Sales Data
fed weekly or
monthly as is
available
Promotion Calendar fed
into the system
periodically
Marketelligent
PRISM
µ Display
µ Feature
µ Consumer
µ TPR
Decomposed Lift (µ)
Sales & Channel
Planning
Real-time evaluation of promotions
Marketelligent has developed an in-house proprietary tool called PRISM, for continuous monitoring and
evaluation of trade and marketing promotions on a real time basis, using the test-control approach.
Identifying the control samples for each of the test group takes most of the time/effort. PRISM minimizes
the time required for the same and identifies the control samples on a real time basis, based on historical
sales trends and outlet demographics.
PRISM uses sales in test and control outlets, to calculate the lift factor for each or combinations of trade
marketing programs. Based on the lift factor, incremental sales and ROI are calculated for each activity. The
effectiveness of promotions can be compared at different levels – channels, categories, brands and markets.
16. Market
Performance
Jan’09
Feb’09
Mar’09
Apr’09
May’09
Jun’09
Jul’09
Aug’09
Sep’09
Oct’09
Nov’09
Dec’09
Jan’10
Feb’10
Mar’10
Apr’10
May’10
Jun’10
Jul’10
Aug’10
Sep’10
Oct’10
Nov’10
Dec’10
Volume,‘000units
Mediaspend,‘000USD
2%
4%
6%
8%
10%
12%
14%
Total Spends Magazine TV Daily
Evaluate “Efficiency/ROI” from each media vehicle
Efficiency
0
100
200
300
400
500
600
700
800
900
0
2
4
6
8
10
12
14
16
18
20
Baseline sales Online incr. sales TV incr. sales Daily incr. sales
Online spend TV spend Dailies spend
Decomposed sales into base line and incremental
Market Mix Modeling
Marketing budgets as a percentage of sales typically vary between 4-10% for a CPG company. Given the high
investment, marketers would like to evaluate the returns from each media vehicle and optimize their
investments.
Market Mix Modeling (MMM) helps brand managers identify the right mix of advertising media, manage
channels and allocate marketing spend in a manner that not only provides the required sales lift but also
maximizes the returns on investment by media vehicles.
The model captures the following:
Cannibalization, if any, amongst the portfolio of brands
Impact of competition media activity
Saturation spends for each media vehicle based on diminishing returns
Decay impact, if any for each of the media vehicles - also called ad-stock
17. Knowledgeable
2%
Quality Conscious
4%
Soft Shiny Hair
4%
Better Color
Experience 1%
Natural
Ingredients 2%
Pleasant
Fragrance 1%
Gray coverage
1%
Value for Money
0.4%
Feel youngIn
charge 15%
Sensuous &
Sophisticated14%
Perfect color
13%
Recommended
brand 11%
Brand that keeps
its promises 9%
Range of Shades
8%
Makes me feel
confident 9%
Intense, long
lasting colors 5%
Purchase Intent
Colour pathwayNon-damaging pathwayExperiential
Emotional response
Rational response
Brand image
Brand attributes
Market
Performance
Driver Analysis
Every organization needs to understand which product/service attributes have the greatest influence on the
consumer’s purchase decision. For instance, consumers might rate a personal care product based on its color,
scent, functionality, price, discount offer and so on. Driver analysis is a technique widely used to identify the
key consumer needs which translates to purchase behavior. It provides answers to critical questions like:
What accounts for consumers’ proclivity to purchase the product?
What causes consumers to switch to competitor brands?
What is the core consumer segment that should be focused on?
Statistical techniques (Correlation, Multivariate Regression, and Structural Equation Modeling) are utilized to
identify the critical success factors of a brand which drives sales or revenue.
18. Identify growth opportunities for niche
consumer segments
Define the portfolio strategy for their
category by ensuring minimal consumer
segment overlap across brands
Based on the above, the marketing team
modifies their product/service offering and
deploys the desired positioning and
marketing communication to reach their
consumer base.
Healthy hair
Seekers
Natural
enhancers
Expressive
Age defiers
Young subtle
expressers
Young strong
expressers
Original color
of hair
without hair
colorant
Color of hair
with hair
colorant
(Aspired
Color)
Dark Brown
Medium Brown
Light Brown
Medium Brown
Medium Blonde
Dark Blonde
Light Brown
Dark Brown
Medium Brown
Medium Brown
Dark Blonde
Medium Blonde
Light Brown
Medium Brown
Medium Blonde
Dark Brown
Chestnut
Medium Blonde
Auburn
Dark Brown
Auburn
Auburn
Chestnut
Auburn
Chestnut
Market
Performance
Consumer Segmentation
Segmentation identifies homogenous consumer groups based on their needs, preferences, attitudes,
demographics, lifestyle measures (activities, interests, opinions and values) and behavior.
A mass marketing approach treats the market as a whole, while segmentation enables the business to target
different consumer groups by adapting its product and marketing mix to suit each targeted segment.
Segmentation results are leveraged to:
Understand how the market is evolving in terms of changing consumer needs/preferences
Identify the benefits sought by each consumer segment
Improve the competitive position by focusing on the most profitable and sizeable segment
19. Assessing brand value helps in:
Identifying optimal measures to build
strong brand equity
Demonstrating the effect of strong
brand equity – in terms of market share,
consumer acquisition, brand loyalty and
other desirable outcomes
Mapping the brand's equity against that
of key competitors Judgments
Resonance
Feelings
ImageryPerformance
Salience
Stages of brand development
4. Relationships =
What about you and me?
3. Response=
What about you?
2. Meaning=
What are you?
1. Identity=
Who are you?
Branding objective at each
stage
Intense, Active
loyalty
Positive, Accessible
reactions
Points-of-parity
& Difference
Deep, Broad
brand awareness
Keller’s Brand Resonance Pyramid
Market
Performance
Brand Equity Tracker
Brand equity tracker provides a framework for measuring the brand’s performance/health. This can be
assessed through consumer perception, which includes both rational and emotional aspects. Main criteria
for assessment — brand differentiation, brand relevance, the consumer’s knowledge of the brand and brand
image in the consumer’s mind.
Brand equity tracker defines the gap between what a brand wants to be and how a brand is actually
perceived by consumers, thereby giving a direction for branding strategy. Different components of brand
equity are depicted in the image.
20. Business Situation:
Client’s 70% to 80% of daily beverage production depends on empty bottle returns from previous day. As such, a highly accurate forecast
for daily bottle returns across all SKU’s was required for optimal production planning.
The Task:
Design, develop and implement a predictive model that will help in forecasting daily empty bottle returns for 10 different SKUs.
Analytical Framework:
Data preparationfor model building. Past sales data or production data didn't have much effect on the returns data and thus past 2 years
return data was used for the model building. Different models like ARIMA, Holt Winters, Year on Year growth model were built to forecast the
returns.
The Result:
• For all the SKUs considered, an accuracy of 75% was achieved for May-June 2011. This was significantly better than existing forecasts.
• For the SKU which contributed to 47% of the total returns, an accuracy of 92% was achieved for May-June 2011. The monthly accuracy for
May2011 being 85% and June 2011 being 97%.
Analytics in Action
Towards Better Production Planning by Accurate Forecasting
Client: A Leading Carbonated Beverage Manufacturer
Defining
Modelling
universe
Model
development
Validation
Past 2 years empty bottle returns data was
considered. The data was too volatile to fit
into the model and thus Centralized
Moving Averages was calculated to
smoothen the data and to get a better
model fit.
ARIMA model was built on Centralised
moving averages , Holt winters and Year on
Year growth rate models was built on
empty bottle returns. Bootstrapping
method was applied to choose best
forecast value.
May and June forecasts were compared
against actuals. Accuracy was calculated at
a daily-level for all SKU’s
-
5,000
10,000
15,000
20,000
25,000
30,000
5/1/2009
5/23/2009
6/14/2009
7/6/2009
7/28/2009
8/19/2009
9/10/2009
10/2/2009
10/24/2009
11/15/2009
12/7/2009
12/29/2009
1/20/2010
2/11/2010
3/5/2010
3/27/2010
4/18/2010
5/10/2010
6/1/2010
6/23/2010
7/15/2010
8/6/2010
8/28/2010
9/19/2010
10/11/2010
11/2/2010
11/24/2010
12/16/2010
1/7/2011
1/29/2011
2/20/2011
3/14/2011
4/5/2011
4/27/2011
5/19/2011
6/10/2011
2009
Dailyreturns
Actuals
Forecasts
Model Build on 2009 and 2010 data Model Application for May-June11
2009 2010 2011
-
5,000
10,000
15,000
20,000
25,000
30,000
35,000
1-May-11
3-May-11
5-May-11
7-May-11
9-May-11
11-May-11
13-May-11
15-May-11
17-May-11
19-May-11
21-May-11
23-May-11
25-May-11
27-May-11
29-May-11
31-May-11
2-Jun-11
4-Jun-11
6-Jun-11
8-Jun-11
10-Jun-11
12-Jun-11
14-Jun-11
16-Jun-11
18-Jun-11
20-Jun-11
22-Jun-11
24-Jun-11
26-Jun-11
28-Jun-11
30-Jun-11
DailyReturns
Actuals
Forecast
21. Business Situation:
The client, a leading hair care manufacturer wanted to identify drivers of brand preference for the category which would aid them in designing
the right marketing strategy & related collateral for strengthening market share for their existing brand.
Analytical Framework:
Design a Structural Equation Model (SEM) to identify key equity themes & their hierarchyin terms of importance in driving purchase for the
category, and identify the best pathway to improve the brand’s equity in consumer’s mind.
The Result:
The following recommendationswere made and implemented by the business:
₋ Leverage Brand’s strength on the “health” dimension – this goes in line with brand’s equity pyramid
₋ “Ingredient” is one of the key category drivers on which the brand is performing very well – strengthen communicationstrategy to
capture this
₋ Even though health benefit is key, consumer’s eventually desire the beauty aspect – Redesign communicationstrategy to convey this
as the end benefit
₋ Currently “beauty” dimension is weak – build credibility on that with consistent communication
Analytics in Action
Re-design Product Communication Strategies in line with Consumer
Preferences
Client: Leading Hair Care Manufacturer
Marketing strategyon the core “Health” benefit & it’s eventual impact on making oneself attractiveis the “Key”
Overall Brand Equity
Feel Confident
& Energised
15%
Trust
10%
Effective
8%
Expert Brand
3%
Leaves hair
soft ,smooth
and shiny
11%
Hair Health
10%
Color
Protection
1%
Conditioning
3%
Ingredients
11%
Brand for me
6%
Attractiveness
10%
Beautiful and
Empowered
1%
Leading Brand
2%
Fragrance
5%
Experience
1%
For men and
women
0.3%
Dandruff and
Scalp issues
4%
0.60
0.37
0.83
0.21
0.90
0.63
0.30
0.09 0.290.15
0.80
Strong relationship
Moderately strong relationship
Weak relationship
0.78 0.19 0.90 0.90 0.90
0.90
0.90
0.16
22. Business Situation:
Leading manufacturer in anti-aging cream category. Brand X occupies a dominant position in market; recently also introduced Brand Y.
• Brand X Volumes are down 6.5% vs. last year.
• Spending across Media has shifted from being TV-centric in 2007 to Dailies-centricin 2008.
• Manufacturer would like to understand the effectiveness and efficiency of his Media Spend; and to find optimal ways to reallocate media
spend across channels so as to maintain Sales
The Task:
Need to develop an optimal media investment strategy based on Media Mix Modeling to improve the brand equity of the client :
• Establish key relationships between Sales and Marketing driver inputs.
• Quantify impact of each marketing driver on sales.
• Optimize allocation spends across various drivers to maximize sales.
The Result:
The model gave clear directions for allocating budgets across various media :
• For every $ spend, Magazine gives 6 times the return of TV and dailies.
• Magazines seems to be operating above threshold and below saturation levels.
• Lower returns on TV could be due to operating levels below threshold in certain bursts, and low SOVs compared to Brand Z.
• TV has a bigger role of driving the brand health.
• Recommendationsused to optimize marketing spends across channels to maximize Sales.
Analytics in Action
Increasing ROI by Optimizing Media Spends
Client: A Leading Beauty Products Manufacturer
0
100
200
300
400
500
600
700
800
900
0
2
4
6
8
10
12
14
16
18
20
JAN07
FEB07
MAR07
APR07
MAY07
JUN07
JUL07
AUG07
SEP07
OCT07
NOV07
DEC07
JAN08
FEB08
MAR08
APR08
MAY08
JUN08
JUL08
AUG08
SEP08
OCT08
NOV08
DEC08
Baseline Sales Magazine Incr. Sales TV Incr. Sales Daily Incr. Sales
test Magazine Spend TV Spend Dailies Spend
Volume,‘000units
MediaSpend,‘000SGD
-
0.02
0.04
0.06
0.08
0.10
0.12
0.14
Total Spends Magazine TV Daily
Efficiency
Incremental Sales per ‘000 SGD media spend
23. Business Situation :
Over-the-Counter (OTC) market is a growing industry; consumers today are much more inclined to self-diagnosis and self-medication as they
prefer to have a greater role in their health affairs. And brand shares are impacted because of multiple influencers like FDA regulations,
mergers and acquisitions, patent expiry, Rx to OTC switch, entry of generics, etc.
The Task :
In this dynamically changing OTC market; there is a need to track OTC industry movement by category and evaluate market share changes
across key geographies /countries . This will enable a business to focus its marketing efforts on areas with the greatest return on investment.
Analysis :
• Collated historic (2005-2010) as well as forecasted sales (2011-2015) information.
• Accounted for all industry mergers & acquisitions – at company X brand X country level
• Evaluated category and brand performance at each of the levels defined below:
The Result :
• Insights from this analysis helped identify the focus markets and brands by each category. Based on this the client drafted their annual
strategic plan
Analytics in Action
Tracking Market Development in the OTC industry
Client : A Leading Global Manufacturer of Over-the-counter Drugs
Category
1. Cough & Cold
2. Analgesics
3. Vitamins & Minerals
4. Digestive Health…etc.
Geography
1. APAC
2. LA
3. NA
4. WE & EE…etc.
Country
1. USA
2. Canada
3. Brazil
4. China…etc.
Company
1. J&J
2. GSK
3. Merck
4. Reckitt Benckiser…etc.
Brands
(as an example brands
within Analgesics)
1. Tylenol
2. Aspirin
3. Advil…etc.
24. MANAGEMENT TEAM
GLOBAL EXPERIENCE.
PROVEN RESULTS.
Roy K. Cherian
CEO
Roy has over 20 years of rich experience in marketing, advertising and media
in organizations like Nestle India, United Breweries, FCB and Feedback
Ventures. He holds an MBA from IIM Ahmedabad.
Anunay Gupta, PhD
COO & Head of Analytics
Anunay has over 15 years of experience, with a significant portion focused
on Analytics in Consumer Finance. In his last assignment at Citigroup, he was
responsible for all Decision Management functions for the US Cards
portfolio of Citigroup, covering approx $150B in assets. Anunay holds an
MBA in Finance from NYU Stern School of Business.
Kakul Paul
Business Head, CPG & Retail
Kakul has over 8 years of experience within the CPG industry. She was
previously part of the Analytics practice as WNS, leading analytic initiatives
for top Fortune 50 clients globally. She has extensive experience in what
drives Consumer purchase behavior, market mix modeling, pricing &
promotion analytics, etc. Kakul has an MBA from IIM Ahmedabad.
ADVANCED ANALYTICAL SOLUTIONS
MARKETELLIGENT, INC.
80 Broad Street, 5th Floor, New York, NY 10004
1.212.837.7827 (o) 1.208.439.5551 (fax) info@marketelligent.com
CONTACT www.marketelligent.com
Industry Business Focus Tools and Techniques
Consumer Finance Investment Optimization SAS, SPSS, R, VBA
Credit Cards Revenue Maximization Cluster analysis
Loans and Mortgages Cost and Process Efficiencies Factor analysis
Retail Banking & Insurance Forecasting Structural Equation Modeling
Wealth Management Predictive Modeling Conjoint analysis
Consumer Goods and Retail Risk Management Perceptual maps
CPG & Retail Pricing Optimization Neural Networks
Consumer Durables Customer Segmentation Chaid / CART
Manufacturing and Supply Chain Drivers Analysis Genetic Algorithms
High Tech OEM’s Supply Chain Management Support Vector Machines
Automotive Sentiment Analysis
Logistics & Distribution
YOUR PARTNER FOR
DATA ANALYTICS SERVICES
Greg Ferdinand
EVP, Business Development
Greg has over 20 years of experience in global marketing, strategic planning,
business development and analytics at Dell, Capital One and AT&T. He has
successfully developed and embedded analytic-driven programs into a
variety of go-to-market, customer and operational functions. Greg holds an
MBA from NYU Stern School of Business