COVID-19 Update (Summary): September 27, 2020
•Download as PPTX, PDF•
0 likes•63 views

This document provides context and explanations for COVID-19 projections and analyses. It notes that the analysis is conducted independently and aims to be apolitical. Data sources and modeling approaches are described, including using a Gompertz function to model case growth and log-linear regression for deaths. Locations are selected based on factors like family/friends or economic importance. Updates are typically daily, though clinical duties may cause delays.

Recommended
Recommended
More Related Content
What's hot
What's hot (20)
Similar to COVID-19 Update (Summary): September 27, 2020
Similar to COVID-19 Update (Summary): September 27, 2020 (17)
More from Steve Shafer
More from Steve Shafer (20)
Recently uploaded
Recently uploaded (20)
COVID-19 Update (Summary): September 27, 2020
- 1. Caveats and Comments 1 Overview: This is my analysis, not Stanford’s. My goal is to understand the trajectory of COVID. It is not confidential and can be freely shared. The R program code is available at https://github.com/StevenLShafer/COVID19/. The daily analysis are available at https://1drv.ms/u/s!AuOyHP_aTIy7rowrt2AjGpWm_frnEQ?e=KBcNbh. You are welcome to use the R code on GitHub for any purpose. I am attempting to keep the analysis and commentary apolitical. I am now including partisan lean as a metric to help understand the epidemic. I occasionally point out misrepresentations by government officials. I occasionally point out where government recommendations have placed Americans at increasing risk. I try to provide a daily update in the morning, except Sundays. My analysis my be delayed by my clinical responsibilities as a Stanford anesthesiologist. There is a lot of information on the figures. If something isn’t clear, please see the explanation on slide 2. Data sources: • USA Case Data: https://github.com/CSSEGISandData/COVID-19/raw/master/csse_covid_19_data/csse_covid_19_time_series/time_series_covid19_confirmed_US.csv • USA Death Data: https://github.com/CSSEGISandData/COVID-19/raw/master/csse_covid_19_data/csse_covid_19_time_series/time_series_covid19_deaths_US.csv • USA Testing and Hospitalization Data: https://raw.githubusercontent.com/COVID19Tracking/covid-tracking-data/master/data/states_daily_4pm_et.csv • Global Case Data: https://github.com/CSSEGISandData/COVID-19/raw/master/csse_covid_19_data/csse_covid_19_time_series/time_series_covid19_confirmed_global.csv • Global Death Data: https://github.com/CSSEGISandData/COVID-19/raw/master/csse_covid_19_data/csse_covid_19_time_series/time_series_covid19_deaths_global.csv • Global Testing Data: https://raw.githubusercontent.com/owid/covid-19-data/master/public/data/owid-covid-data.csv • Mobility Data: https://www.gstatic.com/covid19/mobility/Global_Mobility_Report.csv • Partisan Lean: MIT Election Data and Science Lab: https://doi.org/10.7910/DVN/VOQCHQ/HEIJCQ • Ensemble Model: https://github.com/reichlab/covid19-forecast-hub/raw/master/data-processed/COVIDhub-ensemble/2020-xx-xx-COVIDhub-ensemble.csv Models: 1. Future projections of case numbers are based on the Gompertz function (https://en.wikipedia.org/wiki/Gompertz_function): log 𝑐𝑢𝑚𝑢𝑙𝑎𝑡𝑖𝑣𝑒 𝑐𝑎𝑠𝑒𝑠 = 𝑐𝑢𝑟𝑟𝑒𝑛𝑡 𝑐𝑎𝑠𝑒𝑠 + 𝑚𝑎𝑥𝑖𝑚𝑢𝑚 𝑐𝑎𝑠𝑒𝑠 − 𝑐𝑢𝑟𝑟𝑒𝑛𝑡 𝑐𝑎𝑠𝑒𝑠 1 − 𝑒−𝑘 𝑡 . This is a naïve asymptotic model. k is the rate constant, such that log(2) / k = time to 50% rise. t is the number of days. Wikipedia The Gompertz function is estimated from the last 3 weeks of data for cumulative cases (red dots in the figures). Deaths are predicted from a log linear regression of deaths over the past 21 days. For the US, and individual states, I am also including the 98% prediction interval from the COVID-19 Forecast Hub (https://covid19forecasthub.org/). 2. The rate of change in daily cases and deaths is the slope of delta cases / day over the last 14 days, divided by the average number of cases. Locations The locations for the modeling are where Pamela and I have family and friends, locations of interest to friends and colleagues, or countries in the news (e.g., China, South Korea, Sweden, Brazil) or with significant economic impact on the United States (e.g., Japan, Canada, Mexico). Locations are easy to add. Stay safe, well, resilient, and kind. Steve Shafer steven.shafer@Stanford.edu
- 2. 2,586,092 152,804 1 10 100 1,000 10,000 100,000 1,000,000 10,000,000 100,000,000 Actual(points)/Predicted(line) Phase Pre-Model Modeled Deaths Tests USA projection as of 2020-05-27 0 10,000 20,000 30,000 0 2,000 4,000 6,000 Cases/Day Deaths/Day Cases: 1,662,302 (32,123) -- Deaths: 98,220 (829) -- Case Mortality: 5.9% -- Daily Change in Cases: -0.5% Explanation of the Figures 2 Brown dots: cumulative tests Red dots: cumulative cases used to estimate Gompertz function, presently set to last 3 weeks Red line: predicted cumulative cases based on the Gompertz function estimated from the red dots Red number: total cases on June 30th, based on the Gompertz function estimated from the red dots Black number: total Deaths on July 31th, based on log-linear regression of the past 21 days Black line: predicted cumulative deaths, based on a log linear regression of deaths over past 21 days. Axis for deaths / day, usually 1/10th of the axis for cases / day on the left side of the figure. Green line: linear regression over 8 days, used to calculate percent increase / decrease (see below) Daily change in cases, calculated as the slope of the green line (above left) / number of new cases yesterday. Case mortality: cumulative deaths / cumulative cases. Cases / day calculated from cumulative cases used to estimate the Gompertz function Cases / day calculated from cumulative cases not used to estimate the Gompertz function Deaths / day, axis is on the left Blue line: today Blue dots: cumulative cases not used to estimate Gompertz function Cumulative cases (yesterday’s cases) and cumulative deaths (yesterday’s deaths) Axis for cases / day. Axis for deaths / day appears to the right. Geographic location Date of analysis, also shown as blue vertical line below Purple wedge: 98% ensemble prediction interval from COVID-19 Forecast Hub (USA and US States only)
- 3. Worldwide 42,659,209 1,219,488 1 10 100 1,000 10,000 100,000 1,000,000 10,000,000 100,000,000 Cumulative Phase Pre-Model Modeled Deaths Worldwide projection as of 2020-09-27 10 1,000 100,000 CasesandDeaths/Day Cases: 32,839,281 (277,937) -- Deaths: 994,127 (5,279) -- Case Mortality: 3.0% -- Daily Change: +0.7% Cases, +0.7% Deaths 2020-09-27 Summary: 3
- 4. USA 8,329,658 236,231 1 10 100 1,000 10,000 100,000 1,000,000 10,000,000 100,000,000 Cumulative Phase Pre-Model Modeled Deaths Tests USA projection as of 2020-09-27 Mother'sDay MemorialDay July4th July15,2020 LaborDay 10 1,000 100,000 CasesandDeaths/Day Cases: 7,078,089 (45,377) -- Deaths: 204,490 (740) -- Case Mortality: 2.9% -- Daily Change: +1.8% Cases, +0.1% Deaths 2020-09-27 Summary: 4
- 5. Western Europe 3,634,458 166,260 1 10 100 1,000 10,000 100,000 1,000,000 10,000,000 100,000,000 Cumulative Phase Pre-Model Modeled Deaths Tests Belgium, France, Germany, Greece, Italy, Portugal, Spain, Netherlands, Luxembourg, and the UK (Population = 344MM) Western Europe projection as of 2020-09-27 10 1,000 100,000 CasesandDeaths/Day Cases: 2,495,937 (13,193) -- Deaths: 159,038 (113) -- Case Mortality: 6.4% -- Daily Change: +2.0% Cases, +3.4% Deaths 2020-09-27 Summary: 5
- 6. Comparison of COVID-19 Cases & Deaths between US & Europe Cases Deaths 45,377 13,193 740 113 3 10 30 100 300 1,000 3,000 10,000 30,000 100,000 Date DailyCasesandDeaths Location USA (318MM) Western Europe (344MM) Log plot of 7 day average Comparison of COVID-19 Cases & Deaths between US & Europe The numbers on the right are yesterday's figures, and will differ a bit from the plotted rolling mean 2020-09-27 Summary: 6
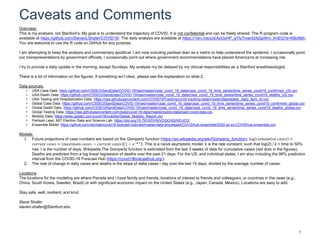
- 7. Non-authoritarian Asian ensemble 129,180 2,589 1 10 100 1,000 10,000 100,000 1,000,000 10,000,000 100,000,000 Cumulative Phase Pre-Model Modeled Deaths Tests Japan, South Korea, Thailand, and Vietnam (Population = 328 MM) Non-authoritarian Asian ensemble projection as of 2020-09-27 1.0 10.0 100.0 1,000.0 CasesandDeaths/Day Cases: 109,906 (745) -- Deaths: 2,042 (5) -- Case Mortality: 1.9% -- Daily Change: -0.5% Cases, -3.4% Deaths 2020-09-27 Summary: 7
- 8. Worldwide cases USA India Brazil Russia Colombia Peru Mexico Spain Argentina SouthAfrica France Chile Iran UnitedKingdom Bangladesh Iraq SaudiArabia Turkey Pakistan Italy Philippines Germany Indonesia Israel Ukraine Canada Ecuador Bolivia Romania Morocco Netherlands Belgium DominicanRepublic Kazakhstan Egypt Sweden China Guatemala Poland Japan Belarus Honduras Portugal Ethiopia Venezuela Nepal CzechRepublic Nigeria Uzbekistan Switzerland Algeria Ghana Kyrgyzstan Austria Azerbaijan Afghanistan Paraguay Kenya Serbia Libya ElSalvador Australia Denmark SouthKorea Hungary USA 0 2,000,000 4,000,000 6,000,000 8,000,000 1 6 11 16 21 26 31 36 41 46 51 56 61 66 Rank Totalcasestodate Worldwide cases Excludes countries with population < 5,000,000 2020-09-27 Summary: 8
- 9. Worldwide cases Israel Chile Peru Brazil USA Spain Colombia Argentina Bolivia SouthAfrica SaudiArabia DominicanRepublic Iraq Belgium Sweden Honduras Ecuador France Kyrgyzstan Russia Belarus UnitedKingdom Kazakhstan Switzerland Portugal Guatemala Iran Netherlands Mexico CzechRepublic Romania Paraguay Italy Austria India Libya Azerbaijan Denmark Canada Serbia Ukraine Turkey ElSalvador Germany Morocco Philippines Bulgaria Venezuela Nepal Hungary Bangladesh Poland Uzbekistan Ghana Finland Pakistan Greece Slovakia Algeria Afghanistan Tunisia Tajikistan Australia Jordan Egypt USA None 1 in 200 1 in 100 1 in 67 1 in 50 1 in 40 1 in 33 1 in 29 1 6 11 16 21 26 31 36 41 46 51 56 61 66 Rank Totalcasestodate Worldwide cases Excludes countries with population < 5,000,000 2020-09-27 Summary: 9
- 10. Average new cases over past 7 days Israel Argentina Spain CzechRepublic Peru France Belgium Colombia Netherlands Brazil USA Iraq Libya Paraguay Chile Denmark UnitedKingdom Hungary Austria Ecuador Ukraine India Jordan Tunisia Portugal Morocco Honduras Romania DominicanRepublic Slovakia Iran Guatemala Russia Bolivia Nepal Switzerland Mexico Sweden Canada Venezuela SouthAfrica Greece Italy Poland Philippines Belarus Bulgaria Turkey Germany Uzbekistan Kyrgyzstan ElSalvador Indonesia SaudiArabia Finland Azerbaijan Myanmar Bangladesh Serbia Mozambique Angola Ethiopia Uganda Zambia Tajikistan USA None 1 in 5,000 1 in 2,500 1 in 1,667 1 in 1,250 1 in 1,000 1 6 11 16 21 26 31 36 41 46 51 56 61 66 Rank Averagecases/day Average new cases over past 7 days Excludes countries with population < 5,000,000 2020-09-27 Summary: 10
- 11. Worldwide deaths USA Brazil India Mexico UnitedKingdom Italy Peru France Spain Iran Colombia Russia SouthAfrica Argentina Chile Ecuador Indonesia Belgium Germany Canada Iraq Turkey Bolivia Pakistan Netherlands Sweden Egypt Philippines Bangladesh China Romania SaudiArabia Ukraine Guatemala Poland Honduras DominicanRepublic Switzerland Morocco Portugal Algeria Kazakhstan Japan Afghanistan Israel Ethiopia Nigeria Kyrgyzstan Australia Sudan ElSalvador Belarus Bulgaria Austria Paraguay Serbia Hungary Kenya Denmark Venezuela CzechRepublic Yemen Azerbaijan Libya Nepal USA 0 50,000 100,000 150,000 200,000 1 6 11 16 21 26 31 36 41 46 51 56 61 66 Rank Totaldeathstodate Worldwide deaths Excludes countries with population < 5,000,000 2020-09-27 Summary: 11
- 12. Worldwide deaths Peru Belgium Bolivia Ecuador Spain Chile Brazil UnitedKingdom Mexico Sweden USA Italy Colombia France Iran Argentina Netherlands SouthAfrica Honduras Iraq Canada Switzerland Guatemala DominicanRepublic Romania Israel Kyrgyzstan Portugal SaudiArabia Russia Denmark ElSalvador Germany Paraguay Kazakhstan Bulgaria Turkey Serbia Austria Ukraine Belarus India Libya Hungary Azerbaijan Egypt Finland Poland Morocco CzechRepublic Philippines Afghanistan Algeria Indonesia Australia Pakistan Greece Bangladesh Sudan Zambia Nicaragua Haiti Yemen Venezuela Senegal USA None 1 in 5,000 1 in 2,500 1 in 1,667 1 in 1,250 1 in 1,000 1 in 833 1 6 11 16 21 26 31 36 41 46 51 56 61 66 Rank Totaldeathstodate Worldwide deaths Excludes countries with population < 5,000,000 2020-09-27 Summary: 12
- 13. Average daily deaths over past 7 days Argentina Colombia Israel Mexico Peru Bolivia Brazil Paraguay Chile Iran USA Honduras Spain Iraq Ecuador Romania Libya SouthAfrica Guatemala Ukraine CzechRepublic Morocco SaudiArabia India Russia Turkey France Hungary DominicanRepublic Netherlands Tunisia Bulgaria Portugal Philippines Greece Belarus Indonesia Poland UnitedKingdom Belgium ElSalvador Austria Nepal Venezuela Italy Myanmar Switzerland Denmark Jordan Angola Kazakhstan Canada Sweden Egypt Bangladesh Azerbaijan Algeria Australia Uzbekistan Kenya Ethiopia Syria Serbia Slovakia Germany USA None 1 in 500,000 1 in 250,000 1 in 166,667 1 in 125,000 1 in 100,000 1 6 11 16 21 26 31 36 41 46 51 56 61 66 Rank Averagedeaths/day Average daily deaths over past 7 days Excludes countries with population < 5,000,000 2020-09-27 Summary: 13
- 14. CV for Cases and Deaths KGZ BEL ITA GBRSWE CMR DEUCANSOM NLDSDN FINTHA PAK BFA SLE CHEMWI MLI FRADNKAFG CIVYEM SRB MYS SSDCOD PRT AUTVNM ESPSEN TCDNICEGY NGA TJKAZEGHA GINKAZ USA PERCHLHTI LKA DZASLVZAF ZWEBRAGTM POLRUS IRNMEX HUNKEN ZMBBLRSAU MDG JPNBGD HND DOM SVKTURKOR CUBBGR IRQCOL ROU AUS IDN CZEGRCETH INDUZB ISRUKRPHL AGOVENPNG TGOBOL SYR ARG MARRWA ECU NPL LBYUGAPRYMOZ TUNJOR MMR 0.001 0.010 0.100 1.000 0.010.01 0.10 1.00 Cases CV DeathsCV Coefficient of variation for cases and deaths as of 2020-09-27 CV calculated over last 28 days 2020-09-27 Summary: 14
- 15. Mortality Trends 0 2 4 6 8 10 12 14 USCaseRateMortality Mortality Type: 13 day rolling median Cumulative Daily Raw Daily vs. Cumulative US Case Rate Mortality Last week excluded because deaths are often backdated 2020-09-27 Summary: 15
- 16. Change in New Cases per Day New cases are: Increasing > +3% Increasing between +1% and +3% No Change (-1% to +1%) Decreasing between -1% and -3% Decreasing > -3% New cases by state as of 2020-09-27 2020-09-27 Summary: 16
- 17. Cases as a Percent of Peak Cases HI TX FL OK LA MS AL GA AZ NM KS AR TN NC SC DC CA UT CO NE MO KY WV VA MD DE OR NV WY SD IA IN OH PA NJ CT RI WA ID MT ND MN IL MI NY MA WI VT NH AK ME 0 25 50 75 100 0 25 50 75 100 0 25 50 75 100 0 25 50 75 100 0 25 50 75 100 0 25 50 75 100 0 25 50 75 100 0 25 50 75 100 PercentofPeak Daily Cases as a Percent of Peak Cases 2020-09-27 Summary: 17
- 18. Change in New Deaths per Day New deaths are: Increasing > +0.5% Increasing between +0.1% and +0.5% No Change (-0.1% to +0.1%) Decreasing between -0.1% and -0.5% Decreasing > -0.5% New deaths by state as of 2020-09-27 2020-09-27 Summary: 18
- 19. Deaths as a Percent of Peak Deaths HI TX FL OK LA MS AL GA AZ NM KS AR TN NC SC DC CA UT CO NE MO KY WV VA MD DE OR NV WY SD IA IN OH PA NJ CT RI WA ID MT ND MN IL MI NY MA WI VT NH AK ME 0 25 50 75 100 0 25 50 75 100 0 25 50 75 100 0 25 50 75 100 0 25 50 75 100 0 25 50 75 100 0 25 50 75 100 0 25 50 75 100 PercentofPeak Daily Deaths as a Percent of Peak Deaths 2020-09-27 Summary: 19
- 20. Change in cases vs. change in deaths over last 14 days AL AK AZ AR CA CO CT DC FL GA HI ID ILIN IA KS KY LA ME MD MA MN MS MO MT NE NV NJ NM NY NC ND OH OK OR PA RI SC TN TX UTVT VA WA WI WY-6 -3 0 3 6 -6 -3 0 3 6 Change in cases (%/day) Changeindeaths(%/day) Change in cases vs. change in deaths over last 14 days as of 2020-09-27 Size is proportional total cases per capita 2020-09-27 Summary: 20
- 21. Total US COVID-19 Cases California Texas Florida NewYork Georgia Illinois Arizona NorthCarolina NewJersey Tennessee Louisiana Pennsylvania Alabama Ohio SouthCarolina Virginia Michigan Massachusetts Missouri Maryland Indiana Wisconsin Mississippi Minnesota Iowa Washington Oklahoma Arkansas Nevada Utah Colorado Kentucky Kansas Connecticut Nebraska Idaho Oregon NewMexico RhodeIsland SouthDakota NorthDakota Delaware DistrictofColumbia WestVirginia Hawaii Montana NewHampshire Alaska Wyoming Maine Vermont 0 250,000 500,000 750,000 1 6 11 16 21 26 31 36 41 46 51 Rank Totalcases Masks No Yes Governor aa Democratic Republican Total US COVID-19 Cases p masks as of July 20, 2020: 0.59, p governor: 0.9. NB: association != causation. 2020-09-27 Summary: 21
- 22. Total US COVID-19 Cases Louisiana Florida Mississippi Alabama Arizona Georgia SouthCarolina Tennessee Iowa Arkansas NorthDakota Texas Nevada SouthDakota NewYork RhodeIsland NewJersey Illinois Idaho Nebraska Utah DistrictofColumbia Oklahoma Delaware California Maryland Missouri NorthCarolina Wisconsin Kansas Massachusetts Indiana Virginia Minnesota Connecticut Kentucky NewMexico Michigan Ohio Pennsylvania Colorado Washington Montana Alaska Wyoming Hawaii WestVirginia Oregon NewHampshire Maine Vermont None 1 in 100 1 in 50 1 in 33 1 in 25 1 6 11 16 21 26 31 36 41 46 51 Rank TotalCases Masks No Yes Governor aa Democratic Republican Total US COVID-19 Cases p masks as of July 20, 2020: 0.14, p governor: 0.019. NB: association != causation. 2020-09-27 Summary: 22
- 23. Average US COVID-19 cases over the past 7 days NorthDakota SouthDakota Wisconsin Utah Oklahoma Iowa Arkansas Missouri Montana Idaho Alabama SouthCarolina Texas Nebraska Kansas Tennessee NorthCarolina Mississippi Minnesota Kentucky Illinois Wyoming Nevada Georgia Indiana Alaska Florida WestVirginia Colorado Delaware Louisiana Virginia California Michigan RhodeIsland Maryland NewMexico Ohio Hawaii Washington Arizona Oregon DistrictofColumbia Massachusetts Pennsylvania NewJersey NewYork Connecticut NewHampshire Maine Vermont None 1 in 10,000 1 in 5,000 1 in 3,333 1 in 2,500 1 in 2,000 1 6 11 16 21 26 31 36 41 46 51 Rank NewCases/Day Masks No Yes Governor aa Democratic Republican Average US COVID-19 cases over the past 7 days p masks as of July 20, 2020: 0.0027, p governor: 0.0042. NB: association != causation. 2020-09-27 Summary: 23
- 24. Total US COVID-19 Deaths NewYork NewJersey Texas California Florida Massachusetts Illinois Pennsylvania Michigan Georgia Arizona Louisiana Ohio Connecticut Maryland Indiana NorthCarolina SouthCarolina Virginia Mississippi Alabama Tennessee Washington Minnesota Missouri Colorado Nevada Iowa Arkansas Wisconsin Kentucky RhodeIsland Oklahoma NewMexico Kansas Delaware DistrictofColumbia Oregon Nebraska Idaho Utah NewHampshire WestVirginia NorthDakota SouthDakota Montana Maine Hawaii Vermont Alaska Wyoming 0 10,000 20,000 30,000 1 6 11 16 21 26 31 36 41 46 51 Rank TotalDeaths Masks No Yes Governor aa Democratic Republican Total US COVID-19 Deaths p masks as of July 20, 2020: 0.072, p governor: 0.3. NB: association != causation. 2020-09-27 Summary: 24
- 25. Total US COVID-19 Deaths NewJersey NewYork Massachusetts Connecticut Louisiana RhodeIsland Mississippi DistrictofColumbia Arizona Michigan Illinois Florida Georgia Delaware Maryland SouthCarolina Pennsylvania Texas Indiana Nevada Alabama Arkansas Iowa NewMexico Ohio California Virginia Minnesota Colorado Tennessee Missouri NorthCarolina NewHampshire NorthDakota Washington Kentucky Idaho Oklahoma SouthDakota Nebraska Wisconsin Kansas WestVirginia Montana Utah Oregon Maine Vermont Hawaii Wyoming Alaska None 1 in 2,000 1 in 1,000 1 in 667 1 in 500 1 6 11 16 21 26 31 36 41 46 51 Rank TotalDeaths Masks No Yes Governor aa Democratic Republican Total US COVID-19 Deaths p masks as of July 20, 2020: 0.035, p governor: 0.38. NB: association != causation. 2020-09-27 Summary: 25
- 26. Average US COVID-19 deaths over the past 7 days NorthDakota Mississippi Missouri Arkansas Florida Georgia SouthCarolina Texas Tennessee SouthDakota Arizona Montana Virginia NorthCarolina Louisiana WestVirginia Nevada RhodeIsland Massachusetts California Oklahoma Alabama Iowa Illinois Kansas Nebraska NewMexico Delaware Pennsylvania Idaho Indiana Kentucky Ohio Minnesota Alaska Maryland Michigan Washington Hawaii Wisconsin DistrictofColumbia Colorado Oregon NewJersey Utah Connecticut NewYork Maine NewHampshire Vermont Wyoming None 1 in 500,000 1 in 250,000 1 in 166,667 1 in 125,000 1 6 11 16 21 26 31 36 41 46 51 Rank Deaths/Day Masks No Yes Governor aa Democratic Republican Average US COVID-19 deaths over the past 7 days p masks as of July 20, 2020: 0.27, p governor: 0.014. NB: association != causation. 2020-09-27 Summary: 26
- 27. Daily testing trends HI TX FL OK LA MS AL GA AZ NM KS AR TN NC SC DC CA UT CO NE MO KY WV VA MD DE OR NV WY SD IA IN OH PA NJ CT RI WA ID MT ND MN IL MI NY MA WI VT NH AK ME min max min max min max min max min max min max min max min max Dailytestingfrommintomax Daily testing trends from min to max Line = Friedman's supersmoother 2020-09-27 Summary: 27
- 28. Change in daily tests over past 14 days Utah SouthCarolina Wisconsin Colorado Minnesota NewMexico Idaho NorthCarolina Florida SouthDakota Oklahoma Ohio Kentucky WestVirginia Illinois Wyoming Michigan Arizona Nevada Montana Missouri DistrictofColumbia NorthDakota Virginia Arkansas Connecticut Maine NewYork Texas Washington NewHampshire Tennessee Iowa Kansas Mississippi Nebraska NewJersey Massachusetts Louisiana Indiana California Vermont Pennsylvania Oregon Delaware RhodeIsland Alaska Maryland Georgia Alabama Hawaii -6.0 -3.0 0.0 3.0 1 6 11 16 21 26 31 36 41 46 51 Rank Changeindailytests(%/day) Masks No Yes Governor aa Democratic Republican Change in daily tests over past 14 days p masks as of July 20, 2020: 0.26, p governor: 0.76. NB: association != causation. 2020-09-27 Summary: 28
- 29. Percent Tested Alaska NewYork DistrictofColumbia Louisiana Illinois NewMexico Connecticut Tennessee NewJersey California Michigan Massachusetts RhodeIsland Arkansas NorthDakota Montana WestVirginia Maine Oklahoma Delaware Kentucky NorthCarolina Georgia Maryland Wisconsin Ohio Vermont Utah Mississippi Florida Minnesota SouthCarolina Iowa Washington Virginia Alabama Nebraska Nevada SouthDakota Missouri Texas Hawaii Indiana Arizona NewHampshire Kansas Wyoming Idaho Oregon Pennsylvania Colorado 0 20 40 60 1 6 11 16 21 26 31 36 41 46 51 Rank PercentTested Masks No Yes Governor aa Democratic Republican Percent Tested p masks as of July 20, 2020: 0.032, p governor: 0.13. NB: association != causation. 2020-09-27 Summary: 29
- 30. Percent of Positive COVID Tests Arizona Alabama Florida Mississippi Idaho Texas SouthCarolina Nevada SouthDakota Kansas Iowa Georgia Nebraska Missouri Utah Indiana NorthDakota Arkansas Wisconsin Pennsylvania Colorado Maryland RhodeIsland Louisiana Virginia Oklahoma Delaware NorthCarolina Minnesota Tennessee Massachusetts NewJersey California Wyoming Illinois Kentucky Ohio Oregon Washington NewYork Hawaii DistrictofColumbia Michigan Connecticut Montana NewMexico NewHampshire WestVirginia Alaska Maine Vermont 0.0 5.0 10.0 15.0 1 6 11 16 21 26 31 36 41 46 51 Rank PercentofPositiveTests Masks No Yes Governor aa Democratic Republican Percent of Positive COVID Tests p masks as of July 20, 2020: 0.0064, p governor: 0.0023. NB: association != causation. 2020-09-27 Summary: 30
- 31. Positive fraction trends HI TX FL OK LA MS AL GA AZ NM KS AR TN NC SC DC CA UT CO NE MO KY WV VA MD DE OR NV WY SD IA IN OH PA NJ CT RI WA ID MT ND MN IL MI NY MA WI VT NH AK ME min max min max min max min max min max min max min max min max Fractionpositivefrommintomax Positive fraction trends from min to max 2020-09-27 Summary: 31
- 32. Change in positive tests over past 14 days NorthDakota Wisconsin Wyoming Montana SouthDakota Utah WestVirginia Iowa Missouri Kansas Alaska Idaho Oklahoma Nebraska Minnesota Oregon Arkansas Indiana Alabama Nevada Colorado Delaware Florida Texas Hawaii NorthCarolina Pennsylvania Washington RhodeIsland Tennessee NewMexico Maryland Vermont Georgia Michigan Virginia Illinois Louisiana NewHampshire California SouthCarolina Arizona Massachusetts Ohio NewJersey Connecticut NewYork DistrictofColumbia Mississippi Kentucky Maine -1.0 0.0 1.0 1 6 11 16 21 26 31 36 41 46 51 Rank Changeinpositivetests(%/day) Masks No Yes Governor aa Democratic Republican Change in positive tests over past 14 days p masks as of July 20, 2020: 0.017, p governor: 0.027. NB: association != causation. 2020-09-27 Summary: 32
- 33. Change in tests vs. change in positive tests over last 14 days AL AK AZ AR CA CO CT DE DC FL GA HI ID IL IN IA KYME MN MS MT NV NH NJ NM NC ND OH OK OR RI SC SD TN UT VT WV WI WY -1 0 1 -5.0 -2.5 0.0 2.5 5.0 Change in tests (%/day) Changeinpositivetests(%/day) Change in tests vs. change in positive tests over last 14 days as of 2020-09-27 Size is proportional daily deaths per capita over the past 7 days 2020-09-27 Summary: 33
- 34. Current hospitalizations as a percent of peak since FebruaryMissouri Nebraska NorthDakota SouthDakota WestVirginia Wisconsin Wyoming Alaska Oklahoma Kansas Arkansas Montana Iowa Utah Kentucky NorthCarolina Oregon Idaho Virginia Georgia Tennessee Hawaii Indiana Minnesota Ohio Mississippi Alabama SouthCarolina Washington Nevada California NewMexico Illinois Texas RhodeIsland Louisiana Colorado Maine Florida DistrictofColumbia Maryland Delaware Pennsylvania Arizona Michigan NewHampshire Massachusetts NewJersey Connecticut Vermont NewYork 0 30 60 90 1 6 11 16 21 26 31 36 41 46 51 Rank Hospitalizations(%ofpeak) Masks No Yes Governor aa Democratic Republican Current hospitalizations as a percent of peak since February p masks as of July 20, 2020: 0.0027, p governor: 0.04. NB: association != causation. 2020-09-27 Summary: 34
- 35. Hospitalizations trends HI TX FL OK LA MS AL GA AZ NM KS AR TN NC SC DC CA UT CO NE MO KY WV VA MD DE OR NV WY SD IA IN OH PA NJ CT RI WA ID MT ND MN IL MI NY MA WI VT NH AK ME min max min max min max min max min max min max min max min max Hospitalizationsfrommintomax Hospitalizations trends from min to max 2020-09-27 Summary: 35
- 36. Change in hospitalizations over past 14 days NewHampshire SouthDakota Wisconsin Wyoming NorthDakota Oregon Minnesota Connecticut Kansas Nebraska Utah Arkansas Oklahoma Maine Massachusetts RhodeIsland WestVirginia Alaska NewYork Missouri DistrictofColumbia Iowa NewMexico Colorado Illinois NorthCarolina Washington Mississippi SouthCarolina Indiana NewJersey Alabama Kentucky Idaho Montana Texas Delaware Maryland Virginia Arizona Pennsylvania Nevada Ohio Georgia Tennessee Michigan California Louisiana Florida Hawaii Vermont -8.0 -4.0 0.0 4.0 1 6 11 16 21 26 31 36 41 46 51 Rank Changeinhospitalizations(%/day) Masks No Yes Governor aa Democratic Republican Change in hospitalizations over past 14 days p masks as of July 20, 2020: 0.25, p governor: 0.42. NB: association != causation. 2020-09-27 Summary: 36
- 37. CV for Cases and Deaths IN IL CA MAIA NCMD FL COTX WISC MS NMLA NV MNOKKY GA WA TN AZ WVPA MI OR MTDC HI NJRIAL UTID KS AR CTNYOH DE SDMO NEVA NDME AKNH WY 0.010.01 0.10 1.00 0.010.01 0.10 1.00 Cases CV DeathsCV Coefficient of variation for cases and deaths as of 2020-09-27 CV calculated over last 28 days 2020-09-27 Summary: 37
- 38. Change in New Cases per Day Direction Increasing > +2% Increasing between +0.5% and +2% No Change (-0.5% to +0.5%) Decreasing between -0.5% and -2% Decreasing > -2% NA Trends by county as of 2020-09-27 NA = Inadequate data 2020-09-27 Summary: 38