Recommended
PPTX
Demo-Behaviour-of-the-Graph-of-a-Quadratic-Function.pptx
PPTX
PPTX
Alg II Unit 4-1 Quadratic Functions and Transformations
PPTX
First Quarter: Quadratic Functions Notes.pptx
PPTX
MODELLING REPRESENTING Quadratic function
PPTX
PDF
PDF
PPTX
PPTX
PPTX
lesson on Graphs of a Quadratic Functions.pptx
PPT
G9-Math-Q1-Week-7.1-Graph-of-Quadratic-Function.ppt
PPT
DOC
Mathematics 9 Quadratic Functions (Module 2)
PPT
Lecture 7 quadratic equations
PPT
Algebra 2. 9.16 Quadratics 2
PPT
BUSINESS ABOUT HOW TO GET A REALLLY JOB.ppt
PPT
PPTX
Transfroming Quadratic Funct in SF to VF
PPT
ENVIRONMENT ABOUT NATURE AND THE THINHS .ppt
PPT
Introduction of Quadratic Functions and its graph
PPT
DESIGN ABOUT HOW TO REALYY DESIGN THE PICTURES.ppt
PPTX
Graph of Quadratic Function.pptx
PPTX
Graph of quadratic function
PPTX
PPTX
Graphing Quadratic Functions.pptx
PPTX
QI quadratic-function1 in mathematics 9.pptx
PPTX
QUADRATIC FUNCTION MATH FORM 4 KSSM 2021 DISCUSSION PART 1
PDF
[DSC Europe 25] Elena Menshikova - AI-Powered Operational Excellence: Revolut...
PPTX
Data Storytelling with Power BI: From Raw Data to Executive Dashboards
More Related Content
PPTX
Demo-Behaviour-of-the-Graph-of-a-Quadratic-Function.pptx
PPTX
PPTX
Alg II Unit 4-1 Quadratic Functions and Transformations
PPTX
First Quarter: Quadratic Functions Notes.pptx
PPTX
MODELLING REPRESENTING Quadratic function
PPTX
PDF
PDF
Similar to COT 1 Presentation.pptx AND LESSON OBJECTIVES
PPTX
PPTX
PPTX
lesson on Graphs of a Quadratic Functions.pptx
PPT
G9-Math-Q1-Week-7.1-Graph-of-Quadratic-Function.ppt
PPT
DOC
Mathematics 9 Quadratic Functions (Module 2)
PPT
Lecture 7 quadratic equations
PPT
Algebra 2. 9.16 Quadratics 2
PPT
BUSINESS ABOUT HOW TO GET A REALLLY JOB.ppt
PPT
PPTX
Transfroming Quadratic Funct in SF to VF
PPT
ENVIRONMENT ABOUT NATURE AND THE THINHS .ppt
PPT
Introduction of Quadratic Functions and its graph
PPT
DESIGN ABOUT HOW TO REALYY DESIGN THE PICTURES.ppt
PPTX
Graph of Quadratic Function.pptx
PPTX
Graph of quadratic function
PPTX
PPTX
Graphing Quadratic Functions.pptx
PPTX
QI quadratic-function1 in mathematics 9.pptx
PPTX
QUADRATIC FUNCTION MATH FORM 4 KSSM 2021 DISCUSSION PART 1
Recently uploaded
PDF
[DSC Europe 25] Elena Menshikova - AI-Powered Operational Excellence: Revolut...
PPTX
Data Storytelling with Power BI: From Raw Data to Executive Dashboards
PPTX
Investigatory-Project-on-Drug-Addiction-Final.pptx
PDF
Importance of Python language in Data Science
PPTX
[DSC Europe 25] Slobodan Dolinic - Smart and Intelligent Green Region.pptx
PPTX
Computer Fundamentals-1_9facced54627132ad872ee2f20e2bd86.pptx
PPTX
Agentic AI Presentation | PowerPoint Presentation | Generative AI | Artificia...
DOCX
G5_ENGLISH_DLL_Q3_W7. grade 5 lesson log
PPTX
aaaaaaaaaaaaaaaaaaaaaCloud Computing.pptx
PDF
[DSC Europe 25] Stefan Brankovic - #ResumeIsDead. AI-Powered Interviews and C...
PPTX
GROUP20720-20SCIENCE20THE20GALAXY203-2.pptx
PDF
Stop Guessing: A Simple Guide to Understanding Customer Behavior
PPTX
[DSC Europe 25] Ivan Lukovic & Marija Djukic - From Data to Value: Why Maturi...
PDF
[DSC Europe 25] Danilo Djukanovic - From Vibes to KPIs: Turning Culture Into ...
PDF
AWSCertifiedGenerativeAIDeveloper111.pdf
PPTX
Hepatitis.pptx slideshare by me myself and you nknkhk
PDF
pharmacology-230104185759-a3feb3afkgtvjy
PPTX
Social_Work_DIASS_Presentation.pptx owner
PPTX
[DSC Europe 25] Srba Markovic - From Pilot to Production: Overcoming AI Deplo...
PDF
Big Data Analytics – Concepts, Tools & Business Value from hdata system
COT 1 Presentation.pptx AND LESSON OBJECTIVES 1. OBJECTIVES:
a. Graph Quadratic Function and Linear
Function,
b. Differentiate the graph of Linear Function
and Quadratic Function, and
c. Participate actively in class activities.
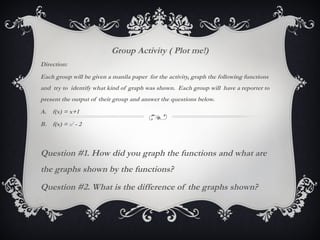
2. 3. Group Activity ( Plot me!)
Direction:
Each group will be given a manila paper for the activity, graph the following functions
and try to identify what kind of graph was shown. Each group will have a reporter to
present the output of their group and answer the questions below.
A. f(x) = x+1
B. f(x) = x2
- 2
Question #1. How did you graph the functions and what are
the graphs shown by the functions?
Question #2. What is the difference of the graphs shown?
4. The graph of a quadratic function
y = ax2 + bx + c is called parabola.
If the value of a > 0, the parabola opens upward and has a minimum
point. If a < 0, the parabola opens downward and has a maximum
point. There is a line called the axis of symmetry which divides the graph
into two parts such that one-half of the graph is a reflection of the other half.
5. Quiz: In a ¼ sheet of paper. Graph the function and describe whether the
parabola opens upward or downward.
1. f(x) = x2
- 2
6.


![[DSC Europe 25] Elena Menshikova - AI-Powered Operational Excellence: Revolut...](https://cdn.slidesharecdn.com/ss_thumbnails/es6nholbqy3zaao2c2yd-2-elena-menshikova-data-ai-in-decision-making-260115093812-4fba8b38-thumbnail.jpg?width=640&height=640&fit=bounds)


![[DSC Europe 25] Slobodan Dolinic - Smart and Intelligent Green Region.pptx](https://cdn.slidesharecdn.com/ss_thumbnails/0bribinjsp6ghwtvsvor-2-sigre-slobodan-dolinic-260115093812-c9c10e90-thumbnail.jpg?width=640&height=640&fit=bounds)


![[DSC Europe 25] Stefan Brankovic - #ResumeIsDead. AI-Powered Interviews and C...](https://cdn.slidesharecdn.com/ss_thumbnails/qnmbsv0xq3uysdrq3sev-2-stefan-brankovic-job-bolt-260114111931-a065aa3d-thumbnail.jpg?width=640&height=640&fit=bounds)


![[DSC Europe 25] Ivan Lukovic & Marija Djukic - From Data to Value: Why Maturi...](https://cdn.slidesharecdn.com/ss_thumbnails/ahrfps8xr6knowwhacxh-1-ivan-marija-dsc-2025-ld-v1-presentation-260115093812-be21adfc-thumbnail.jpg?width=640&height=640&fit=bounds)
![[DSC Europe 25] Danilo Djukanovic - From Vibes to KPIs: Turning Culture Into ...](https://cdn.slidesharecdn.com/ss_thumbnails/inqestws5wf0cik2glgv-3-danilo-djukanovic-from-vibes-to-kpis-presentation-260114111931-dacff81f-thumbnail.jpg?width=640&height=640&fit=bounds)


![[DSC Europe 25] Srba Markovic - From Pilot to Production: Overcoming AI Deplo...](https://cdn.slidesharecdn.com/ss_thumbnails/yjjmrtytmwbalxlba7px-4-srba-markovic-from-pilot-to-production-overcoming-ai-deployment-blockers-with-260114111931-4a892d44-thumbnail.jpg?width=640&height=640&fit=bounds)
