This document discusses a presentation on cost-effectiveness analysis given by a group of four students. It defines cost-effectiveness analysis, explains how it differs from cost-benefit analysis, and when it is useful. It also describes what constitutes a cost in CEA and how to calculate cost-effectiveness ratios and incremental cost-effectiveness ratios. Examples are given of how to use CEA to evaluate both independent and mutually exclusive interventions. The document concludes by listing some applications of CEA and providing references.

![Programm
e
Costs (£)
[C]
Effects
(life-years
gained)
[E]
Increment
al cost
[∆C]
Increment
al effect
[∆E]
ICER
[∆C/∆E]
P1 125,000 1,300 125,000 1,300 96.15
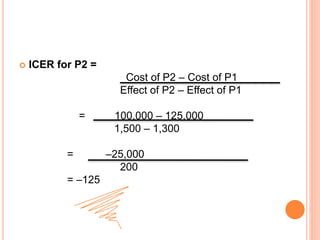
P2 100,000 1,500 –25,000 200 –125
P3 160,000 2,000 60,000 500 120
P4 140,000 2,200 –20,000 200 –100
P5 170,000 2,600 30,000 400 75
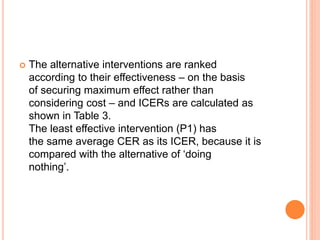
Incremental cost-effectiveness ratios
Mutually exclusive interventions](https://image.slidesharecdn.com/costeffectivenessanalysis-190329224533/85/Cost-effectiveness-analysis-15-320.jpg)