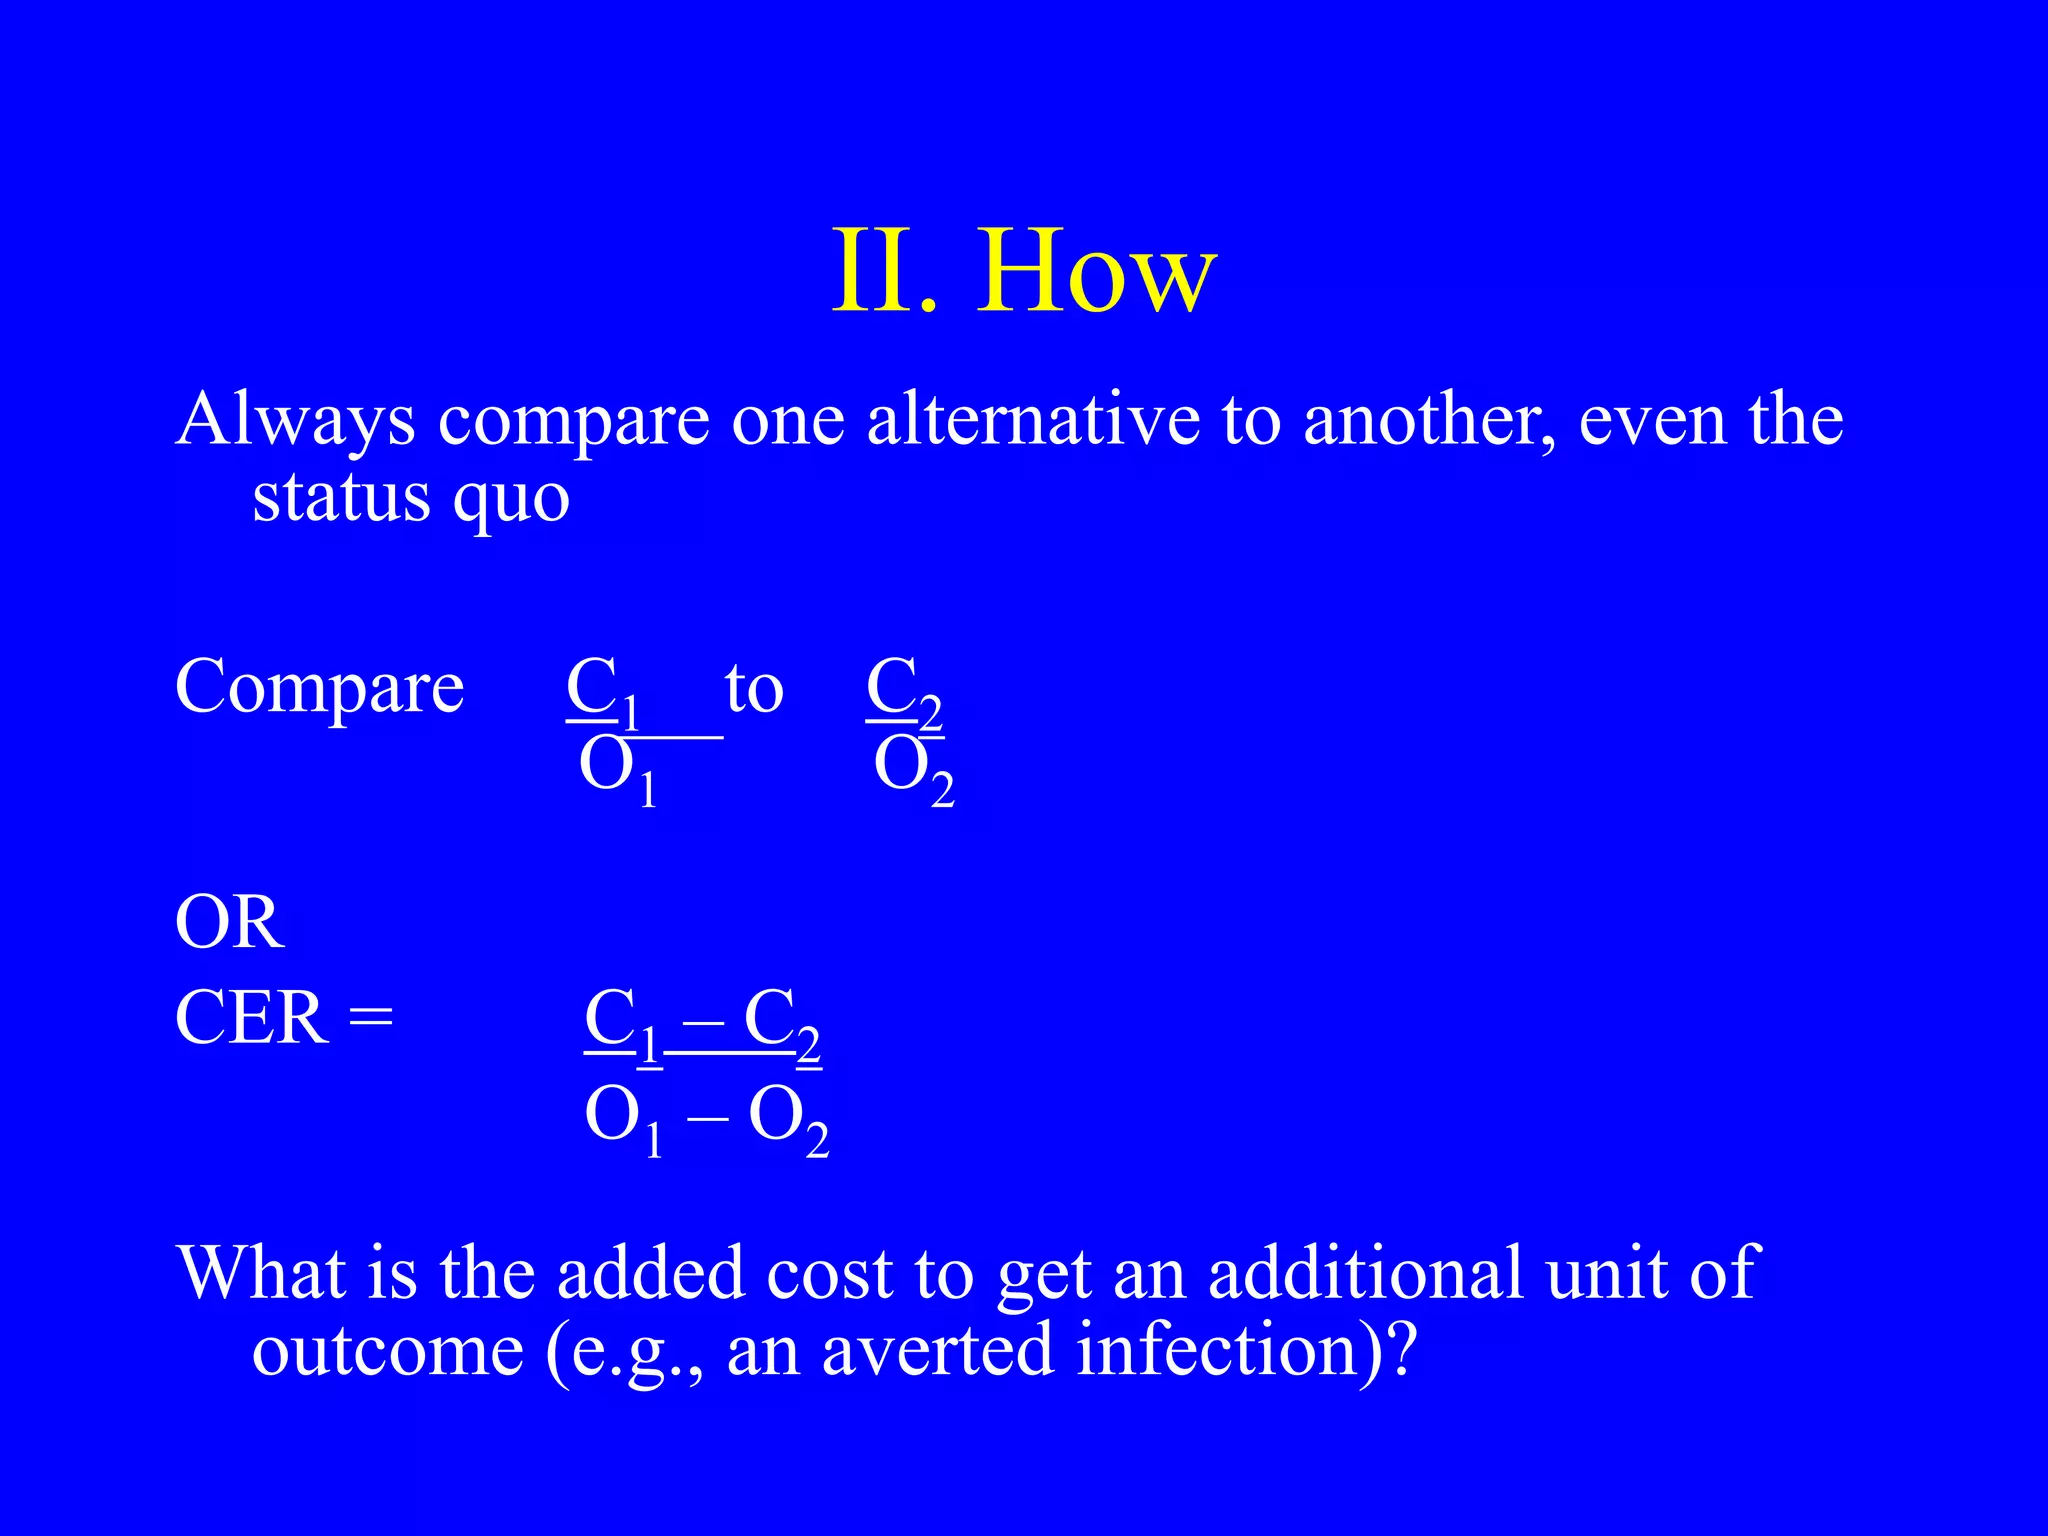
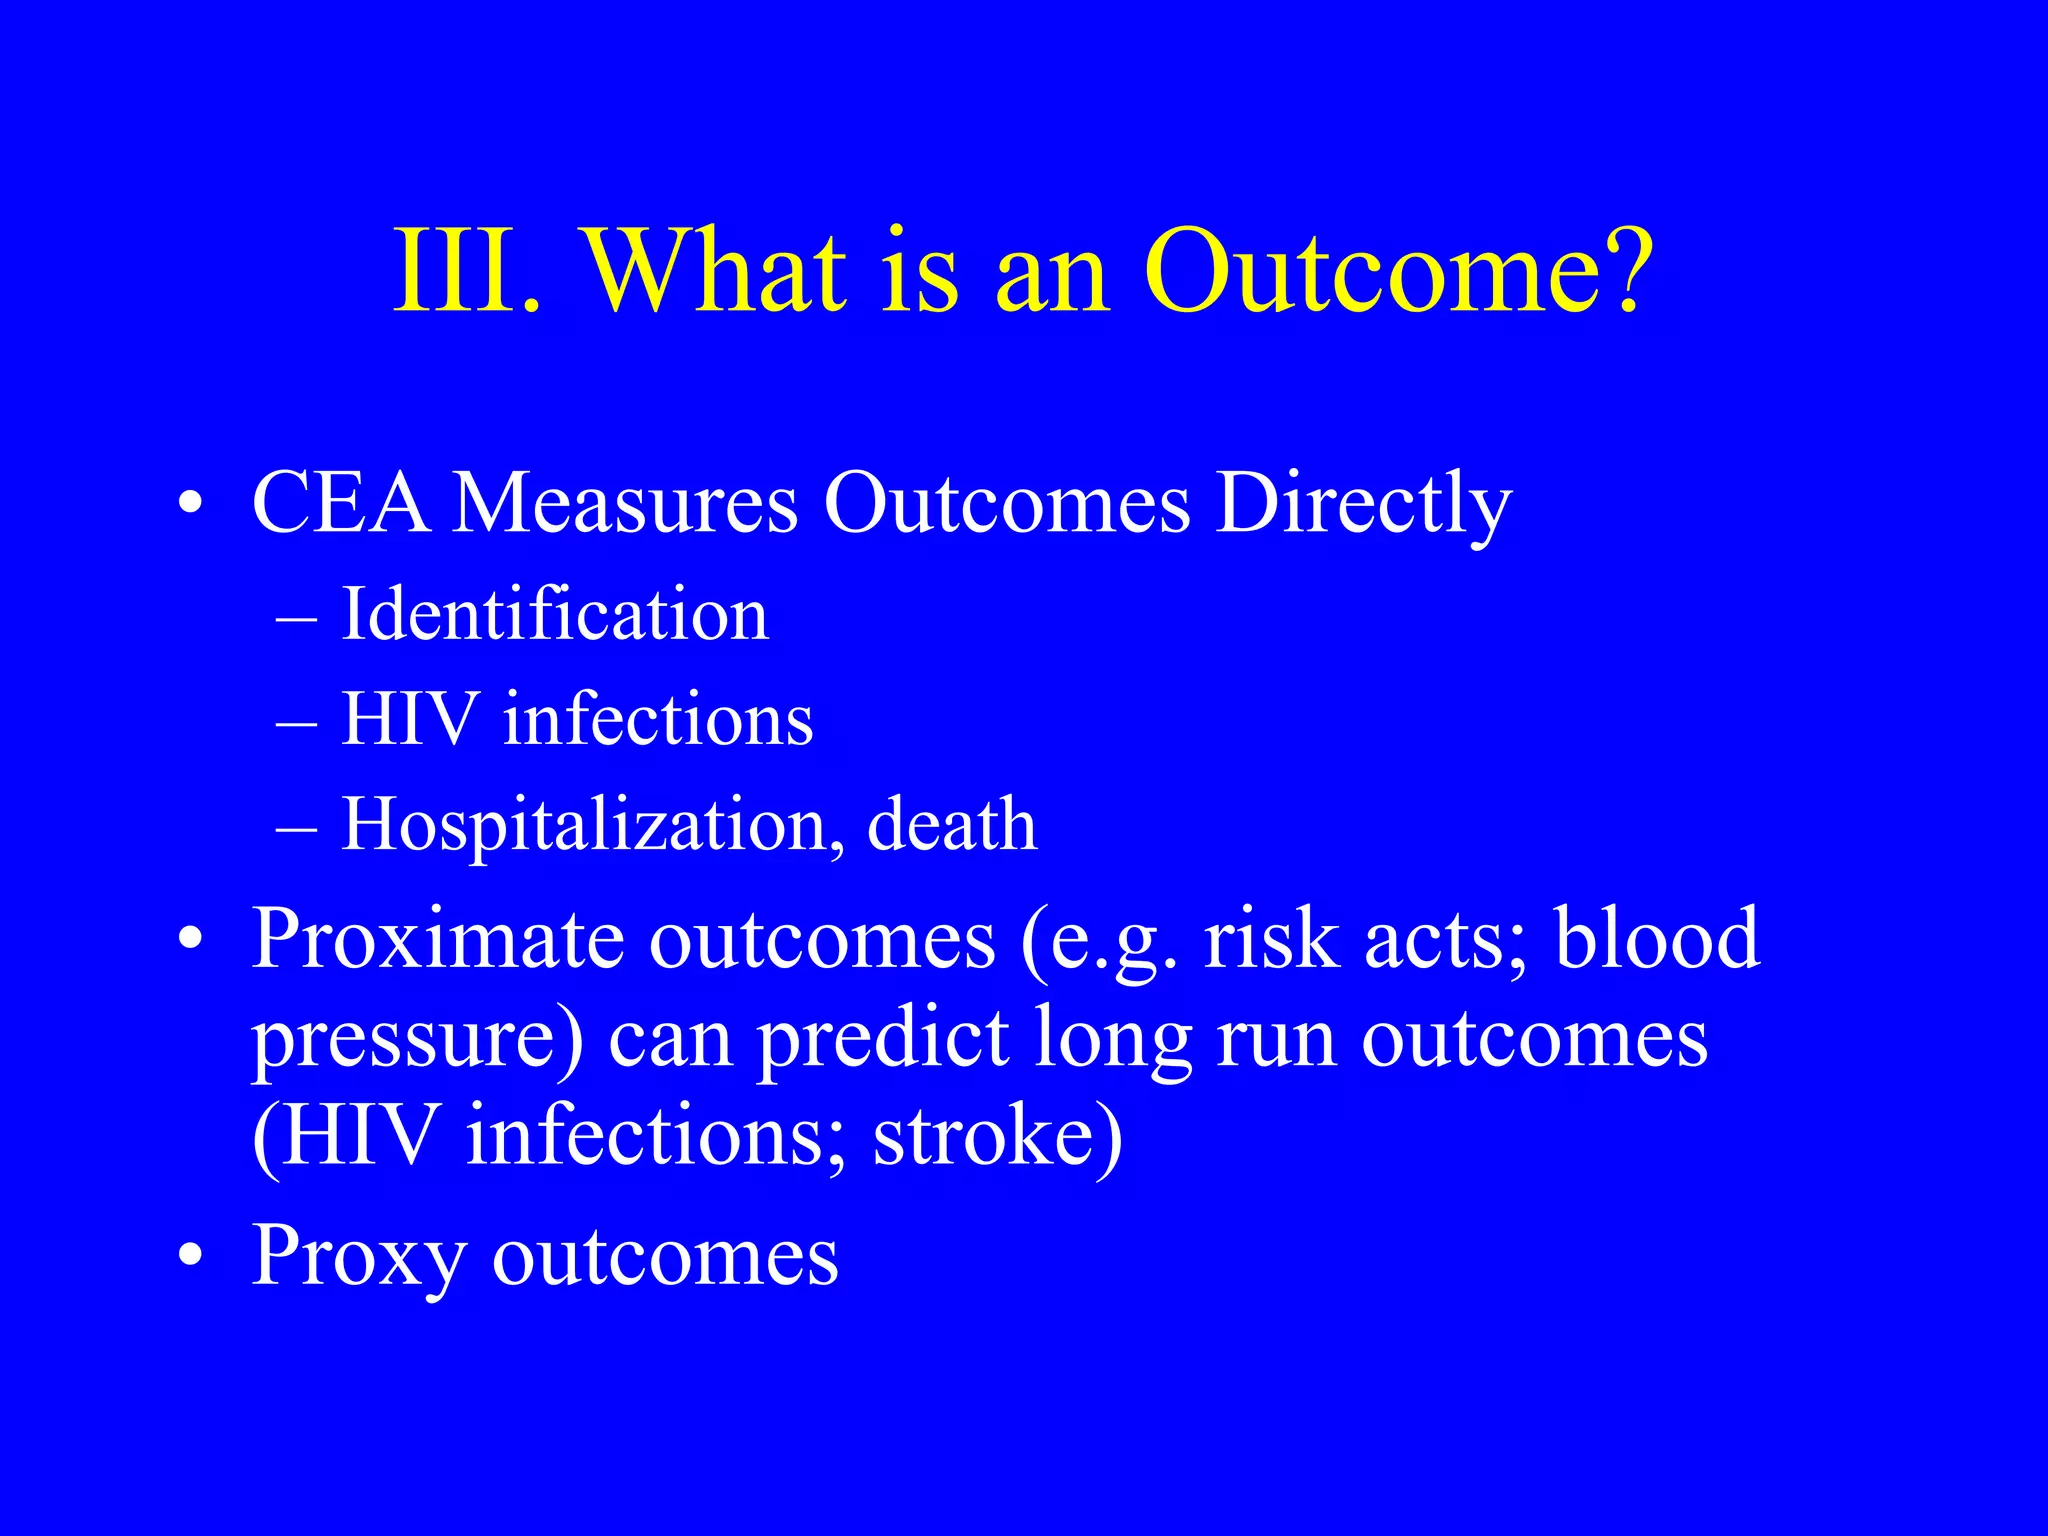
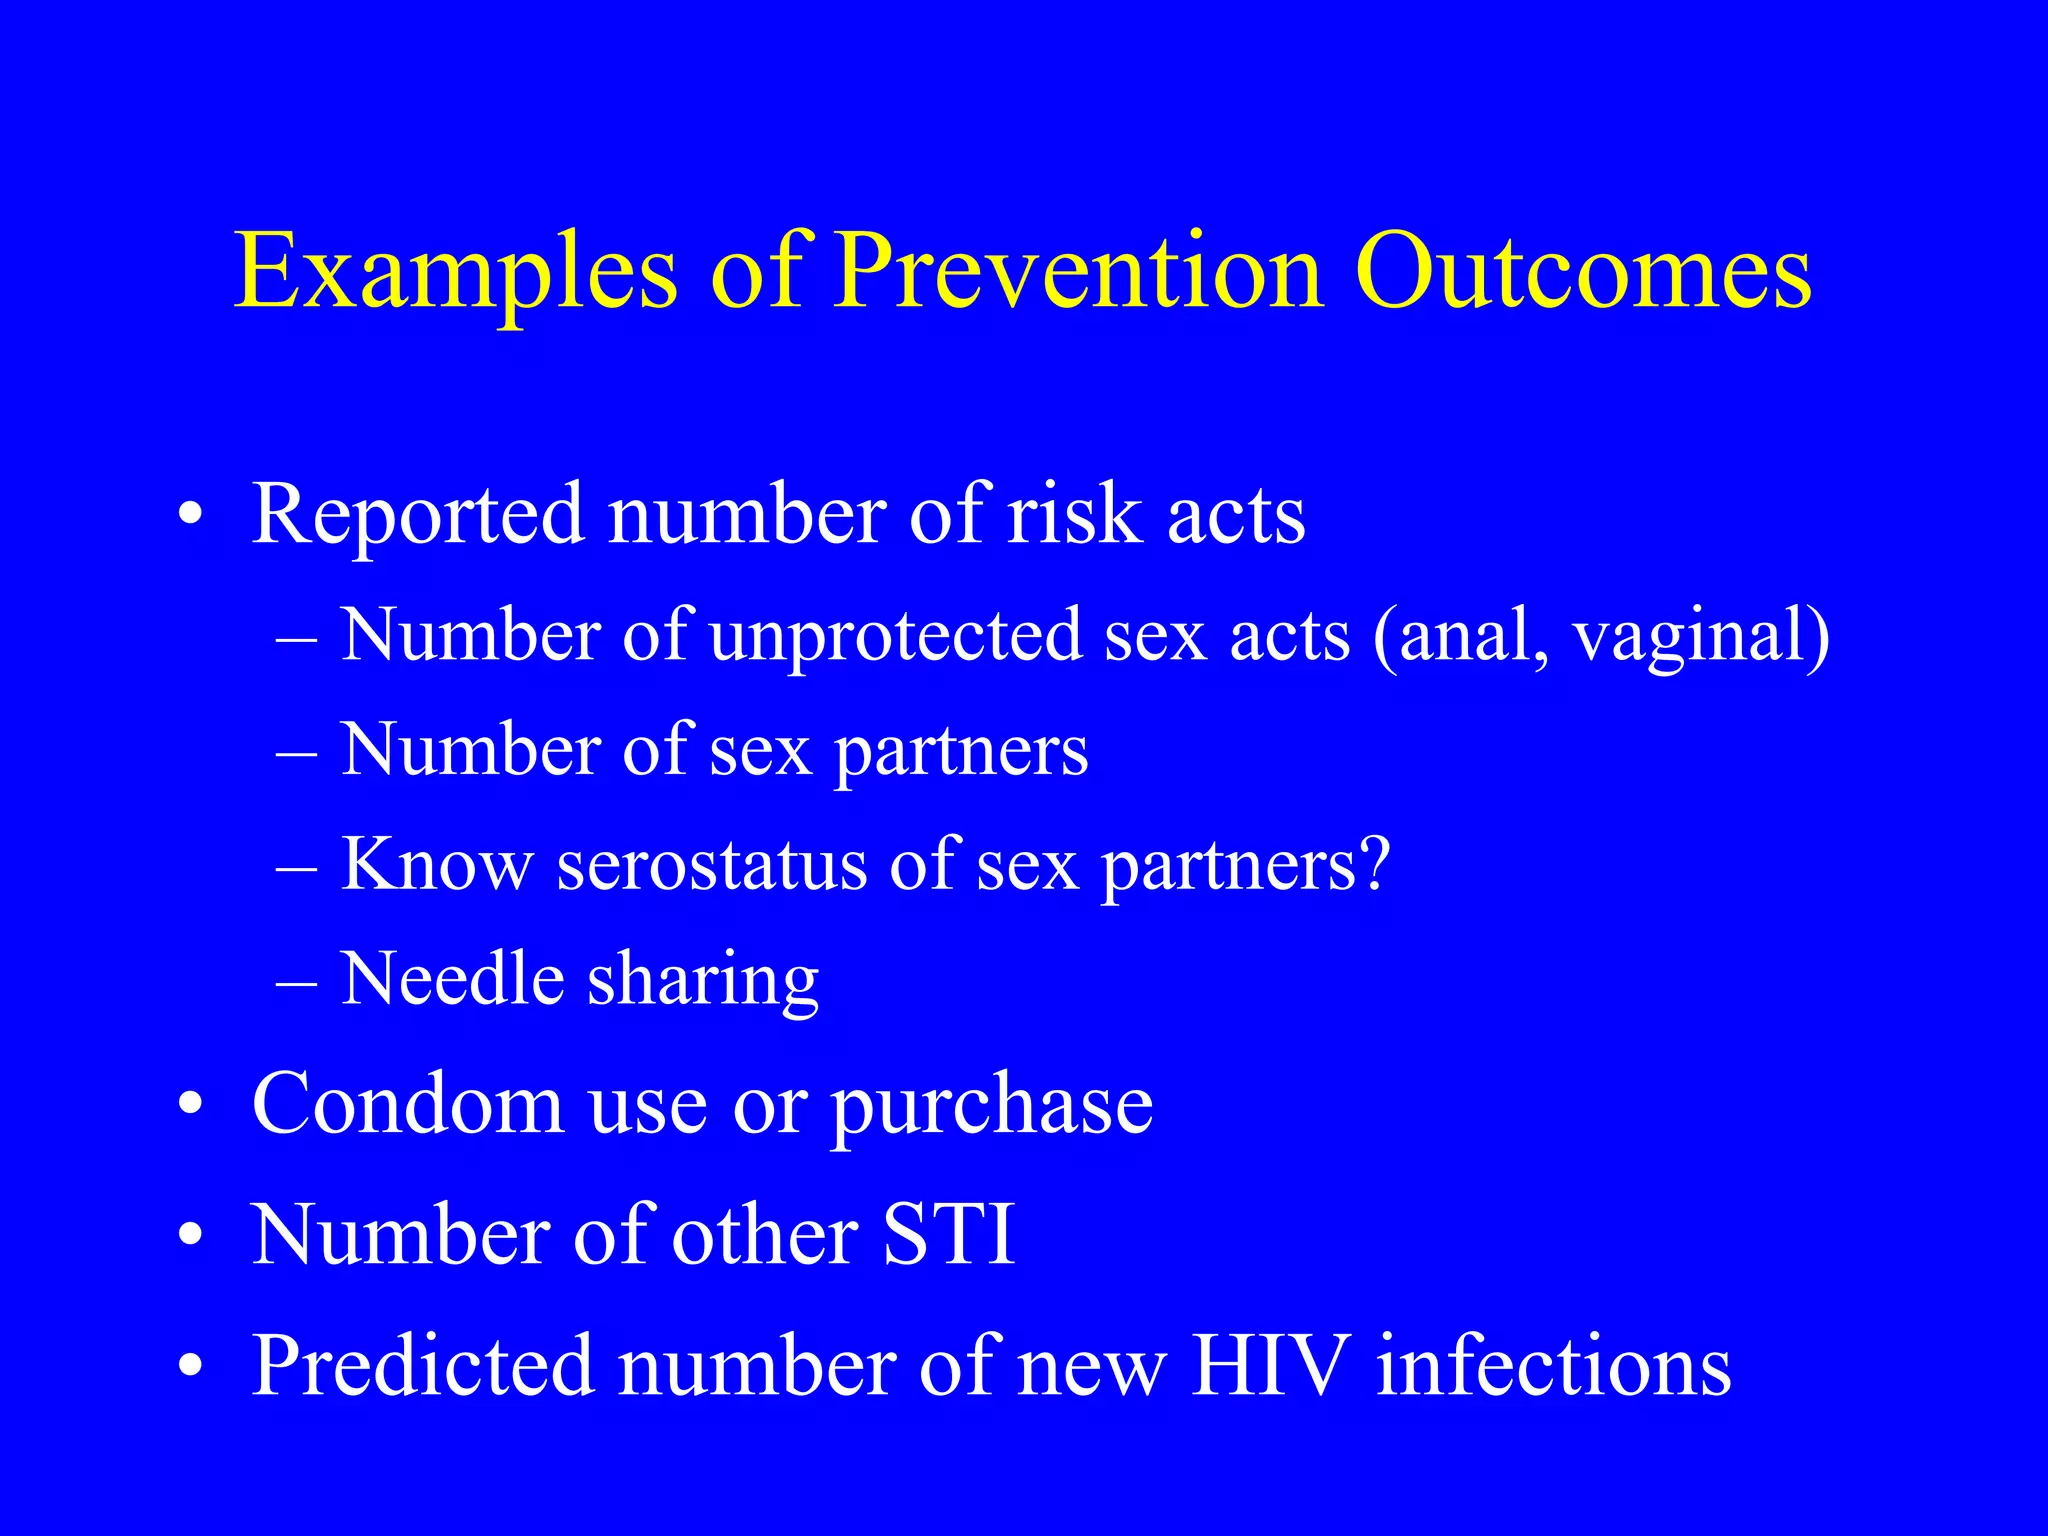
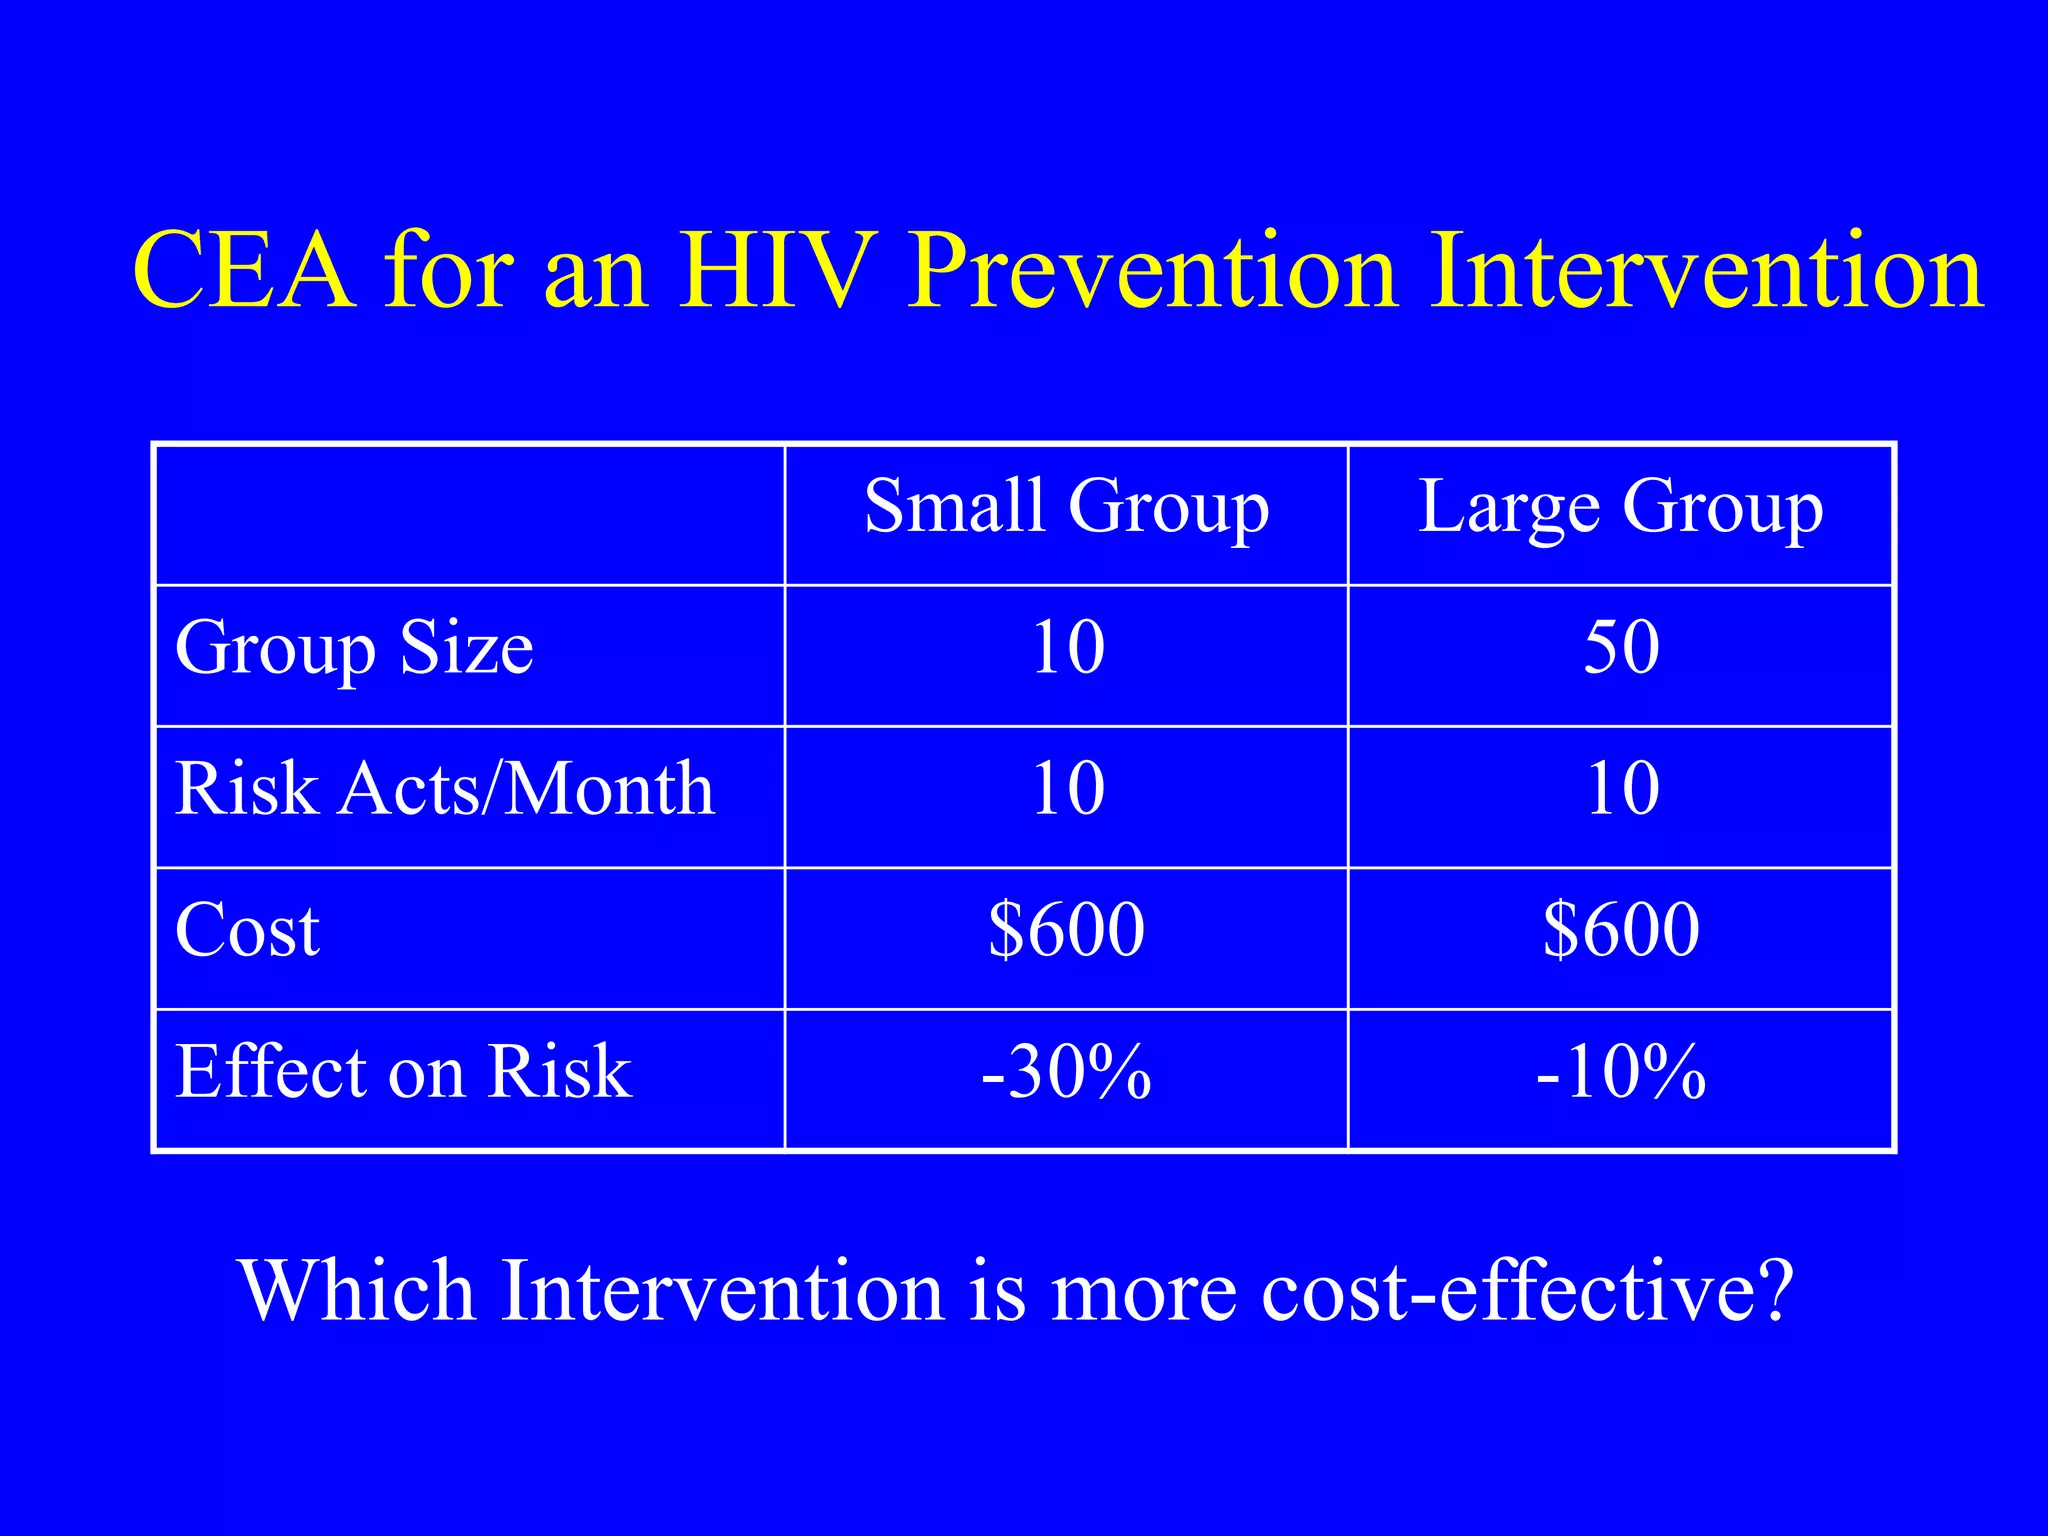
Download to read offline


![Predicting HIV Infection From Data
on Behaviors
a is per act HIV transmission probability
1-a is probability of staying uninfected if one
unprotected sex with HIV+ partner
(1-a)u is monthly probability of no infection
after u unprotected acts over a month, e.g. if
a=.01 and u=4, (1-.01)(1-.01)(1-.01) )(1-.01) =
.96
[1-(1-c)a]p is monthly prob of no infection after p
protected acts with condom efficiency of c](https://image.slidesharecdn.com/2014marleibowitz2-230412235753-33284f39/75/2014_Mar_Leibowitz-2-ppt-12-2048.jpg)


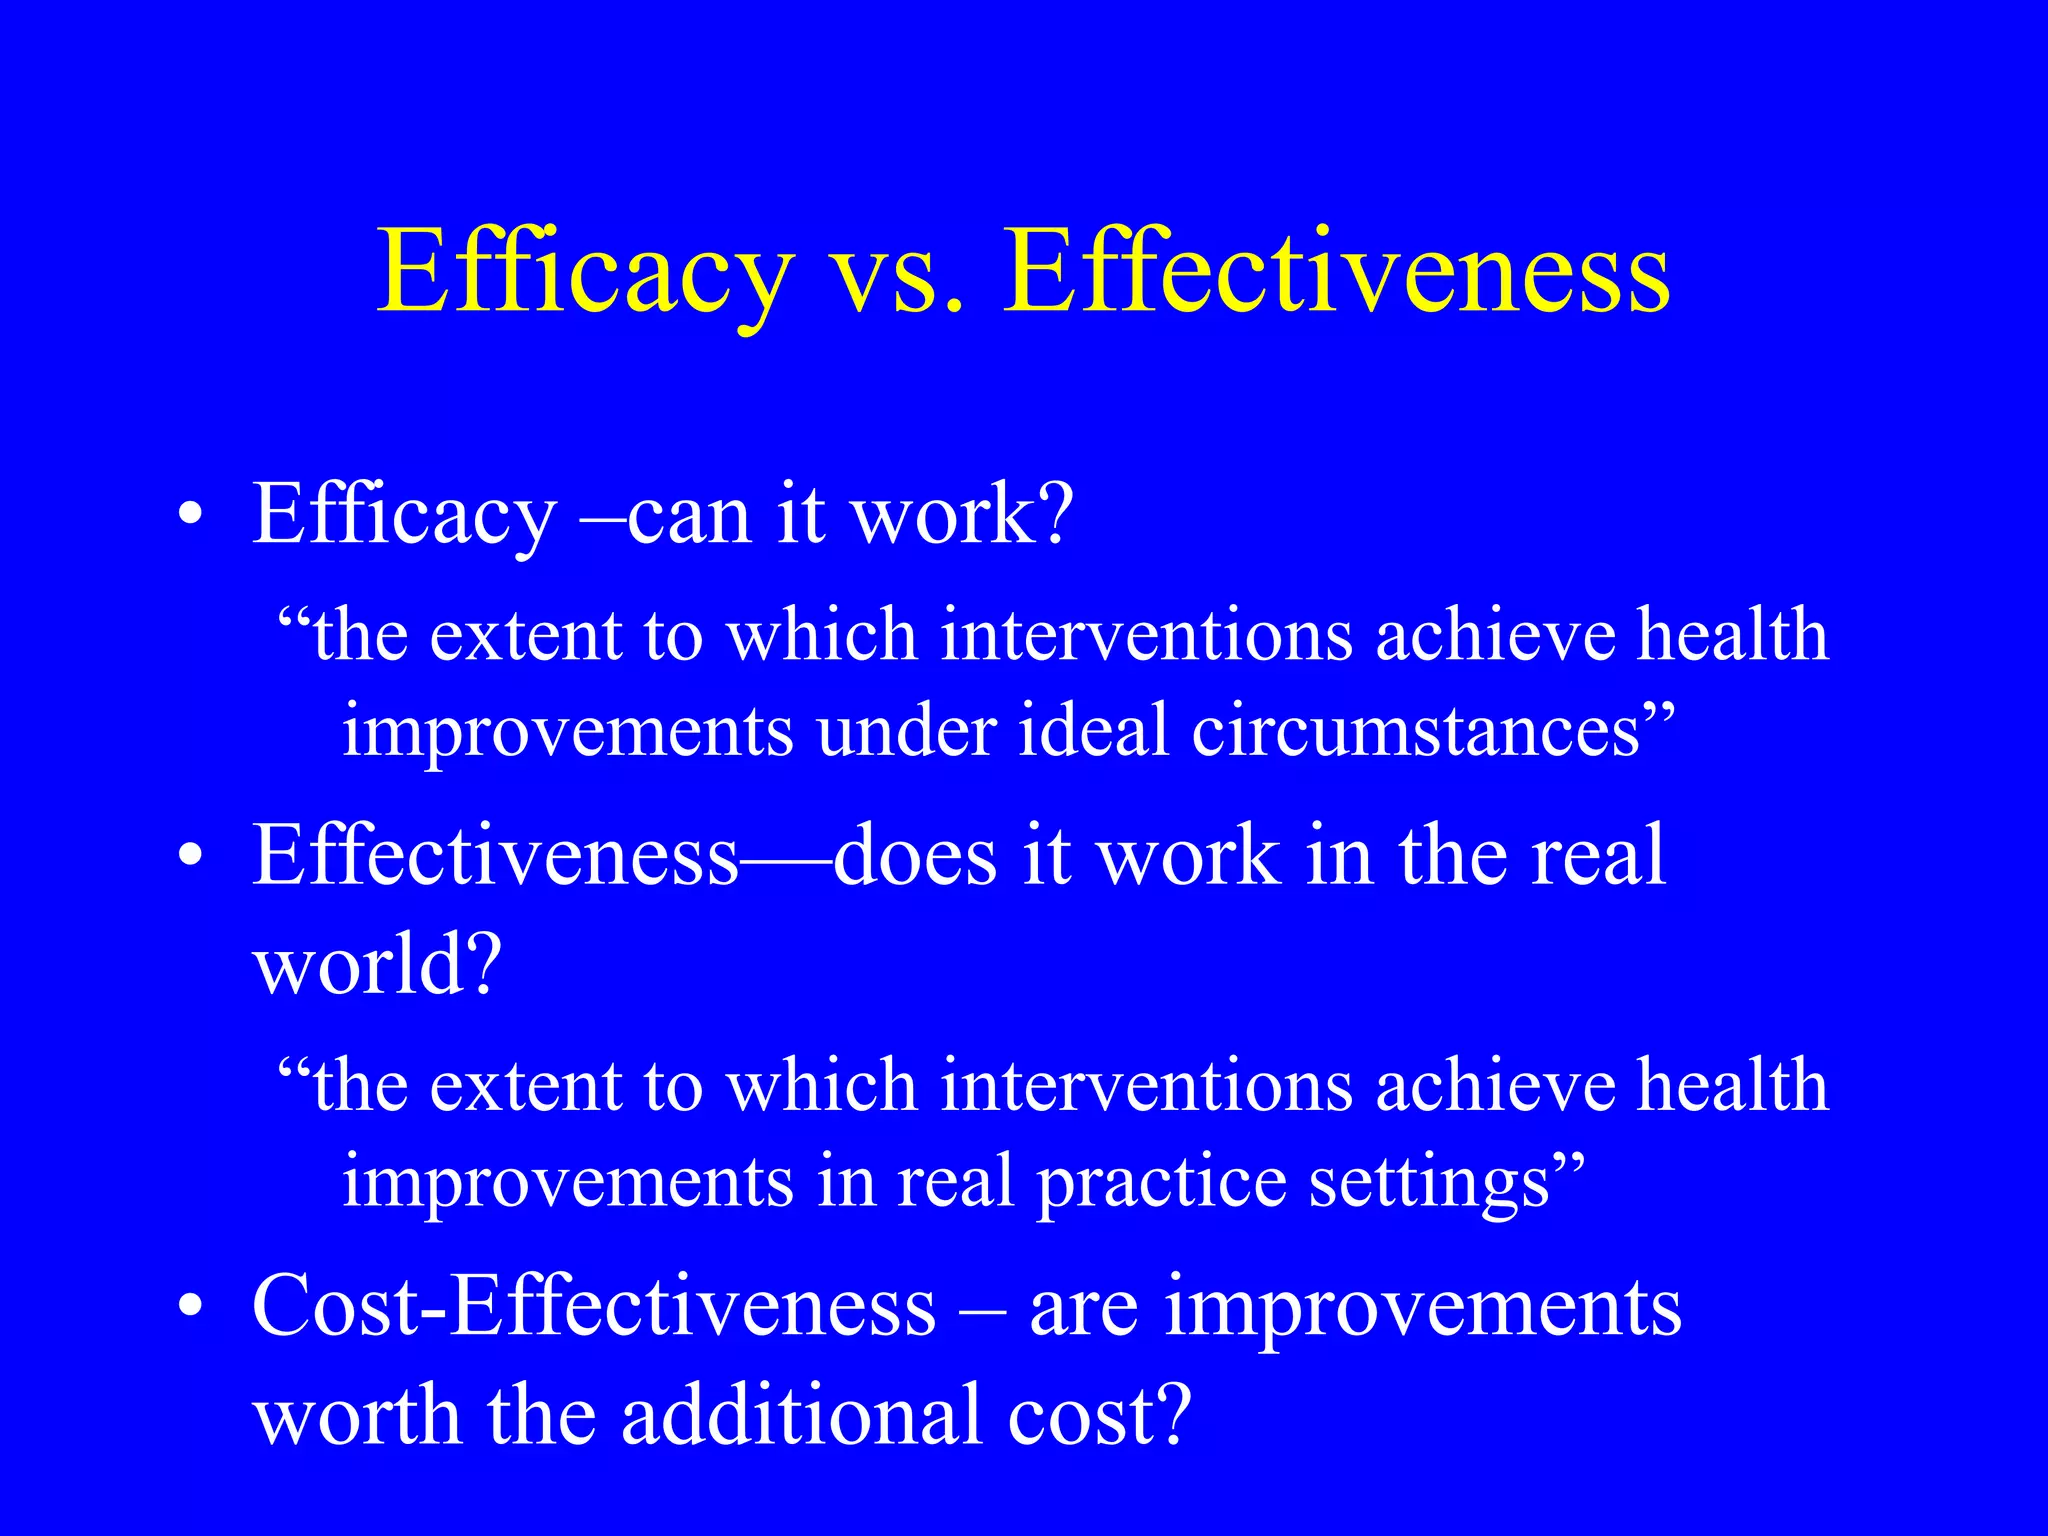
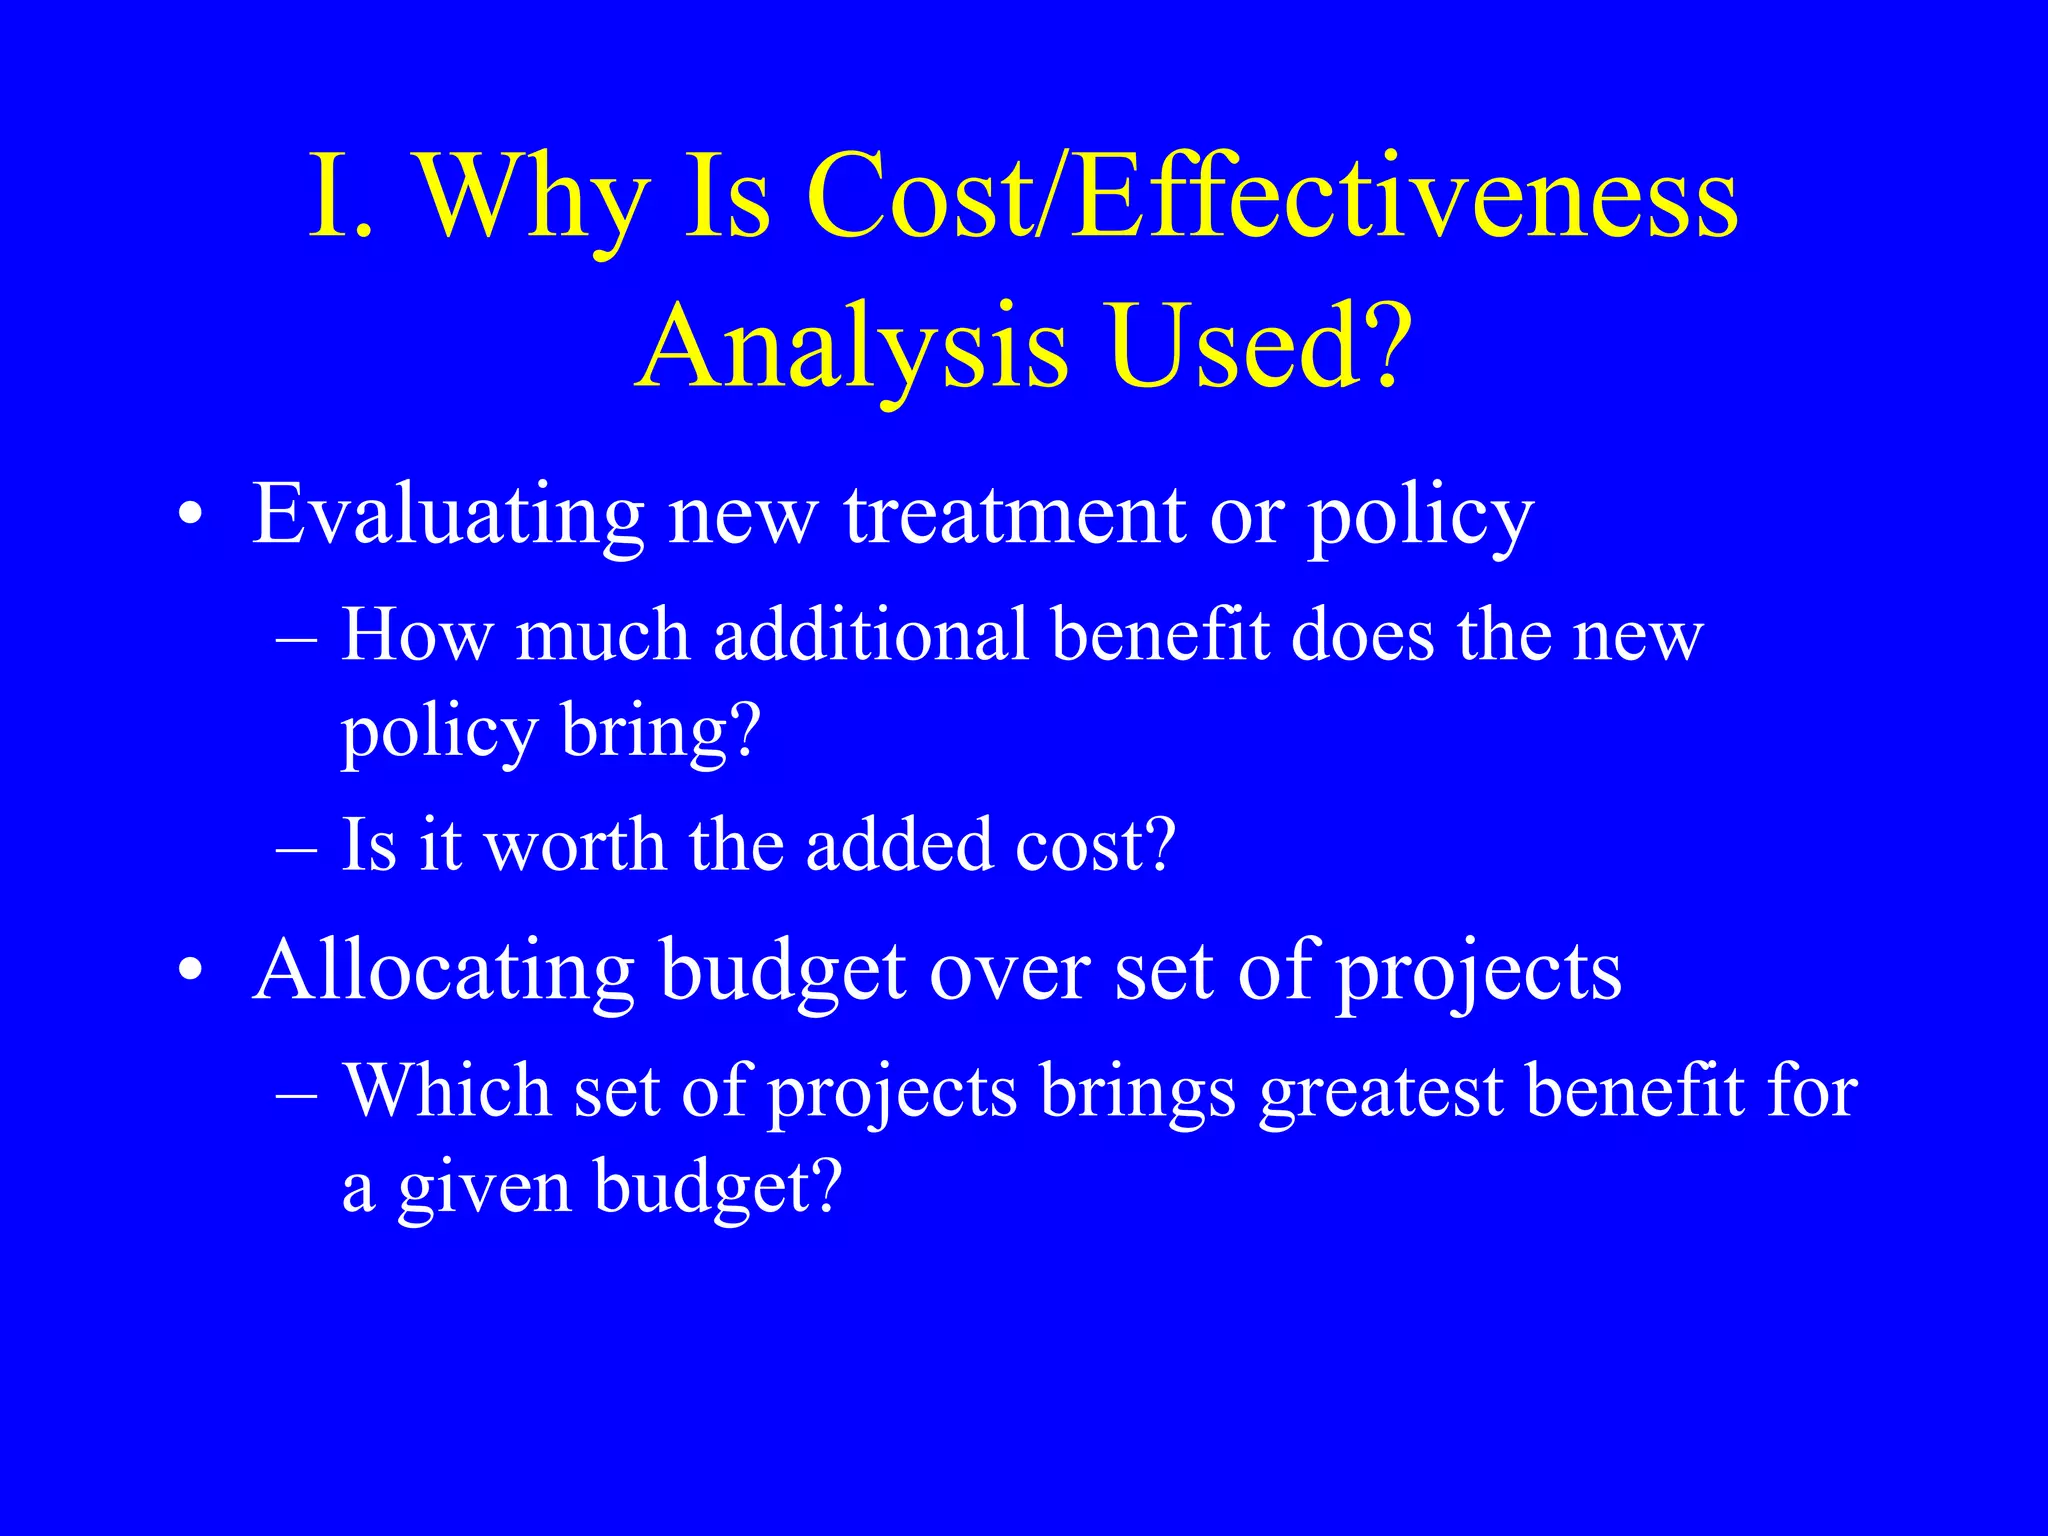
This document discusses cost-effectiveness analysis for evaluating health interventions. It defines efficacy versus effectiveness, and cost-effectiveness as assessing whether health improvements are worth the additional costs. The document outlines methods for cost-effectiveness analysis including identifying alternatives, measuring outcomes and costs, and using decision rules. Key points covered include measuring outcomes directly, considering both short and long term costs and benefits, and discounting future values.