Cost Volume Profit (CVP).
Introduction
Fixed costs
Variable costs
Semi variable costs
Contribution margin
Break even point
PV Ratio
BEP ANalysis.
break even point
Cost-volume-Profit.
Explain the general concept of opportunity cost of capital.
Distinguish between the project cost of capital and the firm’s cost of capital.
Learn about the methods of calculating component cost of capital and the weighted average cost of capital.
Understand the concept and calculation of the marginal cost of capital.
Recognise the need for calculating cost of capital for divisions.
Understand the methodology of determining the divisional beta and divisional cost of capital.
Illustrate the cost of capital calculation for a real company.
One of the most popular questions when it comes to buying a car is 'Kitna deti hai’? (What is the mileage of the car?)
Fuel efficiency of the car is calculated as the distance travelled per unit volume of fuel consumed. During heavy traffic the mileage of your car will be less as compared to empty roads. It all depends on the distance covered per litre of fuel consumed. Therefore, the distance travelled is a major factor defining the fuel efficiency of a car.
Better fuel efficiency would mean higher savings while poor fuel efficiency would mean higher expenses.
Here's a lesson on ‘Earnings Per Share’ that draws a similar analogy to fuel efficiency
the document is on Cost volume profit analysis.
(Cost-volume-profit (CVP) analysis is used to determine how changes in costs and volume affect a company's operating income and net income.)
Presentation on Methods of Determining Cost BehaviorMdRiduan1
In the slide, I discuss about the methods by which we can determine the cost behavior. I have also use some graph and example so that you can understand the topic easily.
Understand the objectives and functions of financial management. Get your concepts clear on what does financial management mean, why is financial management improtant and many more.
Actual Vs Budget Variance PowerPoint Presentation SlidesSlideTeam
This PPT deck displays twentyone slides with in depth research. Our Actual Vs Budget Variance Powerpoint Presentation Slides presentation deck is a helpful tool to plan, prepare, document and analyse the topic with a clear approach. We provide a ready to use deck with all sorts of relevant topics subtopics templates, charts and graphs, overviews, analysis templates. Outline all the important aspects without any hassle. It showcases of all kind of editable templates infographics for an inclusive and comprehensive Actual Vs Budget Variance Powerpoint Presentation Slides presentation. Professionals, managers, individual and team involved in any company organization from any field can use them as per requirement.
Budget Vs Actual Variance Analysis PowerPoint Presentation SlidesSlideTeam
Enhance your audiences knowledge with this well researched complete deck. Showcase all the important features of the deck with perfect visuals. This deck comprises of total of twenty slides with each slide explained in detail. Each template comprises of professional diagrams and layouts. Our professional PowerPoint experts have also included icons, graphs and charts for your convenience. All you have to do is DOWNLOAD the deck. Make changes as per the requirement. Yes, these PPT slides are completely customizable. Edit the colour, text and font size. Add or delete the content from the slide. And leave your audience awestruck with the professionally designed Budget Vs Actual Variance Analysis Powerpoint Presentation Slides complete deck.
Cost Vs Budget PowerPoint Presentation SlidesSlideTeam
This deck consists of total of twenty slides. It has PPT slides highlighting important topics of Cost Vs Budget PowerPoint Presentation Slides. This deck comprises of amazing visuals with thoroughly researched content. Each template is well crafted and designed by our PowerPoint experts. Our designers have included all the necessary PowerPoint layouts in this deck. From icons to graphs, this PPT deck has it all. The best part is that these templates are easily customizable. Just click the DOWNLOAD button shown below. Edit the colour, text, font size, add or delete the content as per the requirement. Download this deck now and engage your audience with this ready made presentation. http://bit.ly/2vMBtbd
This PPT deck displays twentyone slides with in depth research. Our Budget Variance Powerpoint Presentation Slides presentation deck is a helpful tool to plan, prepare, document and analyse the topic with a clear approach. We provide a ready to use deck with all sorts of relevant topics subtopics templates, charts and graphs, overviews, analysis templates. Outline all the important aspects without any hassle. It showcases of all kind of editable templates infographics for an inclusive and comprehensive Budget Variance Powerpoint Presentation Slides presentation. Professionals, managers, individual and team involved in any company organization from any field can use them as per requirement.
Actual Cost Vs Plan Projection PowerPoint Presentation Slides SlideTeam
Are you facing trouble in creating a professional presentation on the concept of actual cost vs plan projection? Do not worry! SlideTeam has come up with the predesigned actual cost vs plan projection PowerPoint presentation slides. Using this actual vs forecast PPT presentation, you can represent an organization future revenue and expenditure. This planning budgeting and forecasting presentation PPT includes a template on relevant sub-topics such as actual cost vs budget, month wise budget forecasting, overhead cost budget analysis, quarterly budget analysis, master budget vs actual variance analysis, actual vs budget analysis, actual vs target variance, budget vs plan vs forecast, forecast vs actual budget, and forecast and project. It also covers a template on budget vs forecast vs. actual. With the assistance of these financial planning PPT slides, you will be able to achieve an organization economic prosperity. Employ this PPT presentation to compare the past and present report to predict the future performance of an organization. Our PowerPoint designers have used visuals and images of charts and graphs so that you can quickly represent the financial statistics of the business. So, do not wait; download this actual vs. forecast PPT presentation. Achieve the correct ambiance with our Actual Cost Vs Plan Projection PowerPoint Presentation Slides. Create the exact atmosphere you desire.
Actual Cost Vs Plan Projection Powerpoint Presentation SlidesSlideTeam
"You can download this product from SlideTeam.net"
Are you facing trouble in creating a professional presentation on the concept of actual cost vs plan projection? Do not worry! SlideTeam has come up with the predesigned actual cost vs plan projection PowerPoint presentation slides. Using this actual vs forecast PPT presentation, you can represent an organization future revenue and expenditure. This planning budgeting and forecasting presentation PPT includes a template on relevant sub-topics such as actual cost vs budget, month wise budget forecasting, overhead cost budget analysis, quarterly budget analysis, master budget vs actual variance analysis, actual vs budget analysis, actual vs target variance, budget vs plan vs forecast, forecast vs actual budget, and forecast and project. It also covers a template on budget vs forecast vs. actual. With the assistance of these financial planning PPT slides, you will be able to achieve an organization economic prosperity. Employ this PPT presentation to compare the past and present report to predict the future performance of an organization. Our PowerPoint designers have used visuals and images of charts and graphs so that you can quickly represent the financial statistics of the business. So, do not wait; download this actual vs. forecast PPT presentation. Achieve the correct ambiance with our Actual Cost Vs Plan Projection Powerpoint Presentation Slides. Create the exact atmosphere you desire. https://bit.ly/3qIdZO5
Business Budgeting PowerPoint Presentation SlidesSlideTeam
This complete deck is oriented to make sure you do not lag in your presentations. Our creatively crafted slides come with apt research and planning. This exclusive deck with twenty slides is here to help you to strategize, plan, analyse, or segment the topic with clear understanding and apprehension. Utilize ready to use presentation slides on Business Budgeting Powerpoint Presentation Slides with all sorts of editable templates, charts and graphs, overviews, analysis templates. It is usable for marking important decisions and covering critical issues. Display and present all possible kinds of underlying nuances, progress factors for an all inclusive presentation for the teams. This presentation deck can be used by all professionals, managers, individuals, internal external teams involved in any company organization.
Forecast Vs Actual Budget Powerpoint Presentation SlidesSlideTeam
"You can download this product from SlideTeam.net"
Are you looking to build a presentation on budgetary controls for your business? Then you must use this forecast vs. actual budget PowerPoint presentations slides. Budgets are the monetary plans of any business which allows to streamline their business expenses for a year or so. Use this budgeting and forecasting PowerPoint layout to describe the features of your forecasted business plan budget and then make a comparison of the same with actual expenses. You can use these budget vs actual percentage PPT slides to highlight the comparison such as department wise, product wise or more. It will allow your business analyst to identify the area which requires more attention from the management. You can also make use of this budget presentation to represent the significance of budget, budgetary control measures, budgets objectives, budgetary guidelines and many more as per your requirement. Simply click on our download button. Guide their actions with our PT&s. Ensure that they continue to do good. https://bit.ly/3HUZEUc
Forecast Vs Actual Budget PowerPoint Presentation Slides SlideTeam
Every organization needs to adapt to the ever-changing business environment. Sensing this need, we have come up with these content-ready change management PowerPoint presentation slides. These change management PPT templates will help you deal with any kind of an organizational change. Be it with people, goals or processes. The business solutions incorporated here will help you identify the organizational structure, create vision for change, implement strategies, identify resistance and risk, manage cost of change, get feedback and evaluation, and much more. With the help of various change management tools and techniques illustrated in this presentation design, you can achieve the desired business outcomes. This business transition PowerPoint design also covers certain related topics such as change model, transformation strategy, change readiness, change control, project management and business process. By implementing the change control methods mentioned in the presentation, you will be able to have a smooth transition in an organization. So, without waiting much, download our extensively researched change management framework presentation. With our Change Management Presentation slides, understand the need for change and plan to go through it without any hassles.
Actual Cost Vs Budget Powerpoint Presentation SlidesSlideTeam
"You can download this product from SlideTeam.net"
Presenting this set of slides with name Actual Cost Vs Budget Powerpoint Presentation Slides. The stages in this process are Actual Cost Vs Budget, Marketing Budget, Plan Vs Forecast. https://bit.ly/3HhsBcS
Actual Cost Vs Budget PowerPoint Presentation Slides SlideTeam
Presenting this set of slides with name - Actual Cost Vs Budget PowerPoint Presentation Slides.The stages in this process are Actual Cost Vs Budget, Marketing Budget, Plan Vs Forecast.
Similar to Cost accounting (Hypothetical problems of labor costing and solution of these problems by using three incentive wage plans) (20)
The Art Pastor's Guide to Sabbath | Steve ThomasonSteve Thomason
What is the purpose of the Sabbath Law in the Torah. It is interesting to compare how the context of the law shifts from Exodus to Deuteronomy. Who gets to rest, and why?
The Roman Empire A Historical Colossus.pdfkaushalkr1407
The Roman Empire, a vast and enduring power, stands as one of history's most remarkable civilizations, leaving an indelible imprint on the world. It emerged from the Roman Republic, transitioning into an imperial powerhouse under the leadership of Augustus Caesar in 27 BCE. This transformation marked the beginning of an era defined by unprecedented territorial expansion, architectural marvels, and profound cultural influence.
The empire's roots lie in the city of Rome, founded, according to legend, by Romulus in 753 BCE. Over centuries, Rome evolved from a small settlement to a formidable republic, characterized by a complex political system with elected officials and checks on power. However, internal strife, class conflicts, and military ambitions paved the way for the end of the Republic. Julius Caesar’s dictatorship and subsequent assassination in 44 BCE created a power vacuum, leading to a civil war. Octavian, later Augustus, emerged victorious, heralding the Roman Empire’s birth.
Under Augustus, the empire experienced the Pax Romana, a 200-year period of relative peace and stability. Augustus reformed the military, established efficient administrative systems, and initiated grand construction projects. The empire's borders expanded, encompassing territories from Britain to Egypt and from Spain to the Euphrates. Roman legions, renowned for their discipline and engineering prowess, secured and maintained these vast territories, building roads, fortifications, and cities that facilitated control and integration.
The Roman Empire’s society was hierarchical, with a rigid class system. At the top were the patricians, wealthy elites who held significant political power. Below them were the plebeians, free citizens with limited political influence, and the vast numbers of slaves who formed the backbone of the economy. The family unit was central, governed by the paterfamilias, the male head who held absolute authority.
Culturally, the Romans were eclectic, absorbing and adapting elements from the civilizations they encountered, particularly the Greeks. Roman art, literature, and philosophy reflected this synthesis, creating a rich cultural tapestry. Latin, the Roman language, became the lingua franca of the Western world, influencing numerous modern languages.
Roman architecture and engineering achievements were monumental. They perfected the arch, vault, and dome, constructing enduring structures like the Colosseum, Pantheon, and aqueducts. These engineering marvels not only showcased Roman ingenuity but also served practical purposes, from public entertainment to water supply.
Instructions for Submissions thorugh G- Classroom.pptxJheel Barad
This presentation provides a briefing on how to upload submissions and documents in Google Classroom. It was prepared as part of an orientation for new Sainik School in-service teacher trainees. As a training officer, my goal is to ensure that you are comfortable and proficient with this essential tool for managing assignments and fostering student engagement.
How to Make a Field invisible in Odoo 17Celine George
It is possible to hide or invisible some fields in odoo. Commonly using “invisible” attribute in the field definition to invisible the fields. This slide will show how to make a field invisible in odoo 17.
Unit 8 - Information and Communication Technology (Paper I).pdfThiyagu K
This slides describes the basic concepts of ICT, basics of Email, Emerging Technology and Digital Initiatives in Education. This presentations aligns with the UGC Paper I syllabus.
This is a presentation by Dada Robert in a Your Skill Boost masterclass organised by the Excellence Foundation for South Sudan (EFSS) on Saturday, the 25th and Sunday, the 26th of May 2024.
He discussed the concept of quality improvement, emphasizing its applicability to various aspects of life, including personal, project, and program improvements. He defined quality as doing the right thing at the right time in the right way to achieve the best possible results and discussed the concept of the "gap" between what we know and what we do, and how this gap represents the areas we need to improve. He explained the scientific approach to quality improvement, which involves systematic performance analysis, testing and learning, and implementing change ideas. He also highlighted the importance of client focus and a team approach to quality improvement.
Welcome to TechSoup New Member Orientation and Q&A (May 2024).pdfTechSoup
In this webinar you will learn how your organization can access TechSoup's wide variety of product discount and donation programs. From hardware to software, we'll give you a tour of the tools available to help your nonprofit with productivity, collaboration, financial management, donor tracking, security, and more.
How to Create Map Views in the Odoo 17 ERPCeline George
The map views are useful for providing a geographical representation of data. They allow users to visualize and analyze the data in a more intuitive manner.
Students, digital devices and success - Andreas Schleicher - 27 May 2024..pptxEduSkills OECD
Andreas Schleicher presents at the OECD webinar ‘Digital devices in schools: detrimental distraction or secret to success?’ on 27 May 2024. The presentation was based on findings from PISA 2022 results and the webinar helped launch the PISA in Focus ‘Managing screen time: How to protect and equip students against distraction’ https://www.oecd-ilibrary.org/education/managing-screen-time_7c225af4-en and the OECD Education Policy Perspective ‘Students, digital devices and success’ can be found here - https://oe.cd/il/5yV
Palestine last event orientationfvgnh .pptxRaedMohamed3
An EFL lesson about the current events in Palestine. It is intended to be for intermediate students who wish to increase their listening skills through a short lesson in power point.
Cost accounting (Hypothetical problems of labor costing and solution of these problems by using three incentive wage plans)
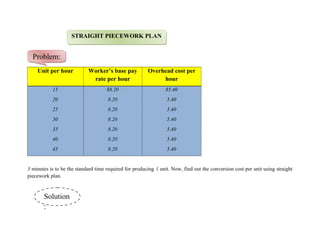
1. Unit per hour Worker’s base pay
rate per hour
Overhead cost per
hour
15 $8.20 $5.40
20 8.20 5.40
25 8.20 5.40
30 8.20 5.40
35 8.20 5.40
40 8.20 5.40
45 8.20 5.40
3 minutes is to be the standard time required for producing 1 unit. Now, find out the conversion cost per unit using straight
piecework plan.
STRAIGHT PIECEWORK PLANSTRAIGHT PIECEWORK PLAN
Problem:Problem:
Solution
:
3. i. Standard Production in One Hour:
3 minutes = 1 units
1 minutes = 1/3 units
60 minutes = 60/3 units
= 20 pieces per hour
So, Standard Piece Rate = Base Rate ÷ Piece P/H
= 8.2÷20
= 0.41
ii. Labor Cost P/U = Earned P/H ÷ Unit P/H
iii. Overhead P/U = Overhead P/H ÷ Unit P/H
iv. Conversion Cost P/U = Labor Cost P/U + Overhead P/U
Workings:Workings:
4. Mr. Jamal Uddin, employed by the Bata Company, submitted the following labor data:
Workers Hours worked Output units Base rate
Shamim 60 700 $8.00
Samad 40 500 7.30
Gomes 56 700 8.20
Hridoy 60 690 7.60
Rimon 45 400 7.00
Shipon 58 650 8.50
100% BONUS PLAN100% BONUS PLAN
Problem:Problem:
5. He also submitted that their standard production is 11 units per hour; overhead cost is $6.8 per hour, 8- hours’ shift. Now,
find out the conversion cost per unit using 100% bonus plan.
Workers Hours
Worked
Output
Units
Standard
Units
Efficiency
Ratio
Base
Rate
Effective
Hourly
Rate
Total
Earned
Labor
Cost
P/U
Overhead
P/H
Overhead
P/U
Conversion
Cost P/U
Shamim 60 700 660 1.06 $8.0
0
8.480 508.800 0.727 $6.8 0.583 1.310
Samad 40 500 440 1.14 7.30 8.322 332.880 0.666 6.8 0.544 1.210
Gomes 56 700 616 1.14 8.20 9.348 523.488 0.748 6.8 0.544 1.292
Hridoy 60 690 660 1.05 7.60 7.980 478.800 0.694 6.8 0.591 1.285
Rimon 45 400 495 0.81 7.00 _ 315.000 0.788 6.8 0.765 1.553
Shipon 58 650 638 1.02 8.50 8.670 502.860 0.774 6.8 0.607 1.381
Solution
:
6. i. Standard Units = Standard Production × Hours Worked
ii. Efficiency Ratio = Actual Output ÷ Standard Output
iii. Effective Hourly Rate = Base Rate × Efficiency Ratio
*When the efficiency ratio is less than 1.00 no bonus is earned
iv. Total Earned = Effective Hourly Rate × Hours Worked
v. Labor Cost P/U = Total Earned ÷ Output Units
vi. Overhead P/U = Overhead P/H × Hours Worked ÷ Output Units
vii. Conversion Cost P/U = Labor cost P/U + Overhead P/U
Workings:Workings:
7. Employees of G&G work in groups of 11, plus a group leader and each is paid $15 an hour for a regular 8- hours shift.
Standard production is 80 units per hour or 640 units per shift. Overhead is $480 per 8- hour shift or $60 per hour.
The production record of a group shows:
Unit produced
680
700
880
620
660
960
Now, find out the conversion cost per unit using group bonus plan.
GROUP BONUS PLANGROUP BONUS PLAN
Problem:Problem:
8. Unit
produced
Standard Hours
for Units
Produced
Actual
Hours
Regular
Group
Wage
Bonus
(hours
saved @ 15)
Total
Group
Earnings
Labor
Cost P/U
Overhead
P/U
Conversion
Cost P/U
680 (680÷80×12)=102 96 $1440 90 1530 2.25 0.706 2.956
700 (700÷80×12)=105 96 1440 135 1575 2.25 0.686 2.936
880 (880÷80×12)=132 96 1440 540 1980 2.25 0.545 2.795
620 (620÷80×12)=93 96 1440 0 1440 2.32 0.774 3.094
660 (660÷80×12)=99 96 1440 45 1485 2.25 0.727 2.977
960 (960÷80×12)=144 96 1440 720 2160 2.25 0.500 2.750
Solution
:
9. i. Standard Hours for Units Produced:
80 units = 1 hours
1 units = 1/80 hours
680 units = 680/80 hours
= 8.5 hours × 12 workers
= 102 hours
ii. Actual Hours = Number of Workers × Shifted Hours
iii. Regular Group Wage = Shifted Hours × Number of workers × Wage
iv. Bonus = (Standard Hours for Units Produced – Actual Hours) × Wage
v. Labor Cost P/U = Total Group Earnings ÷ Unit Produced
vi. Overhead P/U = Overhead P/S ÷ Unit Produced
vii. Conversion Cost P/U = Labor Cost P/U + Overhead P/U
Workings:Workings:
10. i. Standard Hours for Units Produced:
80 units = 1 hours
1 units = 1/80 hours
680 units = 680/80 hours
= 8.5 hours × 12 workers
= 102 hours
ii. Actual Hours = Number of Workers × Shifted Hours
iii. Regular Group Wage = Shifted Hours × Number of workers × Wage
iv. Bonus = (Standard Hours for Units Produced – Actual Hours) × Wage
v. Labor Cost P/U = Total Group Earnings ÷ Unit Produced
vi. Overhead P/U = Overhead P/S ÷ Unit Produced
vii. Conversion Cost P/U = Labor Cost P/U + Overhead P/U
Workings:Workings: