1. The document provides information on cost allocation for an engineering company across different departments.
2. Equations are set up to calculate the costs of Stores and Maintenance departments, with Stores costs calculated to be Rs. 1,045 and Maintenance costs calculated to be Rs. 905.
3. Overhead rates are then calculated for different departments based on the cost allocations to Machining, Assembly and Finishing departments.
Actual Cost Vs Plan Projection Powerpoint Presentation SlidesSlideTeam
"You can download this product from SlideTeam.net"
Are you facing trouble in creating a professional presentation on the concept of actual cost vs plan projection? Do not worry! SlideTeam has come up with the predesigned actual cost vs plan projection PowerPoint presentation slides. Using this actual vs forecast PPT presentation, you can represent an organization future revenue and expenditure. This planning budgeting and forecasting presentation PPT includes a template on relevant sub-topics such as actual cost vs budget, month wise budget forecasting, overhead cost budget analysis, quarterly budget analysis, master budget vs actual variance analysis, actual vs budget analysis, actual vs target variance, budget vs plan vs forecast, forecast vs actual budget, and forecast and project. It also covers a template on budget vs forecast vs. actual. With the assistance of these financial planning PPT slides, you will be able to achieve an organization economic prosperity. Employ this PPT presentation to compare the past and present report to predict the future performance of an organization. Our PowerPoint designers have used visuals and images of charts and graphs so that you can quickly represent the financial statistics of the business. So, do not wait; download this actual vs. forecast PPT presentation. Achieve the correct ambiance with our Actual Cost Vs Plan Projection Powerpoint Presentation Slides. Create the exact atmosphere you desire. https://bit.ly/3qIdZO5
Process costing explained with examples free of cost .It is for students of managerial accounting ,read this to quickly go through process costing.
http://www.brightscholarships.com
Twitter @scholarshipskys
Actual Cost Vs Plan Projection PowerPoint Presentation Slides SlideTeam
Are you facing trouble in creating a professional presentation on the concept of actual cost vs plan projection? Do not worry! SlideTeam has come up with the predesigned actual cost vs plan projection PowerPoint presentation slides. Using this actual vs forecast PPT presentation, you can represent an organization future revenue and expenditure. This planning budgeting and forecasting presentation PPT includes a template on relevant sub-topics such as actual cost vs budget, month wise budget forecasting, overhead cost budget analysis, quarterly budget analysis, master budget vs actual variance analysis, actual vs budget analysis, actual vs target variance, budget vs plan vs forecast, forecast vs actual budget, and forecast and project. It also covers a template on budget vs forecast vs. actual. With the assistance of these financial planning PPT slides, you will be able to achieve an organization economic prosperity. Employ this PPT presentation to compare the past and present report to predict the future performance of an organization. Our PowerPoint designers have used visuals and images of charts and graphs so that you can quickly represent the financial statistics of the business. So, do not wait; download this actual vs. forecast PPT presentation. Achieve the correct ambiance with our Actual Cost Vs Plan Projection PowerPoint Presentation Slides. Create the exact atmosphere you desire.
Actual Cost Vs Budget PowerPoint Presentation Slides SlideTeam
Presenting this set of slides with name - Actual Cost Vs Budget PowerPoint Presentation Slides.The stages in this process are Actual Cost Vs Budget, Marketing Budget, Plan Vs Forecast.
Budget Vs Actual Variance Analysis PowerPoint Presentation SlidesSlideTeam
Enhance your audiences knowledge with this well researched complete deck. Showcase all the important features of the deck with perfect visuals. This deck comprises of total of twenty slides with each slide explained in detail. Each template comprises of professional diagrams and layouts. Our professional PowerPoint experts have also included icons, graphs and charts for your convenience. All you have to do is DOWNLOAD the deck. Make changes as per the requirement. Yes, these PPT slides are completely customizable. Edit the colour, text and font size. Add or delete the content from the slide. And leave your audience awestruck with the professionally designed Budget Vs Actual Variance Analysis Powerpoint Presentation Slides complete deck.
Actual Vs Budget Variance PowerPoint Presentation SlidesSlideTeam
This PPT deck displays twentyone slides with in depth research. Our Actual Vs Budget Variance Powerpoint Presentation Slides presentation deck is a helpful tool to plan, prepare, document and analyse the topic with a clear approach. We provide a ready to use deck with all sorts of relevant topics subtopics templates, charts and graphs, overviews, analysis templates. Outline all the important aspects without any hassle. It showcases of all kind of editable templates infographics for an inclusive and comprehensive Actual Vs Budget Variance Powerpoint Presentation Slides presentation. Professionals, managers, individual and team involved in any company organization from any field can use them as per requirement.
The overhead cost chapter in a business or accounting context typically deals with expenses that are incurred in the operation of a business but cannot be directly attributed to specific products or services.
Forecast Vs Actual Budget PowerPoint Presentation Slides SlideTeam
Every organization needs to adapt to the ever-changing business environment. Sensing this need, we have come up with these content-ready change management PowerPoint presentation slides. These change management PPT templates will help you deal with any kind of an organizational change. Be it with people, goals or processes. The business solutions incorporated here will help you identify the organizational structure, create vision for change, implement strategies, identify resistance and risk, manage cost of change, get feedback and evaluation, and much more. With the help of various change management tools and techniques illustrated in this presentation design, you can achieve the desired business outcomes. This business transition PowerPoint design also covers certain related topics such as change model, transformation strategy, change readiness, change control, project management and business process. By implementing the change control methods mentioned in the presentation, you will be able to have a smooth transition in an organization. So, without waiting much, download our extensively researched change management framework presentation. With our Change Management Presentation slides, understand the need for change and plan to go through it without any hassles.
This PPT deck displays twentyone slides with in depth research. Our Budget Variance Powerpoint Presentation Slides presentation deck is a helpful tool to plan, prepare, document and analyse the topic with a clear approach. We provide a ready to use deck with all sorts of relevant topics subtopics templates, charts and graphs, overviews, analysis templates. Outline all the important aspects without any hassle. It showcases of all kind of editable templates infographics for an inclusive and comprehensive Budget Variance Powerpoint Presentation Slides presentation. Professionals, managers, individual and team involved in any company organization from any field can use them as per requirement.
Discover the innovative and creative projects that highlight my journey throu...dylandmeas
Discover the innovative and creative projects that highlight my journey through Full Sail University. Below, you’ll find a collection of my work showcasing my skills and expertise in digital marketing, event planning, and media production.
Improving profitability for small businessBen Wann
In this comprehensive presentation, we will explore strategies and practical tips for enhancing profitability in small businesses. Tailored to meet the unique challenges faced by small enterprises, this session covers various aspects that directly impact the bottom line. Attendees will learn how to optimize operational efficiency, manage expenses, and increase revenue through innovative marketing and customer engagement techniques.
Putting the SPARK into Virtual Training.pptxCynthia Clay
This 60-minute webinar, sponsored by Adobe, was delivered for the Training Mag Network. It explored the five elements of SPARK: Storytelling, Purpose, Action, Relationships, and Kudos. Knowing how to tell a well-structured story is key to building long-term memory. Stating a clear purpose that doesn't take away from the discovery learning process is critical. Ensuring that people move from theory to practical application is imperative. Creating strong social learning is the key to commitment and engagement. Validating and affirming participants' comments is the way to create a positive learning environment.
What is the TDS Return Filing Due Date for FY 2024-25.pdfseoforlegalpillers
It is crucial for the taxpayers to understand about the TDS Return Filing Due Date, so that they can fulfill your TDS obligations efficiently. Taxpayers can avoid penalties by sticking to the deadlines and by accurate filing of TDS. Timely filing of TDS will make sure about the availability of tax credits. You can also seek the professional guidance of experts like Legal Pillers for timely filing of the TDS Return.
Kseniya Leshchenko: Shared development support service model as the way to ma...Lviv Startup Club
Kseniya Leshchenko: Shared development support service model as the way to make small projects with small budgets profitable for the company (UA)
Kyiv PMDay 2024 Summer
Website – www.pmday.org
Youtube – https://www.youtube.com/startuplviv
FB – https://www.facebook.com/pmdayconference
LA HUG - Video Testimonials with Chynna Morgan - June 2024Lital Barkan
Have you ever heard that user-generated content or video testimonials can take your brand to the next level? We will explore how you can effectively use video testimonials to leverage and boost your sales, content strategy, and increase your CRM data.🤯
We will dig deeper into:
1. How to capture video testimonials that convert from your audience 🎥
2. How to leverage your testimonials to boost your sales 💲
3. How you can capture more CRM data to understand your audience better through video testimonials. 📊
Digital Transformation and IT Strategy Toolkit and TemplatesAurelien Domont, MBA
This Digital Transformation and IT Strategy Toolkit was created by ex-McKinsey, Deloitte and BCG Management Consultants, after more than 5,000 hours of work. It is considered the world's best & most comprehensive Digital Transformation and IT Strategy Toolkit. It includes all the Frameworks, Best Practices & Templates required to successfully undertake the Digital Transformation of your organization and define a robust IT Strategy.
Editable Toolkit to help you reuse our content: 700 Powerpoint slides | 35 Excel sheets | 84 minutes of Video training
This PowerPoint presentation is only a small preview of our Toolkits. For more details, visit www.domontconsulting.com
Implicitly or explicitly all competing businesses employ a strategy to select a mix
of marketing resources. Formulating such competitive strategies fundamentally
involves recognizing relationships between elements of the marketing mix (e.g.,
price and product quality), as well as assessing competitive and market conditions
(i.e., industry structure in the language of economics).
[Note: This is a partial preview. To download this presentation, visit:
https://www.oeconsulting.com.sg/training-presentations]
Sustainability has become an increasingly critical topic as the world recognizes the need to protect our planet and its resources for future generations. Sustainability means meeting our current needs without compromising the ability of future generations to meet theirs. It involves long-term planning and consideration of the consequences of our actions. The goal is to create strategies that ensure the long-term viability of People, Planet, and Profit.
Leading companies such as Nike, Toyota, and Siemens are prioritizing sustainable innovation in their business models, setting an example for others to follow. In this Sustainability training presentation, you will learn key concepts, principles, and practices of sustainability applicable across industries. This training aims to create awareness and educate employees, senior executives, consultants, and other key stakeholders, including investors, policymakers, and supply chain partners, on the importance and implementation of sustainability.
LEARNING OBJECTIVES
1. Develop a comprehensive understanding of the fundamental principles and concepts that form the foundation of sustainability within corporate environments.
2. Explore the sustainability implementation model, focusing on effective measures and reporting strategies to track and communicate sustainability efforts.
3. Identify and define best practices and critical success factors essential for achieving sustainability goals within organizations.
CONTENTS
1. Introduction and Key Concepts of Sustainability
2. Principles and Practices of Sustainability
3. Measures and Reporting in Sustainability
4. Sustainability Implementation & Best Practices
To download the complete presentation, visit: https://www.oeconsulting.com.sg/training-presentations
Skye Residences | Extended Stay Residences Near Toronto Airportmarketingjdass
Experience unparalleled EXTENDED STAY and comfort at Skye Residences located just minutes from Toronto Airport. Discover sophisticated accommodations tailored for discerning travelers.
Website Link :
https://skyeresidences.com/
https://skyeresidences.com/about-us/
https://skyeresidences.com/gallery/
https://skyeresidences.com/rooms/
https://skyeresidences.com/near-by-attractions/
https://skyeresidences.com/commute/
https://skyeresidences.com/contact/
https://skyeresidences.com/queen-suite-with-sofa-bed/
https://skyeresidences.com/queen-suite-with-sofa-bed-and-balcony/
https://skyeresidences.com/queen-suite-with-sofa-bed-accessible/
https://skyeresidences.com/2-bedroom-deluxe-queen-suite-with-sofa-bed/
https://skyeresidences.com/2-bedroom-deluxe-king-queen-suite-with-sofa-bed/
https://skyeresidences.com/2-bedroom-deluxe-queen-suite-with-sofa-bed-accessible/
#Skye Residences Etobicoke, #Skye Residences Near Toronto Airport, #Skye Residences Toronto, #Skye Hotel Toronto, #Skye Hotel Near Toronto Airport, #Hotel Near Toronto Airport, #Near Toronto Airport Accommodation, #Suites Near Toronto Airport, #Etobicoke Suites Near Airport, #Hotel Near Toronto Pearson International Airport, #Toronto Airport Suite Rentals, #Pearson Airport Hotel Suites
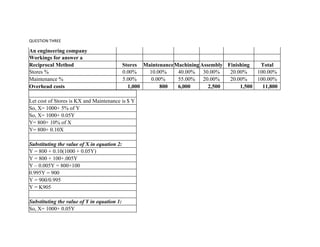
1. QUESTION THREE
An engineering company
Workings for answer a
Reciprocal Method Stores MaintenanceMachining Assembly Finishing Total
Stores % 0.00% 10.00% 40.00% 30.00% 20.00% 100.00%
Maintenance % 5.00% 0.00% 55.00% 20.00% 20.00% 100.00%
Overhead costs 1,000 800 6,000 2,500 1,500 11,800
Let cost of Stores is KX and Maintenance is $ Y
So, X= 1000+ 5% of Y
So, X= 1000+ 0.05Y
Y= 800+ 10% of X
Y= 800+ 0.10X
Substituting the value of X in equation 2:
Y = 800 + 0.10(1000 + 0.05Y)
Y = 800 + 100+.005Y
Y – 0.005Y = 800+100
0.995Y = 900
Y = 900/0.995
Y = K905
Substituting the value of Y in equation 1:
So, X= 1000+ 0.05Y
2. So, X= 1000+ 0.05*905
So, X= 1000+ 45
X= K1,045
Allocation Summary Stores Maintenance Machining Assembly Finishing Total
Stores % 0.00% 10.00% 40.00% 30.00% 20.00% 100.00%
Maintenance % 5.00% 0.00% 55.00% 20.00% 20.00% 100.00%
Department cost 1,000 800 6,000 2,500 1,500 11,800
Total costs
Stores (1,045) 105 418 313.5 209 0.50
Maintenance 45 (905) 497.75 181 181 (0.25)
Cost after allocation - - 6,915 2,995 1,890 11,800
Answer a Machining Note
Machine Hours 50,000 A
Overhead cost 6,915 B
Overhead absorption rates 0.14 C=B/A
Answer a Assembly Finishing Note
Labor Hours 30,000 20,000 D
Overhead cost 2,995 1,890 E
Overhead absorption rates 0.10 0.09 F=E/D
Bid for Job K
Answer b Machining Assembly Finishing Total Note
Machine/ Labor hour used 45.00 15.00 12.00 G
3. Departmental predetermined OH Rate 0.14 0.10 0.09 H= See C, F
Overhead applied to Job K ('000) 6.22 1.50 1.13 8,855 I=G*H
Direct materials 24,000
Direct Labor 15,000
Total cost of Job K 47,855 J
Profit 11,963.75 K=J/80%*20%
Sell price 59,818.75 L=J+K
QUESTION FOUR
(a) Percentage of direct labour cost method = (K600 000 / K200 000) x 100
= 300% of direct labour cost
Direct labour hour method = (K600 000/40 000 direct labour hours)
= K15 per direct labour hour
Machine hour method = (K600 000/50 000 machine hour)
= K12 per machine hour
(B) The question states that the company has become machine-intensive and implies that in the long term there is a
closer association between overhead expenditure and machine hours than the other two methods. Therefore the best
measure of overhead resources consumed by jobs or products is machine hours.
4. (C) Job Ax (K)
Direct material 3788
Direct labour 1100
Direct expenses 422
Prime cost 5310
Production overhead (120 machine hours K12) 1440
Factory cost 6750
Administrative overheads (20% K6750) 1350
Total cost 8100
Profit (K8100/0.90 K8100) 900
Selling price 9000
Workings
Administration overhead absorption rate = Total admin. Overheads/total factory cost
= K328 000 / K1 640 000
= 20% of factory cost
5. QUESTION FIVE
Step 1
Process costing is a method of costing whereby products go through various manufacturing levels and individual costs need to be
calculated. Here, it is assumed that every process is an independent unit, and the output of one is considered as input for another.
Step 2
Primary process A/c
Particulars Units Cost Particulars Unit Cost
Direct material 65,000 39,000 Normal loss 6,500
Labour 5,730 Abnormal loss 3,500 2,870
Overheads 3,240 Secondary process 55,000 45,100
47,970 47,970
Cost per unit of Primary process = Total cost/ Normal Units
= 47,970/(65,000-6,500)
=47,970/58,500
=K0.82
Secondary process A/c
Particulars Units Cost Particulars Unit Cost
Primary Process A/c 55,000 45,100 Normal loss 2,750
Direct material 6,300
Labour 7,200
Overheads 4,100 Secondary process 53,000 63,600
Abnormal Gain 750 900
55,750 63,600 55,750 63,600
Cost per unit of Secondary process = Total cost/ Normal Units
= 62,700/(55,000-2,750)
=62,700/52,250
=K1.2
6. Finishing process A/c
Particulars Units Cost Particulars Unit Cost
Secondary Process A/c 53,000 63,600 Normal loss 2,650 3312
Labour 8,280 Abnormal loss 2,350 3,432
Overheads 5,160 Secondary process 48,000 70,296
53,000 77,040 53,000 77,040
Cost per unit of Finishing process = Total cost/ Normal Units
= (77,040-3312.5)/(55,750-2,650)
=73,727/50,350
=1.46 K
Part
Abnormal loss A/c
Particulars Units Cost Particulars Unit Cost
Primary process 3,500 2,870
By Costing P&L
costing
5,850 6,302
Finishing process 2,350 3,432
6,302 6,302
Abnormal gain A/c
Particulars Units Cost Particulars Unit Cost
To normal loss 750 900
By Secondary
process
750 900
900 900
QUESTION SIX
9. QUESTION NINE
a) Gross Wages to direct workers in the month
Basic wages - Total Attendeance - 2640 Hrs
Rate Per Hour K5,000 (Per Hour)
Basic Wages - K 13,200,000
Group Bonuses - K 2,840,000
Emplyer's Pension Contribution - K 1,460,000
Overtime Wages (Extra 40% for 180 Hrs) - K 360,000 ( K5000 * 40% * 180 Hrs) (Extra)
Gross Wages (Total) - K 17,860,000
b)
Cost Accounting Entry in Comapny Cost records
Entry No. 1
Basic Wages - Direct Workers K 13,200,000 Dr.
Group Bonuses - Direct Workers - K 2,840,000 Dr.
Emplyer's Pension Contribution - Direct workers K 1,460,000 Dr.
10. Overtime Wages - Direct Workers - K 360,000 Dr.
Basic Wages - Indirect Workers - K 3,760,000 Dr
Group Bonuses - Indirect Workers - K 710,000 Dr
Emplyer's Pension Contribution - Indirect Workers K 405,000 Dr
Overtime Wages - Indirect Workers - - K 120,000 Dr
To
Direct Workers wages Payable Account K 17,860,000 Cr.
Indirect Workers Wages Payable Account K 4,995,000 Cr.
(Being Amount Payable to Direct & Indirect Workers for the Month of Sept, 2020)
Entry No. 2
Machine Break-down Cost Overheads K 563,447 Dr.
Waiting Time Unproductive Cost Overheads K 267,151 Dr
To
Basic Wages - Direct Workers K 625,000 Cr. (K 425,000 + K 200,000)
Group Bonuses - Direct Workers - K 136,469 Cr. (K 91439 + K 45,030)
11. Emplyer's Pension Contribution - Direct workers K 69.129 Cr. (K 47,008 + K 22,121)
(Being Cost of Unproductive Factory Overheads transferred for Allocations)
Entry No. 3
Overhead - For Overtime wages - for Customer A K 192,000 Dr.
To
Overtime Wages - Direct Workers K 144,000 Cr.
Overtime Wages - Indirect Workers - K 48,000 Cr.
(Being Cost of Extra Overtime Charges paid for specific Customer is transferred so that proper contribution is derived
from particular custmer.)
Note: Direct wages for Overtime hrs are assumed to be allocated to particular Customer as part of Regular
Cost)
Working Sheet for above Entries
Gross Wages to indirect workers in the month
Basic wages - Total Attendeance - 940 Hrs
Rate Per Hour K4000 (Per Hour)
12. Basic Wages - K 3,760,000
Group Bonuses - K 710,000
Emplyer's Pension Contribution - K 405,000
Overtime Wages (Extra 40% for 75 Hrs) - K 120,000 ( K4000 * 40% * 75 Hrs) (Extra)
Gross Wages (Total) - K 4,995,000
Extra Overtime Cost of Specific request of particular Customer
i. 40% of 180 Hrs of Direct Workers - 72 Hrs.
Overtime Cost of Each Direct Worker - K5000*40% = K 2,000
Total Overtime Cost of 72 Hrs of Direct Workers = K2,000 * 72 = K 144,000
ii. 40% of 75 Hrs of Indirect Workers - 30 Hrs.
Overtime Cost of Each Indirect Worker - K4000*40% = K 1,600
Total Overtime Cost of 30 Hrs of Indirect Workers = K1,600 * 30 = K 48,000
Total Cost of Overtime wages of Particular Cutstomer for Direct and Indirect Worker -
Direct Worker - K 144,000
13. Indirect Worker - K 48,000
Total - K 192,000
iii. Cost of Non-productive time machine Breakdown 85 hours - Total Cost working
Basic Wages Cost - K 5000 * 85 = K 425,000
Group Bonuses - K 2,840,000/2640*85 = K 91,439 (Allocation)
Emplyer's Pension Contribution - K 1,460,000/2640 *85 = K 47,008 (Allocaton)
Total Cost K 563,447
iv. Waiting for work 40 hours - Total Cost Working
Basic Wages Cost - K 5000 * 40 = K 200,000
Group Bonuses - K 2,840,000/2640*40 = K 45,030 (Allocation)
Emplyer's Pension Contribution - K 1,460,000/2640 *40 = K 22,121 (Allocaton)
Total Cost K 267,151
QUESTION TEN
14. QUESTION ELEVEN
A) Production report for march 2013:
ON WEIGHTED AVERAGE COST METHOD
(WACM):
Input units Phy. Units Mat. In
Mat.
Cost
Conver.
Cost Total
12000 Op WIP (on WACM) 12000 12000 12000 12000
95000 Introduced & Completed 83000 83000 83000 83000
Transfer out 95000
Normal loss 2000 0 0 0
Cl WIP 10000 10000 8000 6000
107000 (i)Equivalent units 105000 103000 101000
Total costs to account for:
Op WIP 14000 5000 3000 22000
Incurred during march 200000 44000 52000
29600
0
Total Costs 214000 49000 55000
31800
0
(ii)cost per Eq. unit 2.04 0.48 0.54
(iii)Cost of Transf. out 193619.0476 45194 51733
29054
6
(iii)Cost of Cl WIP 20381 3806 3267 27454
Total cost accountted for:
31800
0
(iv) Process 2 Account:
15. DEBIT AMOUNT K CREDIT AMOUNT K
Op WIP 22000 Normal Loss 0
Transf. from Pro 1 200000
Transf. out to
FG 290546
Mat. Added 44000 Cl WIP 27454
Conv. Costs 52000
Total 318000 Total 318000
B) The business has to determine the cost of its products because
1: To determine the selling price of the products.
2: To know the value scrapped out of inputs during the process.
QUESTION TWELVE
Step 1
Working Notes
1
Particular Working
Normal loss in units 5000 kg x 10% 500 units
Normal loss in Amount 500 units x K2 per unit 1000 K
16. Abnormal loss in units
5000 units - 500 units -
4400 units
100 Units
Abnormal loss in
Amount
(110000 x 100 / 4500) units 2422 K
2
Particular Working
Normal loss in units 4400 kg x 5% 220 units
Normal loss in Amount 220 units x K6 per unit 1320 K
Abnormal Gain in units
4200 Units + 220 Units - 4400
Units
20 units
Abnormal Gain in
Amount
(204258 x 20 / 4180) units 977 K
3
Particular Working
Normal loss in units 4200 kg x 10% 420 units
Normal loss in Amount 420 units x K10 per unit 1320 K
Abnormal loss in units 4200 Units - 220 Units - 3500 280 Units
17. Units
Abnormal loss in
Amount
(358475 x 280 / 3780) units 26554 K
Step 2
Process 1 A/c (Working
Note 1)
Particular Qty in Kgs Amount (in K) Particular
Qty in
Kgs
Amount (in
K)
To Raw material 5000 40000 By Normal Loss 500 1000
To direct material 12000
To Direct Labour 10000
By Output transfer to
Process 2 A/c
4400 106578
To Direct Expenses 8000
To Departmental
Overhead
40000
5000 110000 5000 110000
Process 2 A/c (Working
Note 2)
Particular Qty in Kgs Amount (in K) Particular Qty in Amount (in
18. Kgs K)
To Raw material 4400 106578 By Normal Loss 220 1000
To direct material 25280
To Direct Labour 12000
By Output transfer to
Process 3 A/c
4200 203915
To Direct Expenses 12400
To Departmental
Overhead
48000
To Abnormal Gain 20 977
4420 205235 4420 205235
Process 3 A/c (Working
Note 3)
Particular Qty in Kgs Amount (in K) Particular
Qty in
Kgs
Amount (in
K)
To Raw material 4200 203915 By Normal Loss 420 4200
To direct material 46400 By Abnormal Loss. 280 26554
To Direct Labour 20000 By Finished Goods A/c 3500 327721
19. To Direct Expenses 8160
To Departmental
Overhead
80000
4200 358475 4200 358475
Step 3
Normal loss A/c
Particular Qty in Kgs Amount (in K) Particular
Qty in
Kgs
Amount (in
K)
To Process 1 A/c 500 106578 By Abnormal Gain A/c 20 120
To Process 2 A/c 220 25280
To Process 3 A/c 420 12000 By Cash 1120 6400
1140 6520
Abnormal loss
A/c
Particular Qty in Kgs Amount (in K) Particular
Qty in
Kgs
Amount (in
K)
To Process 1 A/c 100 2422 By Cash
Process 1 A/c 100 200
20. Process 3 A/c 280 2800
To Process 3 A/c 280 26554 By Costing PandL A/c 25976
380 28976 380 28976
QUESTION THIRTEEN
Katwa Mutale :
Gross Profit Working for November 2019 :
1. FIFO Method :
Particulars Calculation
No. of
Cars
Rate
Amount in
K
Opening Inventory 3 11400 (34200)
Purchases
( 4 x 11875 )
+
12 (157700)
21. ( 4 x 13300 )
+
( 4 x 14250 )
Sales
( 5 x 19000)
+
( 5 x 19000 )
+
( 1 x 19000 )
11 171000
Closing Inventory
4 x 14250
( remaining 4 cars
which are
purchased on 25th
Nov.)
4 57000
Gross Profit (Total
)
29100
2. LIFO METHOD :
Particulars Calculation No. of Rate Amount in
22. Cars K
Opening
Inventory
3 11400 (34200)
Purchases
( 4 x 11875 )
+
( 4 x 13300 )
+
( 4 x 14250 )
12 (157700)
Sales
( 5 x 19000)
+
( 5 x 19000 )
+
( 1 x 19000 )
11 164000
Closing Inventory
( 3 x 11400 )
+
( 1 x 11875)
( sold 4 cars
which are
purchased on
4 46075
23. 25th Nov , 4
cars which are
purchased on
20th Nov and
3 Cars which
are purchased
on 10th Nov )
Gross
Profit (Total )
18175
3. Weighted Average Method :
Particulars Calculation
No.
of
Cars
Rate
Amount
in K
Opening
Inventory
3 11400 (34200)
Purchases
( 4 x 11875 )
+
( 4 x 13300 )
+
( 4 x 14250 )
12 (157700)
24. Sales
( 5 x 19000)
+
( 5 x 10000 )
+
( 1 x 19000 )
11 164000
Closing
Inventory
Average Rate :
=
(3x11400)+(4x11875)+(4x13300)+(4x14250)
/ 15 Cars
4
12793.333
per car
51173
Gross
Profit (Total
)
23273
QUESTION FOURTEEN
Mutina
total
hour
60
25. basic
hrs
ovetime
40 20
pay
scale:
720 360 basic pay
180 premium
in this
question,
units/hour
is not
mentioned
and with
that I'm
assuming
it as 8
units/
hour
so in 60
hours, the
totoal
output
will be:
480
extra
output
50