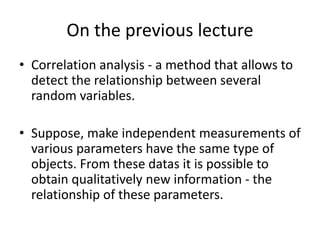
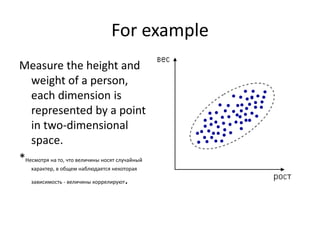
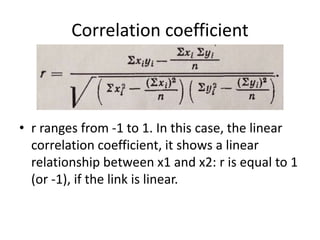
Correlation analysis
The application/use of correlation
analysis
Performed by Maulenbay A. and
Bolatzhan N.
On the previous lecture
• Correlation analysis - a method that allows to
detect the relationship between several
random variables.
• Suppose, make independent measurements of
various parameters have the same type of
objects. From these datas it is possible to
obtain qualitatively new information - the
relationship of these parameters.
For example
Measure the height and
weight of a person,
each dimension is
represented by a point
in two-dimensional
space.
*Несмотря на то, что величины носят случайный
характер, в общем наблюдается некоторая
зависимость - величины коррелируют.
Correlation coefficient
• r ranges from -1 to 1. In this case, the linear
correlation coefficient, it shows a linear
relationship between x1 and x2: r is equal to 1
(or -1), if the link is linear.
Tasks and objectives
• 1) Relationship. Is there a relationship between
the parameters?
• 2) Prediction. If one knows the behavior of the
parameter, it is possible to predict the behavior of
another parameter correlating with the first.
• 3) Classification and identification of objects.
Correlation analysis helps to choose a set of
independent features for classification.
Examples
• 1. Between growth and body weight in vertebrates
there is a positive relationship: the higher the
individuals are usually more weight than individuals
low growth.
• 2. The mean viscosity of the aqueous extract of winter
triticale depends on rainfall. High humidity promotes
the formation of grains with a low viscosity of the
extract.
• If Y depends on the random factor Z1, Z2, V1, V2, and X
depends on the random factor Z1, Z2, U1,between X
and Y there is a statistical dependence among as
random factors have common, namely Z1, Z2
History
• Hippocrates in the 5th century BC, drew attention to
the link between physique and temperament of people
between the structure of the body and the
predisposition to certain diseases. Certain types of
communication such as found in the animal and plant
world. Thus, there is a relationship between the
constitution and the productivity of farm animals;
known connection between the quality of seeds and
crop yields, and so on. The links between varying signs
found at all levels of the organization alive. Therefore
obviously desire to use this pattern in the interests of
the person to give it a more or less precise quantitative
expression.
• Term (Latin ‘correlatio’ - the ratio, the relationship)
was first used by Georges Cuvier in his work "Lectures
on the comparative anatomy" 1806. The mathematical
justification of the method changes of correlation was
given in 1846 by another French scientist O.Brave.
Justifying method Brava meant "the theory of errors in
the plane", bringing the law of Gauss error on the case
of two variables Y and X in crystallography, which he
engaged. Development and application of correlation
method to measure the relationship between
biological signs were made by Galton and Pearson.
Galton belongs and the introduction of the term
"correlation" in biometrics 1886.
Jean Léopold Nicolas Frédéric Cuvier
(1769 –1832)
Carl Friedrich Gauss
(1777–1855)
Sir Francis Galton
(1822 –1911)
In statistics developed many methods for studying
relations, the choice of which depends on the
objectives of the study and of the tasks. Links
between evidence (признаки) and phenomena
(явления), because of their great diversity, are
classified according to a number of grounds.
Signs on their importance for the study of the
relationship are divided into two classes. evidence
objects that cause changes in other related symptoms
are called factorial, or simply factors. Signs,
changing under the influence factor signs as
effective (результативный).
Example
• Physical development of vertebrates :
Good nutritional conditions,
Qualitative education,
Good social,
Absence of pathological diseases
Intensive
growth/development
• To describe the relationships between
variables used mathematical concept of a
function f, that assigns to each a definite value
independent variable Y: y= f(x). X –argument,
y- determined value of the dependent
variable. This kind unambiguous
(однозначные) relationships between
variables is called functional. Physical
conditions are available.
Example
• Obviously increasing of temperature to 10
degree of Celsium
• Lead to the
acceleration of chemical reaction into 2 times
faster.
• Biological characteristic is a function of many
variables, it is influenced by genetic, environmental
factors, which leads to variation in evidence.
• In this case, there is a statistical dependence. Called
statistical dependence in which a change in one of
the values causes a change in the distribution of the
other. In particular, the statistical dependence
manifested in the fact that if you change one of the
values changes the average value other;
• In this case, the statistical relationship is called a
correlation.
Example
• Random variable Y, which is not related to the
value of X functionally and associated correlation.
Let Y - grain yield, X – number of fertilizers. On
the same land areas starred various crops, ie not
Y is a function of X. This is due to the influence of
random factors (precipitation, temperatures et
al.). However, experience has shown that the
average yield is function of the quantity of
fertilizers, i.e. Y is related to X correlation
dependence.
Example
• Studied the relationship between body mass
hamadryas mothers and their newborn
babies. We observed the 20 monkeys.
№ Mass of
hamadryas-
mother Xi (kg)
Mass of newborn
hamadryas in Yi (kg)
Square Xi Square Yi Xi*Yi
1 10,0 0,70 7,00 100,00 0,49
2 10,0 0,70 7,00 100,00 0,49
3 10,1 0,65 6,57 102,01 0,42
4 10,2 0,61 6,22 104,04 0,37
5 10,8 0,73 7,88 116,64 0,53
6 11,0 0,65 7,15 121,00 0,42
7 11,1 0,65 7,23 123,21 0,42
8 11,3 0,70 7,91 127,69 0,49
9 11,3 0,75 8,48 127,69 0,56
10 11,4 0,70 7,98 129,96 0,49
11 11,8 0,69 8,14 139,24 0,48
12 12,0 0,60 7,20 144,00 0,36
13 12,0 0,72 8,64 144,00 0,52
14 12,1 0,75 9,07 146,41 0,56
15 12,3 0,63 7,75 151,29 0,40
16 13,0 0,80 10,40 169,00 0,64
Sums of all derivatives
• Σ Xi = 237.40
• Σ Yi = 14.60
• Σ sqr (Xi) = 167.92
• Σ sqr (Yi) = 2861.60
• Σ Xi*Yi = 9.96
Solution
R xy = 167.92-(1/20)*(237.4*14.06)/sqrt{(2861.60-56358.76/20)*(9.96-
197.68/20) = (167.92-166.89)/sqrt{2861.60-2817.94)*(9.96-9.88) =
1.03/sqrt{(43.66-0.08)} = 1.03/1.87 = 0.55
Conclusion:
Obtained value R xy = 0.55, indicates the presence of a positive mean-
strength correlation between the mass of hamadryas mothers’ weight of
body and the weight of body of their newborns.
Object:
• The hamadryas baboon (Papio hamadryas) is a
species of baboon from the Old World
monkey family. It is the northernmost of all the
baboons, being native to the Horn of Africa and
the southwestern tip of the Arabian Peninsula.
• Males may have a body measurement of up to
80 cm (31 in) and weigh 20–30 kg (44–66 lb);
females weigh 10–15 kg (22–33 lb) and have a
body length of 40–45 cm (16–18 in). The tail adds
a further 40–60 cm (16–24 in) to the length, and
ends in a small tuft. Infants are dark in coloration
and lighten after about one year.
Example 2
• Based on the accumulated data on farm milk fat of
cows and their affiliated (дочерних) individuals of
the same age was compiled following sample
№ Xi*Yi
1 11.32
2 9.86
3 11.25
4 11.22
5 11.90
6 13.03
7 13.39
8 14.52
9 14.20
10 13.42
11 13.72
12 15.35
Σ 153.18
Solution
• R xy = 153.18-(1/12)*(42.46*43.17)/sqrt{(151.09-
1802.85/12)*(155.93-1863.65/12)} = (153.18-
152.75)/sqrt{(151.09-150.24)*(155.93-155.30)} =
0.43/sqrt{(0.85*0.63)} = 0.43/sqrt{0.54} = 0.43/0.73
= 0.59
• Conclusion:
• The correlation between butterfat
(жирномолочностью) of parental cattle individuals
and their offspring was positive and quite high.
Conclusion
Due to independent variation of evidence when the
connection between them is completely absent, r = 0. The
stronger conjugation (сопряженность) between features
(признаками), the higher the value of the coefficient of
correlation. Consequently, |r|>0 when this indicator
characterizes not only the presence but also the degree of
conjugation between the signs. With a positive or a direct
connection when large values ​​of one attribute correspond
to large values ​​as the other, the correlation coefficient is
positive and ranges from 0 to 1, with a negative or inverse
correlation, when large values ​​of one attribute correspond
to smaller values ​​of the other, the correlation coefficient
accompanied by a negative sign and is in the range from 0
to -1.
Purpose
• Correlation analysis reduces (сводится) to
establishing (установлению) the direction and
forms of communication between the varying
characteristics, measurement of its
narrowness (тесноты) and, finally, to the
validation (проверке) of selected indicators of
correlation.
Correlation analysis

Correlation analysis

  • 1.
    Correlation analysis The application/useof correlation analysis Performed by Maulenbay A. and Bolatzhan N.
  • 2.
    On the previouslecture • Correlation analysis - a method that allows to detect the relationship between several random variables. • Suppose, make independent measurements of various parameters have the same type of objects. From these datas it is possible to obtain qualitatively new information - the relationship of these parameters.
  • 3.
    For example Measure theheight and weight of a person, each dimension is represented by a point in two-dimensional space. *Несмотря на то, что величины носят случайный характер, в общем наблюдается некоторая зависимость - величины коррелируют.
  • 4.
    Correlation coefficient • rranges from -1 to 1. In this case, the linear correlation coefficient, it shows a linear relationship between x1 and x2: r is equal to 1 (or -1), if the link is linear.
  • 5.
    Tasks and objectives •1) Relationship. Is there a relationship between the parameters? • 2) Prediction. If one knows the behavior of the parameter, it is possible to predict the behavior of another parameter correlating with the first. • 3) Classification and identification of objects. Correlation analysis helps to choose a set of independent features for classification.
  • 6.
    Examples • 1. Betweengrowth and body weight in vertebrates there is a positive relationship: the higher the individuals are usually more weight than individuals low growth. • 2. The mean viscosity of the aqueous extract of winter triticale depends on rainfall. High humidity promotes the formation of grains with a low viscosity of the extract. • If Y depends on the random factor Z1, Z2, V1, V2, and X depends on the random factor Z1, Z2, U1,between X and Y there is a statistical dependence among as random factors have common, namely Z1, Z2
  • 7.
    History • Hippocrates inthe 5th century BC, drew attention to the link between physique and temperament of people between the structure of the body and the predisposition to certain diseases. Certain types of communication such as found in the animal and plant world. Thus, there is a relationship between the constitution and the productivity of farm animals; known connection between the quality of seeds and crop yields, and so on. The links between varying signs found at all levels of the organization alive. Therefore obviously desire to use this pattern in the interests of the person to give it a more or less precise quantitative expression.
  • 9.
    • Term (Latin‘correlatio’ - the ratio, the relationship) was first used by Georges Cuvier in his work "Lectures on the comparative anatomy" 1806. The mathematical justification of the method changes of correlation was given in 1846 by another French scientist O.Brave. Justifying method Brava meant "the theory of errors in the plane", bringing the law of Gauss error on the case of two variables Y and X in crystallography, which he engaged. Development and application of correlation method to measure the relationship between biological signs were made by Galton and Pearson. Galton belongs and the introduction of the term "correlation" in biometrics 1886.
  • 10.
    Jean Léopold NicolasFrédéric Cuvier (1769 –1832)
  • 11.
    Carl Friedrich Gauss (1777–1855) SirFrancis Galton (1822 –1911)
  • 12.
    In statistics developedmany methods for studying relations, the choice of which depends on the objectives of the study and of the tasks. Links between evidence (признаки) and phenomena (явления), because of their great diversity, are classified according to a number of grounds. Signs on their importance for the study of the relationship are divided into two classes. evidence objects that cause changes in other related symptoms are called factorial, or simply factors. Signs, changing under the influence factor signs as effective (результативный).
  • 13.
    Example • Physical developmentof vertebrates : Good nutritional conditions, Qualitative education, Good social, Absence of pathological diseases Intensive growth/development
  • 14.
    • To describethe relationships between variables used mathematical concept of a function f, that assigns to each a definite value independent variable Y: y= f(x). X –argument, y- determined value of the dependent variable. This kind unambiguous (однозначные) relationships between variables is called functional. Physical conditions are available.
  • 15.
    Example • Obviously increasingof temperature to 10 degree of Celsium • Lead to the acceleration of chemical reaction into 2 times faster.
  • 16.
    • Biological characteristicis a function of many variables, it is influenced by genetic, environmental factors, which leads to variation in evidence. • In this case, there is a statistical dependence. Called statistical dependence in which a change in one of the values causes a change in the distribution of the other. In particular, the statistical dependence manifested in the fact that if you change one of the values changes the average value other; • In this case, the statistical relationship is called a correlation.
  • 17.
    Example • Random variableY, which is not related to the value of X functionally and associated correlation. Let Y - grain yield, X – number of fertilizers. On the same land areas starred various crops, ie not Y is a function of X. This is due to the influence of random factors (precipitation, temperatures et al.). However, experience has shown that the average yield is function of the quantity of fertilizers, i.e. Y is related to X correlation dependence.
  • 18.
    Example • Studied therelationship between body mass hamadryas mothers and their newborn babies. We observed the 20 monkeys.
  • 19.
    № Mass of hamadryas- motherXi (kg) Mass of newborn hamadryas in Yi (kg) Square Xi Square Yi Xi*Yi 1 10,0 0,70 7,00 100,00 0,49 2 10,0 0,70 7,00 100,00 0,49 3 10,1 0,65 6,57 102,01 0,42 4 10,2 0,61 6,22 104,04 0,37 5 10,8 0,73 7,88 116,64 0,53 6 11,0 0,65 7,15 121,00 0,42 7 11,1 0,65 7,23 123,21 0,42 8 11,3 0,70 7,91 127,69 0,49 9 11,3 0,75 8,48 127,69 0,56 10 11,4 0,70 7,98 129,96 0,49 11 11,8 0,69 8,14 139,24 0,48 12 12,0 0,60 7,20 144,00 0,36 13 12,0 0,72 8,64 144,00 0,52 14 12,1 0,75 9,07 146,41 0,56 15 12,3 0,63 7,75 151,29 0,40 16 13,0 0,80 10,40 169,00 0,64
  • 20.
    Sums of allderivatives • Σ Xi = 237.40 • Σ Yi = 14.60 • Σ sqr (Xi) = 167.92 • Σ sqr (Yi) = 2861.60 • Σ Xi*Yi = 9.96
  • 21.
    Solution R xy =167.92-(1/20)*(237.4*14.06)/sqrt{(2861.60-56358.76/20)*(9.96- 197.68/20) = (167.92-166.89)/sqrt{2861.60-2817.94)*(9.96-9.88) = 1.03/sqrt{(43.66-0.08)} = 1.03/1.87 = 0.55 Conclusion: Obtained value R xy = 0.55, indicates the presence of a positive mean- strength correlation between the mass of hamadryas mothers’ weight of body and the weight of body of their newborns.
  • 22.
    Object: • The hamadryasbaboon (Papio hamadryas) is a species of baboon from the Old World monkey family. It is the northernmost of all the baboons, being native to the Horn of Africa and the southwestern tip of the Arabian Peninsula. • Males may have a body measurement of up to 80 cm (31 in) and weigh 20–30 kg (44–66 lb); females weigh 10–15 kg (22–33 lb) and have a body length of 40–45 cm (16–18 in). The tail adds a further 40–60 cm (16–24 in) to the length, and ends in a small tuft. Infants are dark in coloration and lighten after about one year.
  • 24.
    Example 2 • Basedon the accumulated data on farm milk fat of cows and their affiliated (дочерних) individuals of the same age was compiled following sample № Xi*Yi 1 11.32 2 9.86 3 11.25 4 11.22 5 11.90 6 13.03 7 13.39 8 14.52 9 14.20 10 13.42 11 13.72 12 15.35 Σ 153.18
  • 25.
    Solution • R xy= 153.18-(1/12)*(42.46*43.17)/sqrt{(151.09- 1802.85/12)*(155.93-1863.65/12)} = (153.18- 152.75)/sqrt{(151.09-150.24)*(155.93-155.30)} = 0.43/sqrt{(0.85*0.63)} = 0.43/sqrt{0.54} = 0.43/0.73 = 0.59 • Conclusion: • The correlation between butterfat (жирномолочностью) of parental cattle individuals and their offspring was positive and quite high.
  • 26.
    Conclusion Due to independentvariation of evidence when the connection between them is completely absent, r = 0. The stronger conjugation (сопряженность) between features (признаками), the higher the value of the coefficient of correlation. Consequently, |r|>0 when this indicator characterizes not only the presence but also the degree of conjugation between the signs. With a positive or a direct connection when large values ​​of one attribute correspond to large values ​​as the other, the correlation coefficient is positive and ranges from 0 to 1, with a negative or inverse correlation, when large values ​​of one attribute correspond to smaller values ​​of the other, the correlation coefficient accompanied by a negative sign and is in the range from 0 to -1.
  • 27.
    Purpose • Correlation analysisreduces (сводится) to establishing (установлению) the direction and forms of communication between the varying characteristics, measurement of its narrowness (тесноты) and, finally, to the validation (проверке) of selected indicators of correlation.