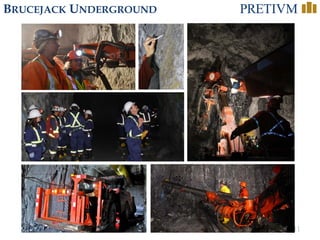
1
CORPORATE PRESENTATION
Aug 22, 2014
2
CAUTIONARY STATEMENT
Forward Looking Information
This Presentation contains “forward-looking information” and “forward looking statements” within the meaning of applicable Canadian and United States
securities legislation. Forward-looking information may include, but is not limited to, the anticipated production and developments in our operations in future
periods, information with respect to our planned exploration and development activities, the adequacy of our financial resources, the estimation of mineral
reserves and resources including the 2013 Valley of the Kings Mineral Resource estimate, realization of mineral reserve and resource estimates and timing of
development of our Brucejack Project, costs and timing of future exploration, results of future exploration and drilling, production and processing estimates,
capital and operating cost estimates, timelines and similar statements relating to the economic viability of the Brucejack Project, timing and receipt of
approvals, consents and permits under applicable legislation, our executive compensation approach and practice, the composition of our board of directors and
committees and adequacy of financial resources. Wherever possible, words such as “plans”, “expects”, “projects”, “assumes”, “budget”, “strategy”,
“scheduled”, “estimates”, “forecasts”, “anticipates”, “believes”, “intends”, “targets” and similar expressions or statements that certain actions, events or results
“may”, “could”, “would”, “might” or “will” be taken, occur or be achieved, or the negative forms of any of these terms and similar expressions, have been
used to identify forward-looking statements and information. Statements concerning mineral reserve and resource estimates may also be deemed to constitute
forward-looking information to the extent that they involve estimates of the mineralization that will be encountered if the property is developed. Any
statements that express or involve discussions with respect to predictions, expectations, beliefs, plans, projections, objectives, assumptions or future events or
performance are not statements of historical fact and may be forward-looking information. Forward-looking information is subject to a variety of known and
unknown risks, uncertainties and other factors that could cause actual events or results to differ from those expressed or implied by the forward-looking
information, including, without limitation, those risks identified in our Annual Information Form dated March 31, 2014 filed on SEDAR at www.sedar.com and
in the United States on Form 40-F through EDGAR at the SEC’s website at www.sec.gov. Forward-looking information is based on the expectations and
opinions of our management on the date the statements are made. The assumptions used in the preparation of such statements, although considered
reasonable at the time of preparation, may prove to be imprecise. We do not assume any obligation to update forward-looking information, whether as a result
of new information, future events or otherwise, other than as required by applicable law. For the reasons set forth above, prospective investors should not place
undue reliance on forward-looking information.
National Instrument 43-101
Technical and scientific information contained herein relating to the Projects is derived from National Instrument 43-101 (“NI 43-101”) compliant technical
reports (“Reports”) “Mineral Resources Update Technical Report” dated December 19, 2013 and “Feasibility Study and Technical Report on the Brucejack
Project, Stewart, BC” dated June 19, 2014. We have filed the Reports and Update under our profile at www.sedar.com. Technical and scientific information
not contained within the Reports for the Projects have been prepared under the supervision of Mr. Kenneth C. McNaughton, P.Eng. and Ian Chang, P.Eng.,
each of whom is an independent “qualified person” under NI 43-101.
This presentation uses the terms “measured resources”, “indicated resources” (together “M&I”) and “inferred resources”. Although these terms are recognized
and required by Canadian regulations (under NI 43-101), the United States Securities and Exchange Commission does not recognize them. Mineral resources
which are not mineral reserves do not have demonstrated economic viability. The estimate of mineral resources may be materially affected by environmental,
permitting, legal, title, taxation, socio-political, marketing, or other relevant issues. There is no guarantee that all or any part of the mineral resource will be
converted into mineral reserves.
In addition, “inferred resources” have a great amount of uncertainty as to their existence, and economic and legal feasibility. It cannot be assumed that all or
any part of an inferred mineral resource will ever be upgraded to a higher category. Under Canadian rules, estimates of inferred mineral resources may not
form the basis of feasibility or pre feasibility studies, or economic studies, except for a Preliminary Assessment as defined under NI 43-101. Investors are
cautioned not to assume that part or all of an inferred resource exists, or is economically or legally mineable.
Currency
Unless otherwise indicated, all dollar values herein are in Canadian $.
3
 High-grade
underground gold
project
 Commercial
production target
2017
 Located in British
Columbia, Canada
V A L U E T H R O U G H G O L D
4
BRUCEJACK PROJECT LOCATION
5
HIGH-GRADE GOLD RESERVES(1,2)
Valley of the Kings
West Zone
Category Tonnes
(mil)
Gold
(g/t)
Silver
(g/t)
Contained
Gold
(mil oz)
Silver
(mil oz)
Proven 1.4 7.2 383 0.3 17.4
Probable 1.5 6.5 181 0.3 8.6
Total P&P 2.9 6.9 279 0.6 26.0
Valley of the Kings Mineral Reserve Estimate – June 2014 West Zone Mineral Reserve Estimate – June 2014
(1) Source: Feasibility Study and Technical Report Update on the Brucejack Project, dated June 19, 2014
(2) Base case metals prices of US$1,100/oz gold and US$17/oz silver
Category Tonnes
(mil)
Gold
(g/t)
Silver
(g/t)
Contained
Gold
(mil oz)
Silver
(mil oz)
Proven 2.1 15.6 12 1.1 0.8
Probable 11.5 15.7 10 5.8 3.9
Total P&P 13.6 15.7 11 6.9 4.6
6
BRUCEJACK PROJECT ECONOMICS
(1) Source: Feasibility Study and Technical Report Update on the Brucejack Project, dated June 19, 2014
(2) NPV is discounted to July 2014.
June 2014 Feasibility Study (1)
Economic Results by Metal Price
Low Case Base Case High Case
Gold / Silver Price
(US$/ounce)
$800 / $15 $1,100 / $17 $1,400 / $21
Capex
(US$million)
$746.9 $746.9 $746.9
Net Cash Flow (US$)
$2.02 billion (pre-tax)
$1.34 billion (post-tax)
$4.16 billion (pre-tax)
$2.72 billion (post-tax)
$6.35 billion (pre-tax)
$4.13 billion (post-tax)
Net Present Value (2)
(5.0% discount) (US$)
$985 million (pre-tax)
$620 million (post-tax)
$2.25 billion (pre-tax)
$1.45 billion (post-tax)
$3.54 billion (pre-tax)
$2.28 billion (post-tax)
Internal Rate of
Return
20.3% (pre-tax)
16.5% (post-tax)
34.7% (pre-tax)
28.5% (post-tax)
47%(pre-tax)
38.7% (post-tax)
Payback (from start of
production period)
4.4 years (pre-tax)
4.5 years (post-tax)
2.7 years (pre-tax)
2.8 years (post-tax)
2.0 years (pre-tax)
2.1 years (post-tax)
Exchange Rate
(US$:C$)
0.92 0.92 0.92
7
BRUCEJACK PROJECT PRODUCTION (1)
• Mine life of 18 years producing an estimated 7.27 million
ounces of gold
• Average annual production of 504,000 ounces of gold
over the first 8 years and 404,000 ounces of gold over
mine life
 Gold and silver recoveries of 96.7% and 90.0% over mine
life
 Production rate of 2,700 tonnes per day
(1) Source: Feasibility Study and Technical Report Update on the Brucejack Project, dated June 19, 2014
8
BRUCEJACK CAPITAL COSTS
June 2014 Feasibility Study (1)
Capital Cost Summary
(US$ million)
Mine underground 179.5
Mine site (2) 210.8
Offsite Infrastructure 89.1
Total Direct Costs 479.4
Indirect Costs 127.5
Owner’s Costs 71.0
Contingency 69.0
Total Capital Cost 746.9
(1) Source: Feasibility Study and Technical Report Update on the Brucejack Project, dated June 19, 2014
(2) Includes mine site, mine site process, mine site utilities, mine site facilities, tailings facilities, mine site temporary facilities
and surface mobile equipment.
9
BRUCEJACK OPERATING COSTS
June 2014 Feasibility Study (1)
Operating Costs Summary
(C$/tonne)
Mining 91.34 (2)
Processing 19.69
General & Administrative 30.87
Surface Services and Others 21.15
Total Operating Cost 163.05
(1) Source: Feasibility Study and Technical Report Update on the Brucejack Project, dated June 19, 2014
(2) LOM ore milled; if excluding the ore mined during preproduction, the estimated cost is C$91.78/t.
10
COST: HIGH-GRADE ADVANTAGE
June 2014 Feasibility Study (1)
All-In Sustaining Cash Costs Life of Mine
(US$ million)
Total Cash Costs (2) 2,814.5
Reclamation Cost Accretion 27.5
Sustaining Capital Expenditure 320.6
All-in Sustaining Cash Costs 3,162.6
Gold Sales 7,067
All-in Sustaining Cash Costs
per Ounce
US$448/ounce
(1) Source: Feasibility Study and Technical Report Update on the Brucejack Project, dated June 19, 2014.
(2) Net of silver credits at Base Case silver price of $US17/ounce.
11
BRUCEJACK UNDERGROUND
12
VALLEY OF THE KINGS: STOCKWORK
S
N
Cleo West Drift 615L West Raise
Domain 20
~0.5 m
13
MINING: YEAR 1
14
MINING: YEAR 2
15
MINING: YEAR 3
16
MINING: YEAR 4
17
MINING: YEAR 5
18
LIFE OF MINE PLAN
Oblique view facing west
Valley of the Kings
West Zone
Portals
19
MINING METRICS (1)
 30 m level spacing
 Maximum of 45 m stope
lengths
 15 m widths
 Dilution Factors
– Primary Stopes: 7%
– Secondary Stopes: 15%
 Mining Recovery Factors
– Primary Stopes: 97.5%
– Secondary Stopes: 92.5%
 Average 12 stopes in the
mining and backfill cycle at
any time
(1) See Feasibility Study and Technical Report Update on the Brucejack Project, dated June 19, 2014
20
SITE LAYOUT
Portals
Mill
Camp
Development Rock
Disposal Laydown &
Fuel Storage
Substation
West Zone
Portal
Truck Shop
21
PROJECT FLOW SHEET
22
 Gold and silver recoveries of
96.7% and 90.0% over mine life
 Gravity (43.3% LOM) and
flotation ( 53.4% LOM)
concentration
 Producing doré and gold/silver
concentrate
 Bulk sample processing with
single stage gravity and
flotation concentration yielded
gold recoveries averaging 98%
PROCESSING
Bulk sample gravity concentrate at Contact Mill, Montana
Bulk sample flotation concentrate at Contact Mill, Montana
23
PERMITTING PROCESS
Scope and
Process
determined
1st Public
Comment
Period
Application
Submitted
Application
evaluated for
completeness
Application
review, 2nd
Public
Comment
Period
Assessment
Report
Referral to
Ministers
January 2013
Five Open
Houses in
November
2013
(Submitted
June 20, 2014)
(Completed
July 24, 2014)
180-day review started
August 13, 2014
Project
Description
Filed
Project
Decision by
Ministers
(Decision 45 days)
 BC Environmental Assessment Office (EAO) manages it
 Federal review coordinated by Federal Environmental
Assessment Agency (CEAA) for relevant areas
 Provincial and Federal reviews are coordinated
For more information on assessment process: www.eao.gov.bc.ca/ea_process.html
(Anticipate
H1 2015)
24
COMMUNITY ENGAGEMENT
 Commercial relationships with local First
Nations during the exploration phase at
Brucejack have been mutually successful
 Examples of Brucejack Project contracts with
First Nation development corporations
include camp construction, access road
maintenance, waste rock disposal
 The proposed mine will provide
approximately 800 jobs during construction
and 500 jobs during operations
 We will continue to extend both commercial
contract and employment opportunities to
locals whenever possible
25
NEAREST FISH 20KM AWAY
CASCADE
BRUCEJACK
PROJECT
BRUCEJACK LAKE
(not fish habitat)
26
FINANCING THE BRUCEJACK PROJECT
 Various proposals in addition to equity have been
brought to us, including: royalty, forward sale, high-
yield debt, convertible notes, gold-linked bonds, project
debt, streaming
 All options will be considered to maximize return
 Anticipate financing plan to be finalized in Q4
27
THE NEXT 12 MONTHS:
2014/H2
 Updated Feasibility Study
 Filed Environmental Assessment
Certificate application and
Environmental Impact Study
 In-fill drill program underway
 Retain EPCM contractor
 Basic and detailed engineering
 Financing plan
 Potential production of additional 1,000
tonnes of high-grade ore
2015/H1
 Anticipate receiving permits
 Production decision
 Start construction
28
HIGH-GRADE GOLD WITH SIZE
Data source: Companies
Valley of the Kings reserves based on Feasibility Study and Technical Report Update on the Brucejack Project, dated June 19, 2014
Kirkland Lake Mine
(Kirkland Lake)
Kensington
(Coeur)
Casa Berardi
(Hecla)
El Penon
(Yamana)
Red Lake
(Goldcorp)
Pogo Mine
(Sumitomo)
Valley of the Kings
Cerro Negro
(Goldcorp)Eleonore
(Goldcorp)
0.0
2.0
4.0
6.0
8.0
10.0
12.0
14.0
16.0
0.0 1.0 2.0 3.0 4.0 5.0 6.0 7.0 8.0
Proven+ProbableGoldGrade(g/t)
Proven + Probable Gold Reserves (mm oz)
29
PRETIVM MANAGEMENT
Robert Quartermain, B.Sc., M.Sc., P.Geo, D.Sc.
President & Chief Executive Officer,
Director
Joseph Ovsenek, B.A. Sc., P.Eng., LLB
Executive Vice President & Chief Development Officer,
Director
Ken McNaughton, M.A. Sc., P.Eng.
Vice President & Chief Exploration Officer
Ian I Chang, M.A. Sc., P.Eng.
Vice President, Project Development
Michelle Romero, B.A., M.L.S.
Vice President, Corporate Relations
Kevin Torpy, B.Sc.
Director, Operations
Warwick Board, Ph.D., P.Geo.
Chief Geologist
Max Holtby, B.Sc., P. Geo.
Director, Permitting
James A Currie, P.Eng.
Vice President & Chief Operating Officer
Peter de Visser, CA
Chief Financial Officer
30
SHAREHOLDING & ANALYST COVERAGE
(1) As of Aug 15, 2014; ownership calculated on an undiluted basis.
(2) As of Aug 19, 2014. Source: IPREO, SEDI
(3) See News Releases dated July 29, 2014 & Aug 15, 2014
Top Shareholders(2)
(shares in millions)
Silver Standard Resources 17.320
Liberty Metals & Mining 7,346
Aristeia Capital, LLC 5.322
Royce & Associates 4.551
Sun Valley Gold, LLC 3.361
Robert Quartermain 2.808
Franklin Advisors, Inc. 2.469
Norges Bank Investment
TD Asset Management
2.457
1.934
Sprott Asset Management 1.851
Weiss Asset Management 1.837
Analyst Coverage
BMO John Hayes
CIBC Jeff Killeen
Citibank Alex Hacking
Cormark Securities Richard Gray
Cowen Securities Adam Graf
GMP Securities George Albino
H.C. Wainwright Jeff Wright
RBC Dan Rollins
Roth Capital Partners Joseph Reagor
Salman Partners Ash Guglani
Scotiabank Ovais Habib
Capital Structure(1)
Public Float 99.5
Silver Standard Shares 17.3
Total Issued & Outstanding Shares 116.8
Incentive Options 10.4
Total Fully Diluted Shares 127.2
Market Cap (at Aug. 22, 2014) C$875 million
Working Capital (at June 30, 2014) C$22.7 million
(shares in millions)
Silver
Standard,
15 %
Institutions,
52%
Management,
4%
Retail,
30%
Gross Proceeds of Share Offering(3) US$60.5 million
31
APPENDIX: 2013 RESOURCE ESTIMATE
Valley of the Kings Mineral Resource estimate - December 2013(1),(4)
(Based on a cut-off grade of 5.0 grams of gold-equivalent/tonne(5))
Category
Tonnes
(millions)
Gold
(g/t)
Silver
(g/t)
Contained(3)
Gold
(million oz)
Silver
(million oz)
Measured 2.0 19.3 14.4 1.2 0.9
Indicated 13.4 17.4 14.3 7.5 6.1
M & I 15.3 17.6 14.3 8.7 7.0
Inferred(2) 5.9 25.6 20.6 4.9 3.9
(1) Mineral Resources which are not Mineral Reserves do not have demonstrated economic viability. The estimate of Mineral Resources may be materially affected by
environmental, permitting, legal, marketing, or other relevant issues. The Mineral Resources in this news release were estimated using the Canadian Institute of Mining,
Metallurgy and Petroleum (CIM), CIM Standards on Mineral Resources and Reserves, Definitions and Guidelines prepared by the CIM Standing Committee on Reserve
Definitions and adopted by CIM Council.
(2) The quantity and grade of reported Inferred resources in this estimation are uncertain in nature and there has been insufficient exploration to define these Inferred Resources as
an Indicated or Measured Mineral Resource and it is uncertain if further exploration will result in upgrading them to an Indicated or Measured Mineral Resource category.
(3) Contained metal figures and totals may differ due to rounding of figures.
(4) The Mineral Resource estimate stated in Table 1 is defined using 10 m by 10 m by 10 m blocks in the in Valley of the Kings.
(5) The gold equivalent value is defined as AuEq = Au + Ag/53.
(6) See Brucejack Project Mineral Resources Update Technical Report dated December 19, 2013.
 The updated Valley of the Kings Resource estimate announced in
December(6) added Measured gold Resources and increased gold grade:
32
APPENDIX: 2013 RESOURCE MODEL – VALLEY OF THE KINGS
5-10
10-20
20-60
>60
Key (g/t Au)
December 2013 Mineral Resource
Measured and Indicated Blocks >5g/t Au.
Blocks are 10m x 10m x 10m
100 m
N
33
APPENDIX: 2013 UNDERGROUND DRILLING
Fragmental
Volcanic Rocks
Polylithic
Conglomerate
Volcanic
Sediment
50 m
N
Completed Underground
Development
Completed Bulk Sample
Legend
>20
Key (g/t Au)
Assay intervals
5.0-20.0
2.5-5.0
Silicified
Conglomerate
Volcanic Flows
34
APPENDIX: VALLEY OF THE KINGS M+I RESOURCE
Northing
(± 25 m)
M+I Gold*
(Oz.)
6258225 138,175
6258175 412,508
6258125 853,632
6258075 342,402
6258025 2,161,727
6257975 2,434,390
6257925 1,126,442
6257875 643,503
6257825 410,615
6257775 87,687
*Dec. 2013 M+I Mineral
Resource; ≥5.0 g/t Au.
1.20 1.87 1.53 2.28 1.17 0.52 0.52
M+I Au*
(Moz.)
Surface projection of December 2013 Mineral Resource estimate, with total ounces per 100 m Easting and 50 m Northing strips
35
10.93m @ 43.57 ppm Au
0.5m @ 26.00 ppm Au
N
2014 SURFACE DRILLING: PLAN VIEW
<0.5
0.5-1.0
1.0-5.0
>20
5.0-20.0
Key (g/t Au)
Assay intervals
200m
Existing Underground
Development
SU-627
Latite Dykes
(projected from 1345m)
Latite Dykes
(projected from 1345m)
SU-628
SU-629
1.5m @ 19.05 ppm Au
0.5m @
17.95 ppm Au
SU-630
5m @ 17.34 ppm Au
1.5m @ 32.5 ppm Au
1m @ 11.35 ppm Au
0.5m @ 11.1 ppm Au
36
EXPLORATION POTENTIAL AT DEPTH
10.93m @ 43.57 ppm
Au
0.5m @ 26.00 ppm
Au
N S
200m
<0.5
0.5-1.0
1.0-5.0
>20
5.0-20.0
Key (g/t Au)
(Assay intervals)
Fragmental
Volcanic Rocks
Polylithic
Conglomerate Volcanic
Flows
Volcaniclastic
Sediments
Volcanic Flows
5-10
10-20
>20
Key (g/t Au)
(Blocks)
(M&I + Inferred)
SU-627
Latite Dykes
SU-630
SU-628
SU-629
1.5m @ 19.05 ppm
Au
0.5m @
17.95 ppm
Au
5m @ 17.34 ppm
Au
1.5m @ 32.5 ppm Au
1m @ 11.35 ppm Au
0.5m @ 11.1 ppm Au
Section 426765E (500m wide)
37
CONTACT:
Phone: 604-558-1784
Fax: 604-558-4784
Toll-free: 1-877-558-1784
invest@pretivm.com
www.pretivm.com
HEAD OFFICE:
Pretium Resources Inc.
570 Granville St.
Suite 1600
Vancouver, BC
Canada V6C 3P1
COMMON SHARES:
TSX/NYSE:PVG
Issued: 116.8 million
Fully diluted: 127.2 million
52-week hi/low:
$10.67/$2.83
Market cap: $875 million
(at Aug. 22, 2014)
Advancing a major high-grade gold project in Canada
37

Corporate Presentation Aug 22, 2014

  • 1.
  • 2.
    2 CAUTIONARY STATEMENT Forward LookingInformation This Presentation contains “forward-looking information” and “forward looking statements” within the meaning of applicable Canadian and United States securities legislation. Forward-looking information may include, but is not limited to, the anticipated production and developments in our operations in future periods, information with respect to our planned exploration and development activities, the adequacy of our financial resources, the estimation of mineral reserves and resources including the 2013 Valley of the Kings Mineral Resource estimate, realization of mineral reserve and resource estimates and timing of development of our Brucejack Project, costs and timing of future exploration, results of future exploration and drilling, production and processing estimates, capital and operating cost estimates, timelines and similar statements relating to the economic viability of the Brucejack Project, timing and receipt of approvals, consents and permits under applicable legislation, our executive compensation approach and practice, the composition of our board of directors and committees and adequacy of financial resources. Wherever possible, words such as “plans”, “expects”, “projects”, “assumes”, “budget”, “strategy”, “scheduled”, “estimates”, “forecasts”, “anticipates”, “believes”, “intends”, “targets” and similar expressions or statements that certain actions, events or results “may”, “could”, “would”, “might” or “will” be taken, occur or be achieved, or the negative forms of any of these terms and similar expressions, have been used to identify forward-looking statements and information. Statements concerning mineral reserve and resource estimates may also be deemed to constitute forward-looking information to the extent that they involve estimates of the mineralization that will be encountered if the property is developed. Any statements that express or involve discussions with respect to predictions, expectations, beliefs, plans, projections, objectives, assumptions or future events or performance are not statements of historical fact and may be forward-looking information. Forward-looking information is subject to a variety of known and unknown risks, uncertainties and other factors that could cause actual events or results to differ from those expressed or implied by the forward-looking information, including, without limitation, those risks identified in our Annual Information Form dated March 31, 2014 filed on SEDAR at www.sedar.com and in the United States on Form 40-F through EDGAR at the SEC’s website at www.sec.gov. Forward-looking information is based on the expectations and opinions of our management on the date the statements are made. The assumptions used in the preparation of such statements, although considered reasonable at the time of preparation, may prove to be imprecise. We do not assume any obligation to update forward-looking information, whether as a result of new information, future events or otherwise, other than as required by applicable law. For the reasons set forth above, prospective investors should not place undue reliance on forward-looking information. National Instrument 43-101 Technical and scientific information contained herein relating to the Projects is derived from National Instrument 43-101 (“NI 43-101”) compliant technical reports (“Reports”) “Mineral Resources Update Technical Report” dated December 19, 2013 and “Feasibility Study and Technical Report on the Brucejack Project, Stewart, BC” dated June 19, 2014. We have filed the Reports and Update under our profile at www.sedar.com. Technical and scientific information not contained within the Reports for the Projects have been prepared under the supervision of Mr. Kenneth C. McNaughton, P.Eng. and Ian Chang, P.Eng., each of whom is an independent “qualified person” under NI 43-101. This presentation uses the terms “measured resources”, “indicated resources” (together “M&I”) and “inferred resources”. Although these terms are recognized and required by Canadian regulations (under NI 43-101), the United States Securities and Exchange Commission does not recognize them. Mineral resources which are not mineral reserves do not have demonstrated economic viability. The estimate of mineral resources may be materially affected by environmental, permitting, legal, title, taxation, socio-political, marketing, or other relevant issues. There is no guarantee that all or any part of the mineral resource will be converted into mineral reserves. In addition, “inferred resources” have a great amount of uncertainty as to their existence, and economic and legal feasibility. It cannot be assumed that all or any part of an inferred mineral resource will ever be upgraded to a higher category. Under Canadian rules, estimates of inferred mineral resources may not form the basis of feasibility or pre feasibility studies, or economic studies, except for a Preliminary Assessment as defined under NI 43-101. Investors are cautioned not to assume that part or all of an inferred resource exists, or is economically or legally mineable. Currency Unless otherwise indicated, all dollar values herein are in Canadian $.
  • 3.
    3  High-grade underground gold project Commercial production target 2017  Located in British Columbia, Canada V A L U E T H R O U G H G O L D
  • 4.
  • 5.
    5 HIGH-GRADE GOLD RESERVES(1,2) Valleyof the Kings West Zone Category Tonnes (mil) Gold (g/t) Silver (g/t) Contained Gold (mil oz) Silver (mil oz) Proven 1.4 7.2 383 0.3 17.4 Probable 1.5 6.5 181 0.3 8.6 Total P&P 2.9 6.9 279 0.6 26.0 Valley of the Kings Mineral Reserve Estimate – June 2014 West Zone Mineral Reserve Estimate – June 2014 (1) Source: Feasibility Study and Technical Report Update on the Brucejack Project, dated June 19, 2014 (2) Base case metals prices of US$1,100/oz gold and US$17/oz silver Category Tonnes (mil) Gold (g/t) Silver (g/t) Contained Gold (mil oz) Silver (mil oz) Proven 2.1 15.6 12 1.1 0.8 Probable 11.5 15.7 10 5.8 3.9 Total P&P 13.6 15.7 11 6.9 4.6
  • 6.
    6 BRUCEJACK PROJECT ECONOMICS (1)Source: Feasibility Study and Technical Report Update on the Brucejack Project, dated June 19, 2014 (2) NPV is discounted to July 2014. June 2014 Feasibility Study (1) Economic Results by Metal Price Low Case Base Case High Case Gold / Silver Price (US$/ounce) $800 / $15 $1,100 / $17 $1,400 / $21 Capex (US$million) $746.9 $746.9 $746.9 Net Cash Flow (US$) $2.02 billion (pre-tax) $1.34 billion (post-tax) $4.16 billion (pre-tax) $2.72 billion (post-tax) $6.35 billion (pre-tax) $4.13 billion (post-tax) Net Present Value (2) (5.0% discount) (US$) $985 million (pre-tax) $620 million (post-tax) $2.25 billion (pre-tax) $1.45 billion (post-tax) $3.54 billion (pre-tax) $2.28 billion (post-tax) Internal Rate of Return 20.3% (pre-tax) 16.5% (post-tax) 34.7% (pre-tax) 28.5% (post-tax) 47%(pre-tax) 38.7% (post-tax) Payback (from start of production period) 4.4 years (pre-tax) 4.5 years (post-tax) 2.7 years (pre-tax) 2.8 years (post-tax) 2.0 years (pre-tax) 2.1 years (post-tax) Exchange Rate (US$:C$) 0.92 0.92 0.92
  • 7.
    7 BRUCEJACK PROJECT PRODUCTION(1) • Mine life of 18 years producing an estimated 7.27 million ounces of gold • Average annual production of 504,000 ounces of gold over the first 8 years and 404,000 ounces of gold over mine life  Gold and silver recoveries of 96.7% and 90.0% over mine life  Production rate of 2,700 tonnes per day (1) Source: Feasibility Study and Technical Report Update on the Brucejack Project, dated June 19, 2014
  • 8.
    8 BRUCEJACK CAPITAL COSTS June2014 Feasibility Study (1) Capital Cost Summary (US$ million) Mine underground 179.5 Mine site (2) 210.8 Offsite Infrastructure 89.1 Total Direct Costs 479.4 Indirect Costs 127.5 Owner’s Costs 71.0 Contingency 69.0 Total Capital Cost 746.9 (1) Source: Feasibility Study and Technical Report Update on the Brucejack Project, dated June 19, 2014 (2) Includes mine site, mine site process, mine site utilities, mine site facilities, tailings facilities, mine site temporary facilities and surface mobile equipment.
  • 9.
    9 BRUCEJACK OPERATING COSTS June2014 Feasibility Study (1) Operating Costs Summary (C$/tonne) Mining 91.34 (2) Processing 19.69 General & Administrative 30.87 Surface Services and Others 21.15 Total Operating Cost 163.05 (1) Source: Feasibility Study and Technical Report Update on the Brucejack Project, dated June 19, 2014 (2) LOM ore milled; if excluding the ore mined during preproduction, the estimated cost is C$91.78/t.
  • 10.
    10 COST: HIGH-GRADE ADVANTAGE June2014 Feasibility Study (1) All-In Sustaining Cash Costs Life of Mine (US$ million) Total Cash Costs (2) 2,814.5 Reclamation Cost Accretion 27.5 Sustaining Capital Expenditure 320.6 All-in Sustaining Cash Costs 3,162.6 Gold Sales 7,067 All-in Sustaining Cash Costs per Ounce US$448/ounce (1) Source: Feasibility Study and Technical Report Update on the Brucejack Project, dated June 19, 2014. (2) Net of silver credits at Base Case silver price of $US17/ounce.
  • 11.
  • 12.
    12 VALLEY OF THEKINGS: STOCKWORK S N Cleo West Drift 615L West Raise Domain 20 ~0.5 m
  • 13.
  • 14.
  • 15.
  • 16.
  • 17.
  • 18.
    18 LIFE OF MINEPLAN Oblique view facing west Valley of the Kings West Zone Portals
  • 19.
    19 MINING METRICS (1) 30 m level spacing  Maximum of 45 m stope lengths  15 m widths  Dilution Factors – Primary Stopes: 7% – Secondary Stopes: 15%  Mining Recovery Factors – Primary Stopes: 97.5% – Secondary Stopes: 92.5%  Average 12 stopes in the mining and backfill cycle at any time (1) See Feasibility Study and Technical Report Update on the Brucejack Project, dated June 19, 2014
  • 20.
    20 SITE LAYOUT Portals Mill Camp Development Rock DisposalLaydown & Fuel Storage Substation West Zone Portal Truck Shop
  • 21.
  • 22.
    22  Gold andsilver recoveries of 96.7% and 90.0% over mine life  Gravity (43.3% LOM) and flotation ( 53.4% LOM) concentration  Producing doré and gold/silver concentrate  Bulk sample processing with single stage gravity and flotation concentration yielded gold recoveries averaging 98% PROCESSING Bulk sample gravity concentrate at Contact Mill, Montana Bulk sample flotation concentrate at Contact Mill, Montana
  • 23.
    23 PERMITTING PROCESS Scope and Process determined 1stPublic Comment Period Application Submitted Application evaluated for completeness Application review, 2nd Public Comment Period Assessment Report Referral to Ministers January 2013 Five Open Houses in November 2013 (Submitted June 20, 2014) (Completed July 24, 2014) 180-day review started August 13, 2014 Project Description Filed Project Decision by Ministers (Decision 45 days)  BC Environmental Assessment Office (EAO) manages it  Federal review coordinated by Federal Environmental Assessment Agency (CEAA) for relevant areas  Provincial and Federal reviews are coordinated For more information on assessment process: www.eao.gov.bc.ca/ea_process.html (Anticipate H1 2015)
  • 24.
    24 COMMUNITY ENGAGEMENT  Commercialrelationships with local First Nations during the exploration phase at Brucejack have been mutually successful  Examples of Brucejack Project contracts with First Nation development corporations include camp construction, access road maintenance, waste rock disposal  The proposed mine will provide approximately 800 jobs during construction and 500 jobs during operations  We will continue to extend both commercial contract and employment opportunities to locals whenever possible
  • 25.
    25 NEAREST FISH 20KMAWAY CASCADE BRUCEJACK PROJECT BRUCEJACK LAKE (not fish habitat)
  • 26.
    26 FINANCING THE BRUCEJACKPROJECT  Various proposals in addition to equity have been brought to us, including: royalty, forward sale, high- yield debt, convertible notes, gold-linked bonds, project debt, streaming  All options will be considered to maximize return  Anticipate financing plan to be finalized in Q4
  • 27.
    27 THE NEXT 12MONTHS: 2014/H2  Updated Feasibility Study  Filed Environmental Assessment Certificate application and Environmental Impact Study  In-fill drill program underway  Retain EPCM contractor  Basic and detailed engineering  Financing plan  Potential production of additional 1,000 tonnes of high-grade ore 2015/H1  Anticipate receiving permits  Production decision  Start construction
  • 28.
    28 HIGH-GRADE GOLD WITHSIZE Data source: Companies Valley of the Kings reserves based on Feasibility Study and Technical Report Update on the Brucejack Project, dated June 19, 2014 Kirkland Lake Mine (Kirkland Lake) Kensington (Coeur) Casa Berardi (Hecla) El Penon (Yamana) Red Lake (Goldcorp) Pogo Mine (Sumitomo) Valley of the Kings Cerro Negro (Goldcorp)Eleonore (Goldcorp) 0.0 2.0 4.0 6.0 8.0 10.0 12.0 14.0 16.0 0.0 1.0 2.0 3.0 4.0 5.0 6.0 7.0 8.0 Proven+ProbableGoldGrade(g/t) Proven + Probable Gold Reserves (mm oz)
  • 29.
    29 PRETIVM MANAGEMENT Robert Quartermain,B.Sc., M.Sc., P.Geo, D.Sc. President & Chief Executive Officer, Director Joseph Ovsenek, B.A. Sc., P.Eng., LLB Executive Vice President & Chief Development Officer, Director Ken McNaughton, M.A. Sc., P.Eng. Vice President & Chief Exploration Officer Ian I Chang, M.A. Sc., P.Eng. Vice President, Project Development Michelle Romero, B.A., M.L.S. Vice President, Corporate Relations Kevin Torpy, B.Sc. Director, Operations Warwick Board, Ph.D., P.Geo. Chief Geologist Max Holtby, B.Sc., P. Geo. Director, Permitting James A Currie, P.Eng. Vice President & Chief Operating Officer Peter de Visser, CA Chief Financial Officer
  • 30.
    30 SHAREHOLDING & ANALYSTCOVERAGE (1) As of Aug 15, 2014; ownership calculated on an undiluted basis. (2) As of Aug 19, 2014. Source: IPREO, SEDI (3) See News Releases dated July 29, 2014 & Aug 15, 2014 Top Shareholders(2) (shares in millions) Silver Standard Resources 17.320 Liberty Metals & Mining 7,346 Aristeia Capital, LLC 5.322 Royce & Associates 4.551 Sun Valley Gold, LLC 3.361 Robert Quartermain 2.808 Franklin Advisors, Inc. 2.469 Norges Bank Investment TD Asset Management 2.457 1.934 Sprott Asset Management 1.851 Weiss Asset Management 1.837 Analyst Coverage BMO John Hayes CIBC Jeff Killeen Citibank Alex Hacking Cormark Securities Richard Gray Cowen Securities Adam Graf GMP Securities George Albino H.C. Wainwright Jeff Wright RBC Dan Rollins Roth Capital Partners Joseph Reagor Salman Partners Ash Guglani Scotiabank Ovais Habib Capital Structure(1) Public Float 99.5 Silver Standard Shares 17.3 Total Issued & Outstanding Shares 116.8 Incentive Options 10.4 Total Fully Diluted Shares 127.2 Market Cap (at Aug. 22, 2014) C$875 million Working Capital (at June 30, 2014) C$22.7 million (shares in millions) Silver Standard, 15 % Institutions, 52% Management, 4% Retail, 30% Gross Proceeds of Share Offering(3) US$60.5 million
  • 31.
    31 APPENDIX: 2013 RESOURCEESTIMATE Valley of the Kings Mineral Resource estimate - December 2013(1),(4) (Based on a cut-off grade of 5.0 grams of gold-equivalent/tonne(5)) Category Tonnes (millions) Gold (g/t) Silver (g/t) Contained(3) Gold (million oz) Silver (million oz) Measured 2.0 19.3 14.4 1.2 0.9 Indicated 13.4 17.4 14.3 7.5 6.1 M & I 15.3 17.6 14.3 8.7 7.0 Inferred(2) 5.9 25.6 20.6 4.9 3.9 (1) Mineral Resources which are not Mineral Reserves do not have demonstrated economic viability. The estimate of Mineral Resources may be materially affected by environmental, permitting, legal, marketing, or other relevant issues. The Mineral Resources in this news release were estimated using the Canadian Institute of Mining, Metallurgy and Petroleum (CIM), CIM Standards on Mineral Resources and Reserves, Definitions and Guidelines prepared by the CIM Standing Committee on Reserve Definitions and adopted by CIM Council. (2) The quantity and grade of reported Inferred resources in this estimation are uncertain in nature and there has been insufficient exploration to define these Inferred Resources as an Indicated or Measured Mineral Resource and it is uncertain if further exploration will result in upgrading them to an Indicated or Measured Mineral Resource category. (3) Contained metal figures and totals may differ due to rounding of figures. (4) The Mineral Resource estimate stated in Table 1 is defined using 10 m by 10 m by 10 m blocks in the in Valley of the Kings. (5) The gold equivalent value is defined as AuEq = Au + Ag/53. (6) See Brucejack Project Mineral Resources Update Technical Report dated December 19, 2013.  The updated Valley of the Kings Resource estimate announced in December(6) added Measured gold Resources and increased gold grade:
  • 32.
    32 APPENDIX: 2013 RESOURCEMODEL – VALLEY OF THE KINGS 5-10 10-20 20-60 >60 Key (g/t Au) December 2013 Mineral Resource Measured and Indicated Blocks >5g/t Au. Blocks are 10m x 10m x 10m 100 m N
  • 33.
    33 APPENDIX: 2013 UNDERGROUNDDRILLING Fragmental Volcanic Rocks Polylithic Conglomerate Volcanic Sediment 50 m N Completed Underground Development Completed Bulk Sample Legend >20 Key (g/t Au) Assay intervals 5.0-20.0 2.5-5.0 Silicified Conglomerate Volcanic Flows
  • 34.
    34 APPENDIX: VALLEY OFTHE KINGS M+I RESOURCE Northing (± 25 m) M+I Gold* (Oz.) 6258225 138,175 6258175 412,508 6258125 853,632 6258075 342,402 6258025 2,161,727 6257975 2,434,390 6257925 1,126,442 6257875 643,503 6257825 410,615 6257775 87,687 *Dec. 2013 M+I Mineral Resource; ≥5.0 g/t Au. 1.20 1.87 1.53 2.28 1.17 0.52 0.52 M+I Au* (Moz.) Surface projection of December 2013 Mineral Resource estimate, with total ounces per 100 m Easting and 50 m Northing strips
  • 35.
    35 10.93m @ 43.57ppm Au 0.5m @ 26.00 ppm Au N 2014 SURFACE DRILLING: PLAN VIEW <0.5 0.5-1.0 1.0-5.0 >20 5.0-20.0 Key (g/t Au) Assay intervals 200m Existing Underground Development SU-627 Latite Dykes (projected from 1345m) Latite Dykes (projected from 1345m) SU-628 SU-629 1.5m @ 19.05 ppm Au 0.5m @ 17.95 ppm Au SU-630 5m @ 17.34 ppm Au 1.5m @ 32.5 ppm Au 1m @ 11.35 ppm Au 0.5m @ 11.1 ppm Au
  • 36.
    36 EXPLORATION POTENTIAL ATDEPTH 10.93m @ 43.57 ppm Au 0.5m @ 26.00 ppm Au N S 200m <0.5 0.5-1.0 1.0-5.0 >20 5.0-20.0 Key (g/t Au) (Assay intervals) Fragmental Volcanic Rocks Polylithic Conglomerate Volcanic Flows Volcaniclastic Sediments Volcanic Flows 5-10 10-20 >20 Key (g/t Au) (Blocks) (M&I + Inferred) SU-627 Latite Dykes SU-630 SU-628 SU-629 1.5m @ 19.05 ppm Au 0.5m @ 17.95 ppm Au 5m @ 17.34 ppm Au 1.5m @ 32.5 ppm Au 1m @ 11.35 ppm Au 0.5m @ 11.1 ppm Au Section 426765E (500m wide)
  • 37.
    37 CONTACT: Phone: 604-558-1784 Fax: 604-558-4784 Toll-free:1-877-558-1784 invest@pretivm.com www.pretivm.com HEAD OFFICE: Pretium Resources Inc. 570 Granville St. Suite 1600 Vancouver, BC Canada V6C 3P1 COMMON SHARES: TSX/NYSE:PVG Issued: 116.8 million Fully diluted: 127.2 million 52-week hi/low: $10.67/$2.83 Market cap: $875 million (at Aug. 22, 2014) Advancing a major high-grade gold project in Canada 37