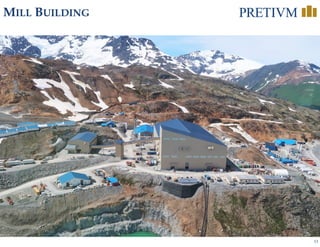
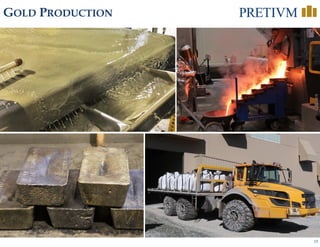
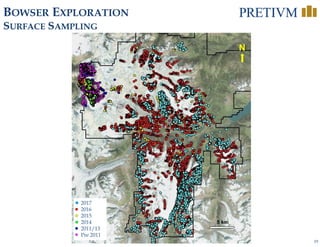
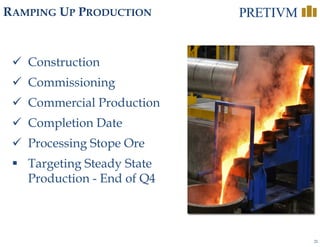
The document discusses Pretium Resources' Brucejack Mine in British Columbia, Canada. It provides details on:
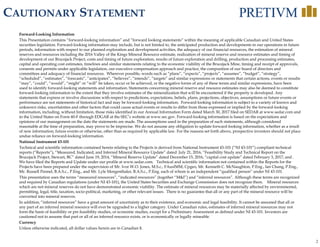
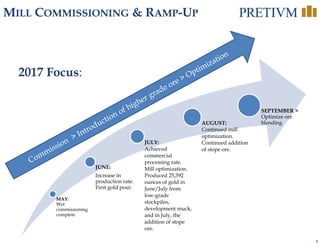
1) Ramping up production at the high-grade underground gold mine, with commercial production expected to be reached by the end of Q4 2017.
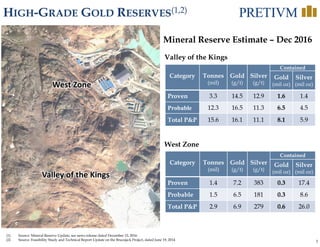
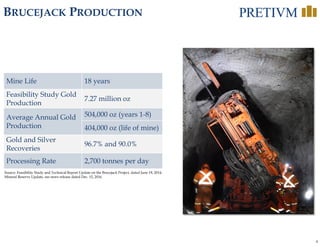
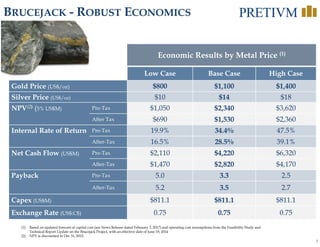
2) The mine has high-grade gold reserves and is expected to have a mine life of 18 years at an average annual production rate of 404,000 ounces of gold.
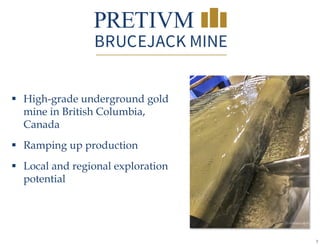
3) Exploration potential exists to expand reserves both near Brucejack and at the Bowser regional target located 5km away.