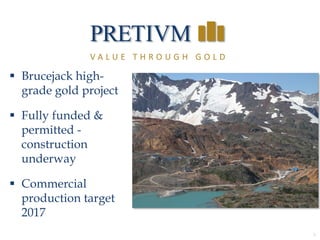
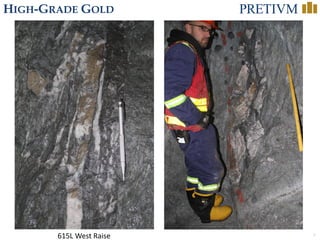
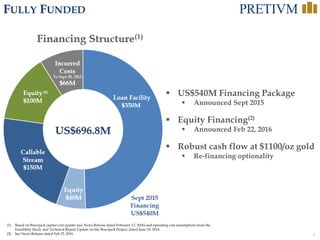
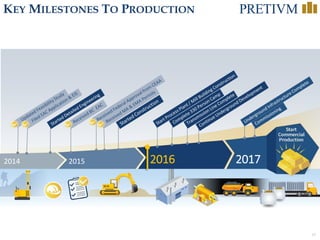
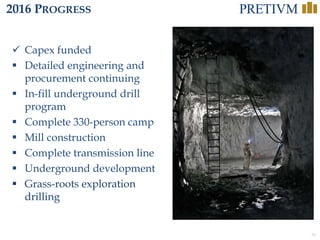
1. The Brucejack high-grade gold project in British Columbia is fully funded and permitted, with construction underway and commercial production targeted for 2017.
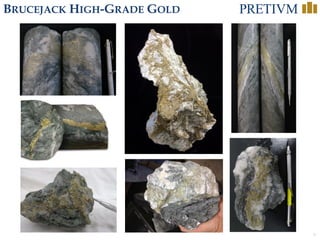
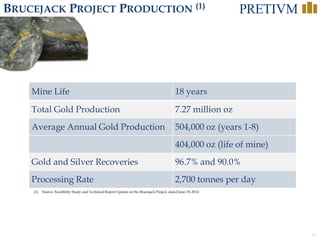
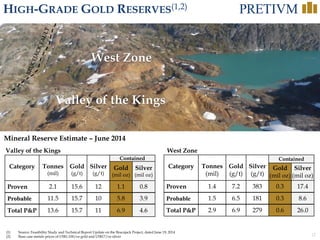
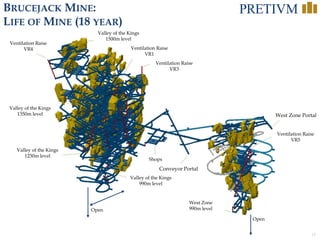
2. The project has high-grade reserves of 6.9 million ounces of gold and 4.6 million ounces of silver and is expected to produce an average of 404,000 ounces of gold per year over its 18-year mine life.
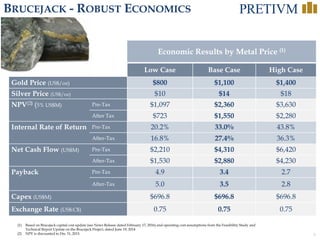
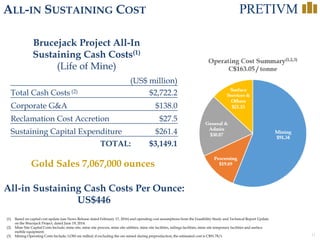
3. Economics are robust at a gold price of $1,100/oz, with an after-tax NPV of $1.55 billion and IRR of 27.4%, and all-in sustaining costs are estimated at $446/oz.