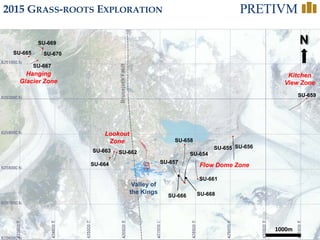
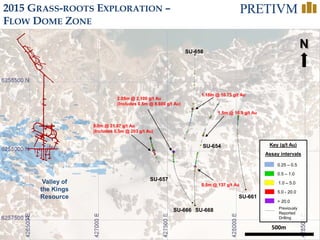
The document provides an overview of the Brucejack gold project located in British Columbia, Canada. Key points include:
- High-grade underground gold project with commercial production targeted for 2017.
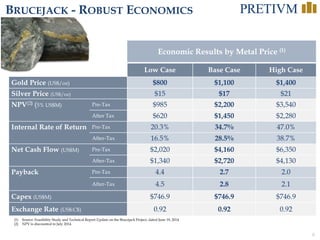
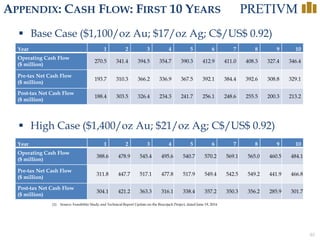
- Robust economics with after-tax NPV of $1.45 billion and IRR of 28.5% at $1,100/oz gold price.
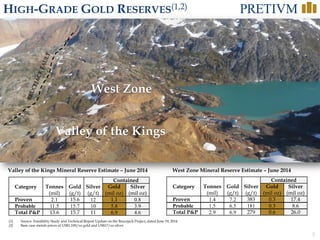
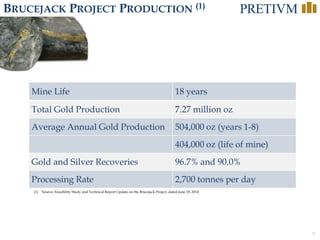
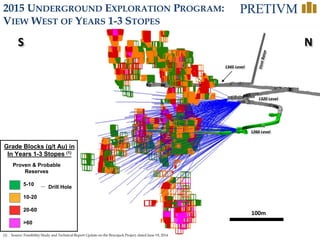
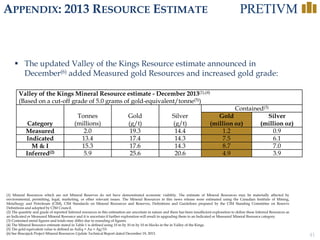
- Reserves of 6.9 million ounces of gold and 26 million ounces of silver with average annual production of 404,000 ounces over 18-year mine life.
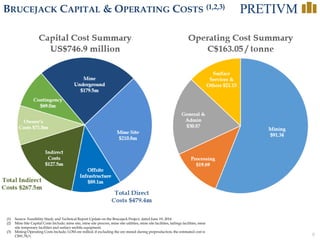
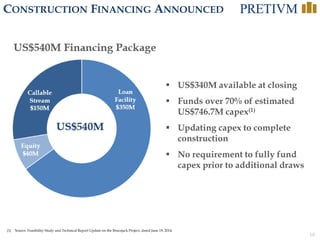
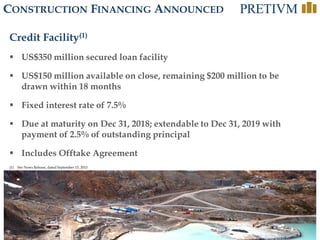
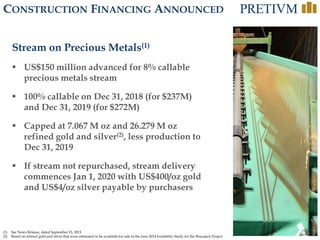
- $746 million construction financing package covers over 70% of estimated capital costs.
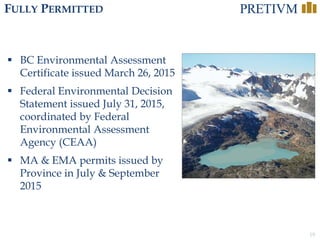
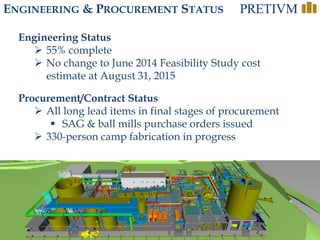
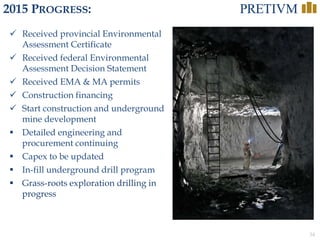
- Project is fully permitted and engineering is 55% complete with long lead items in procurement.