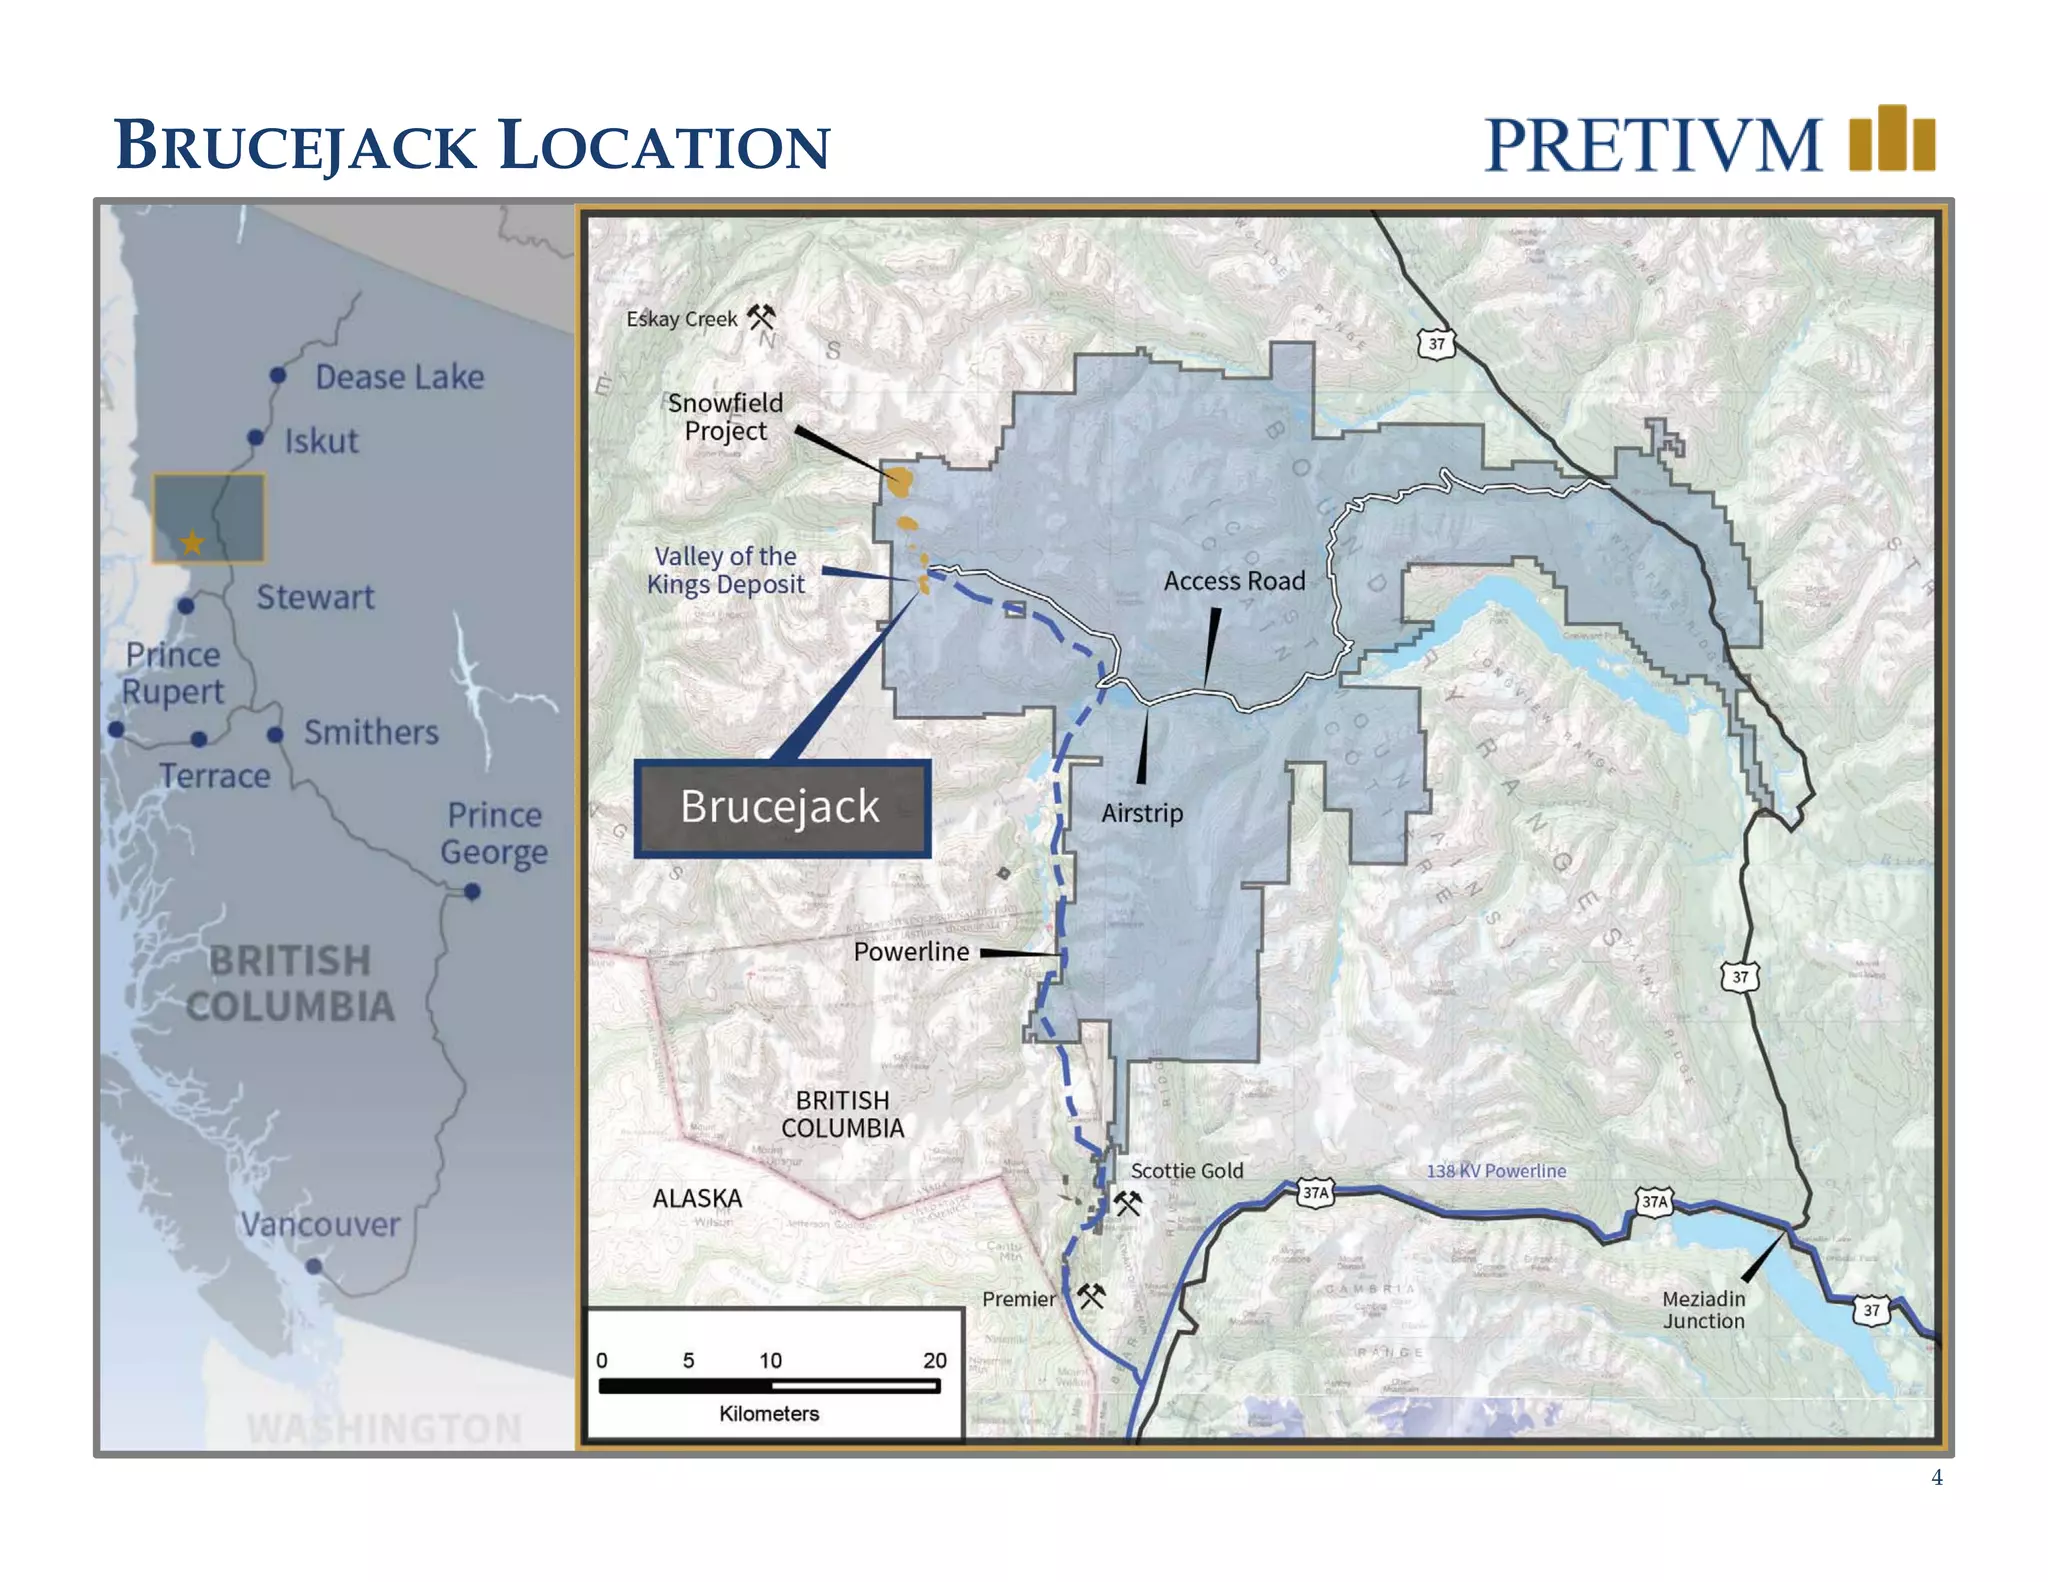
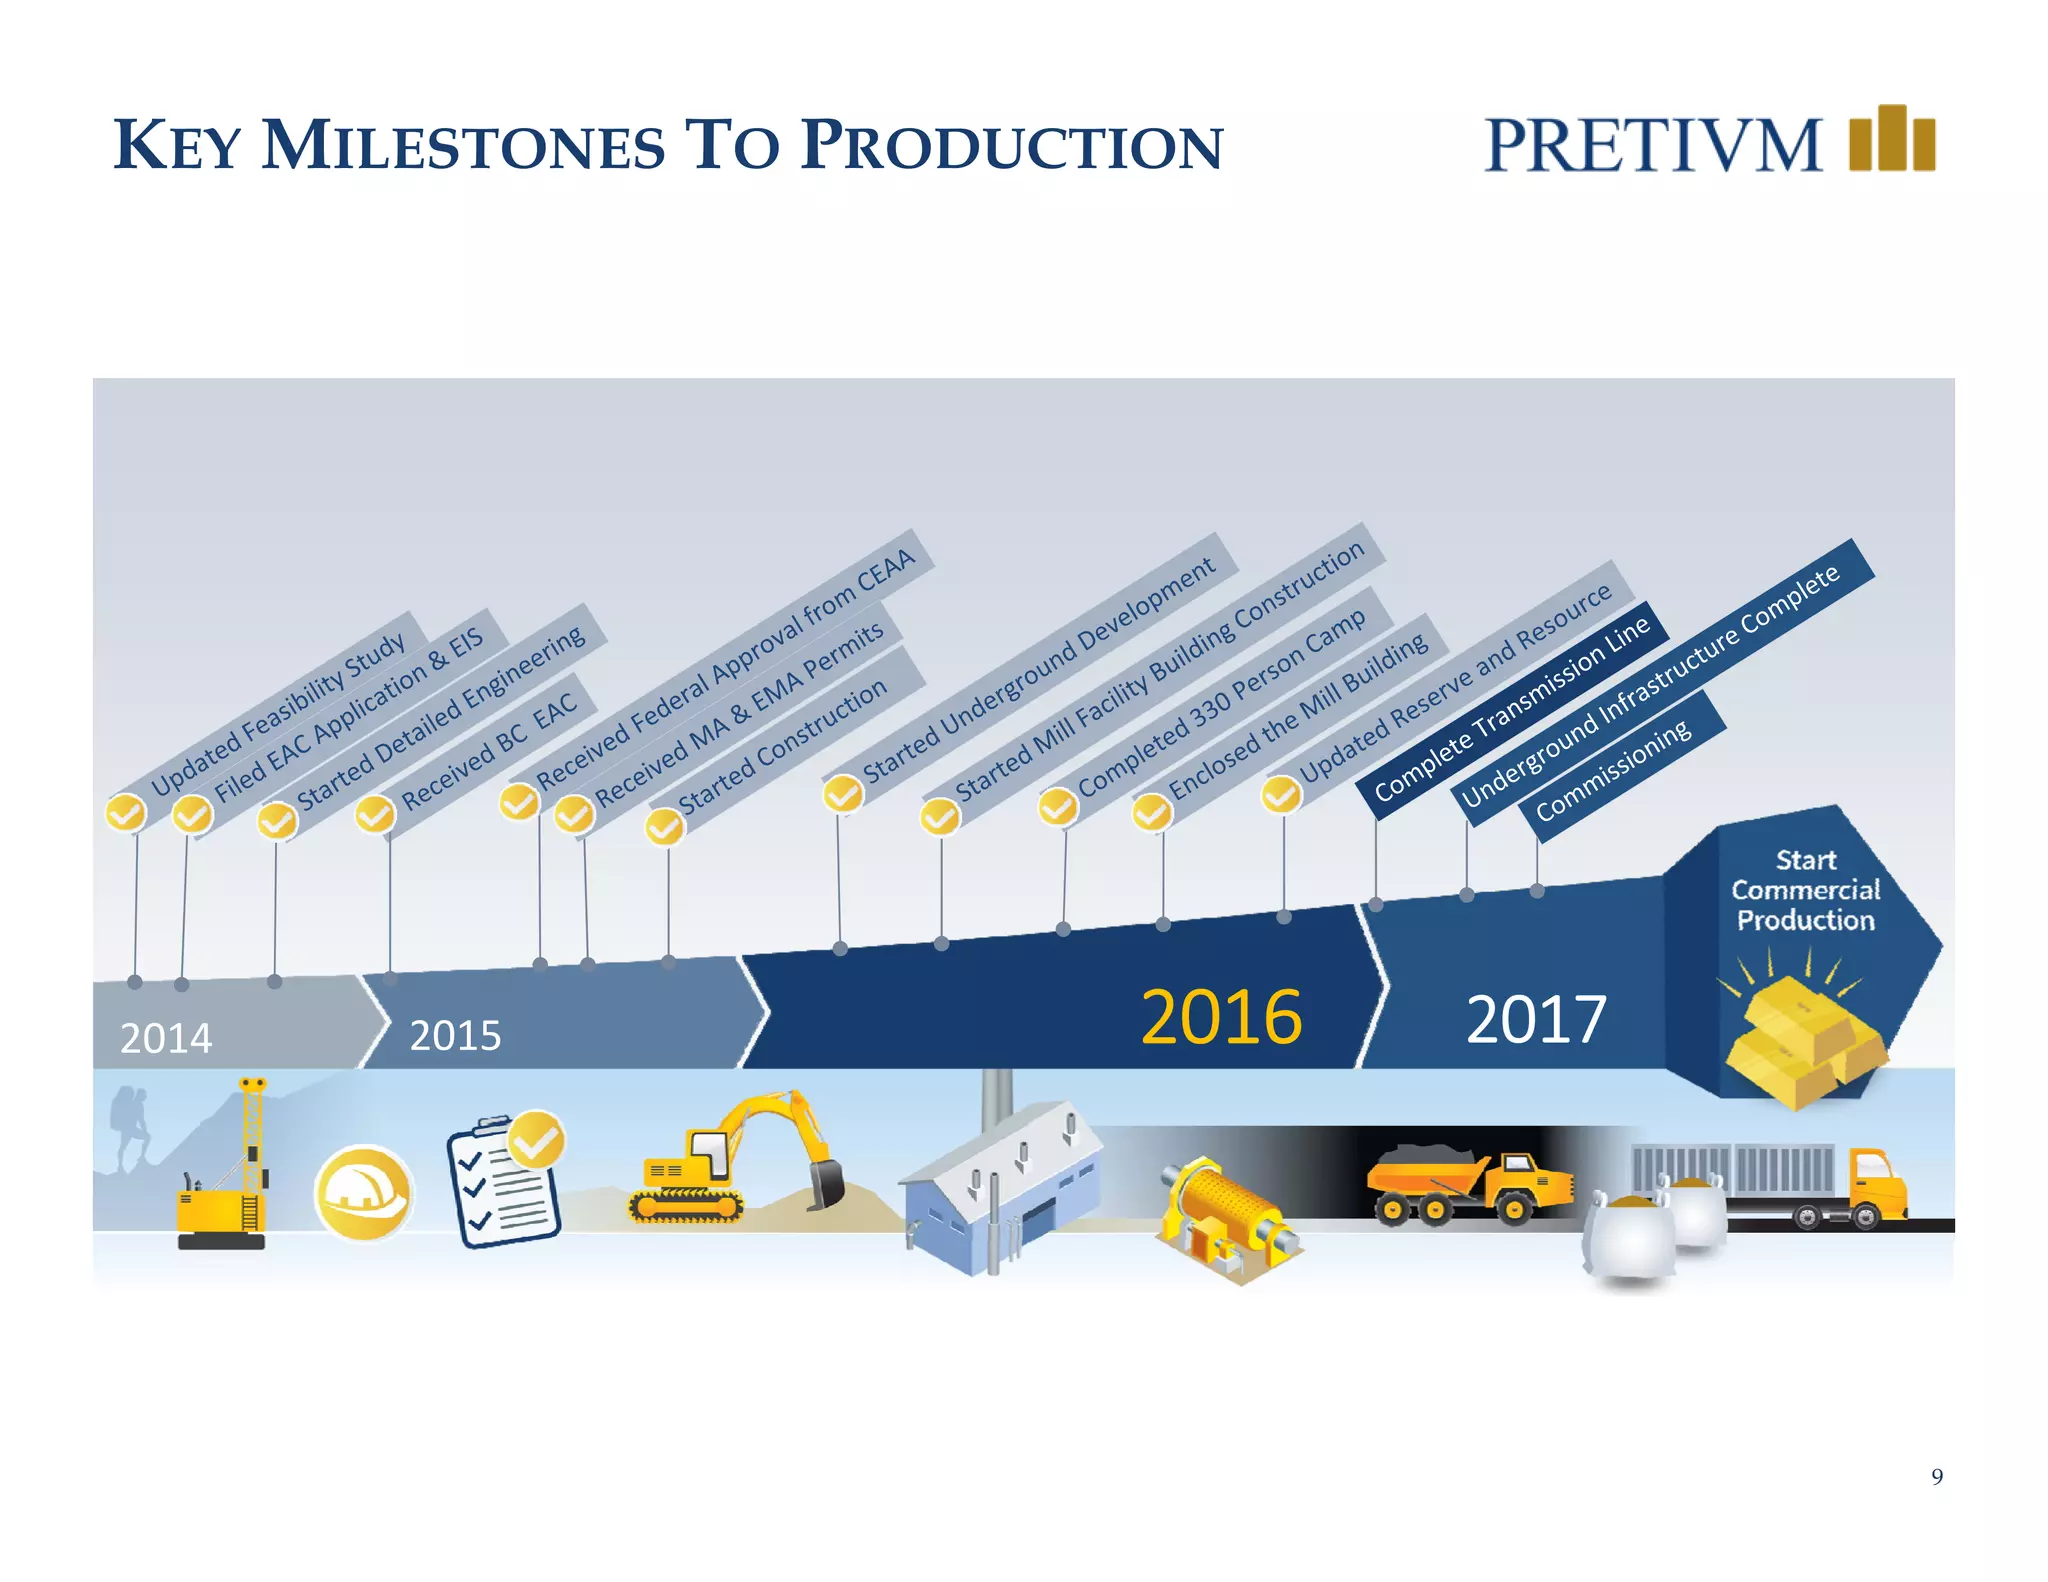
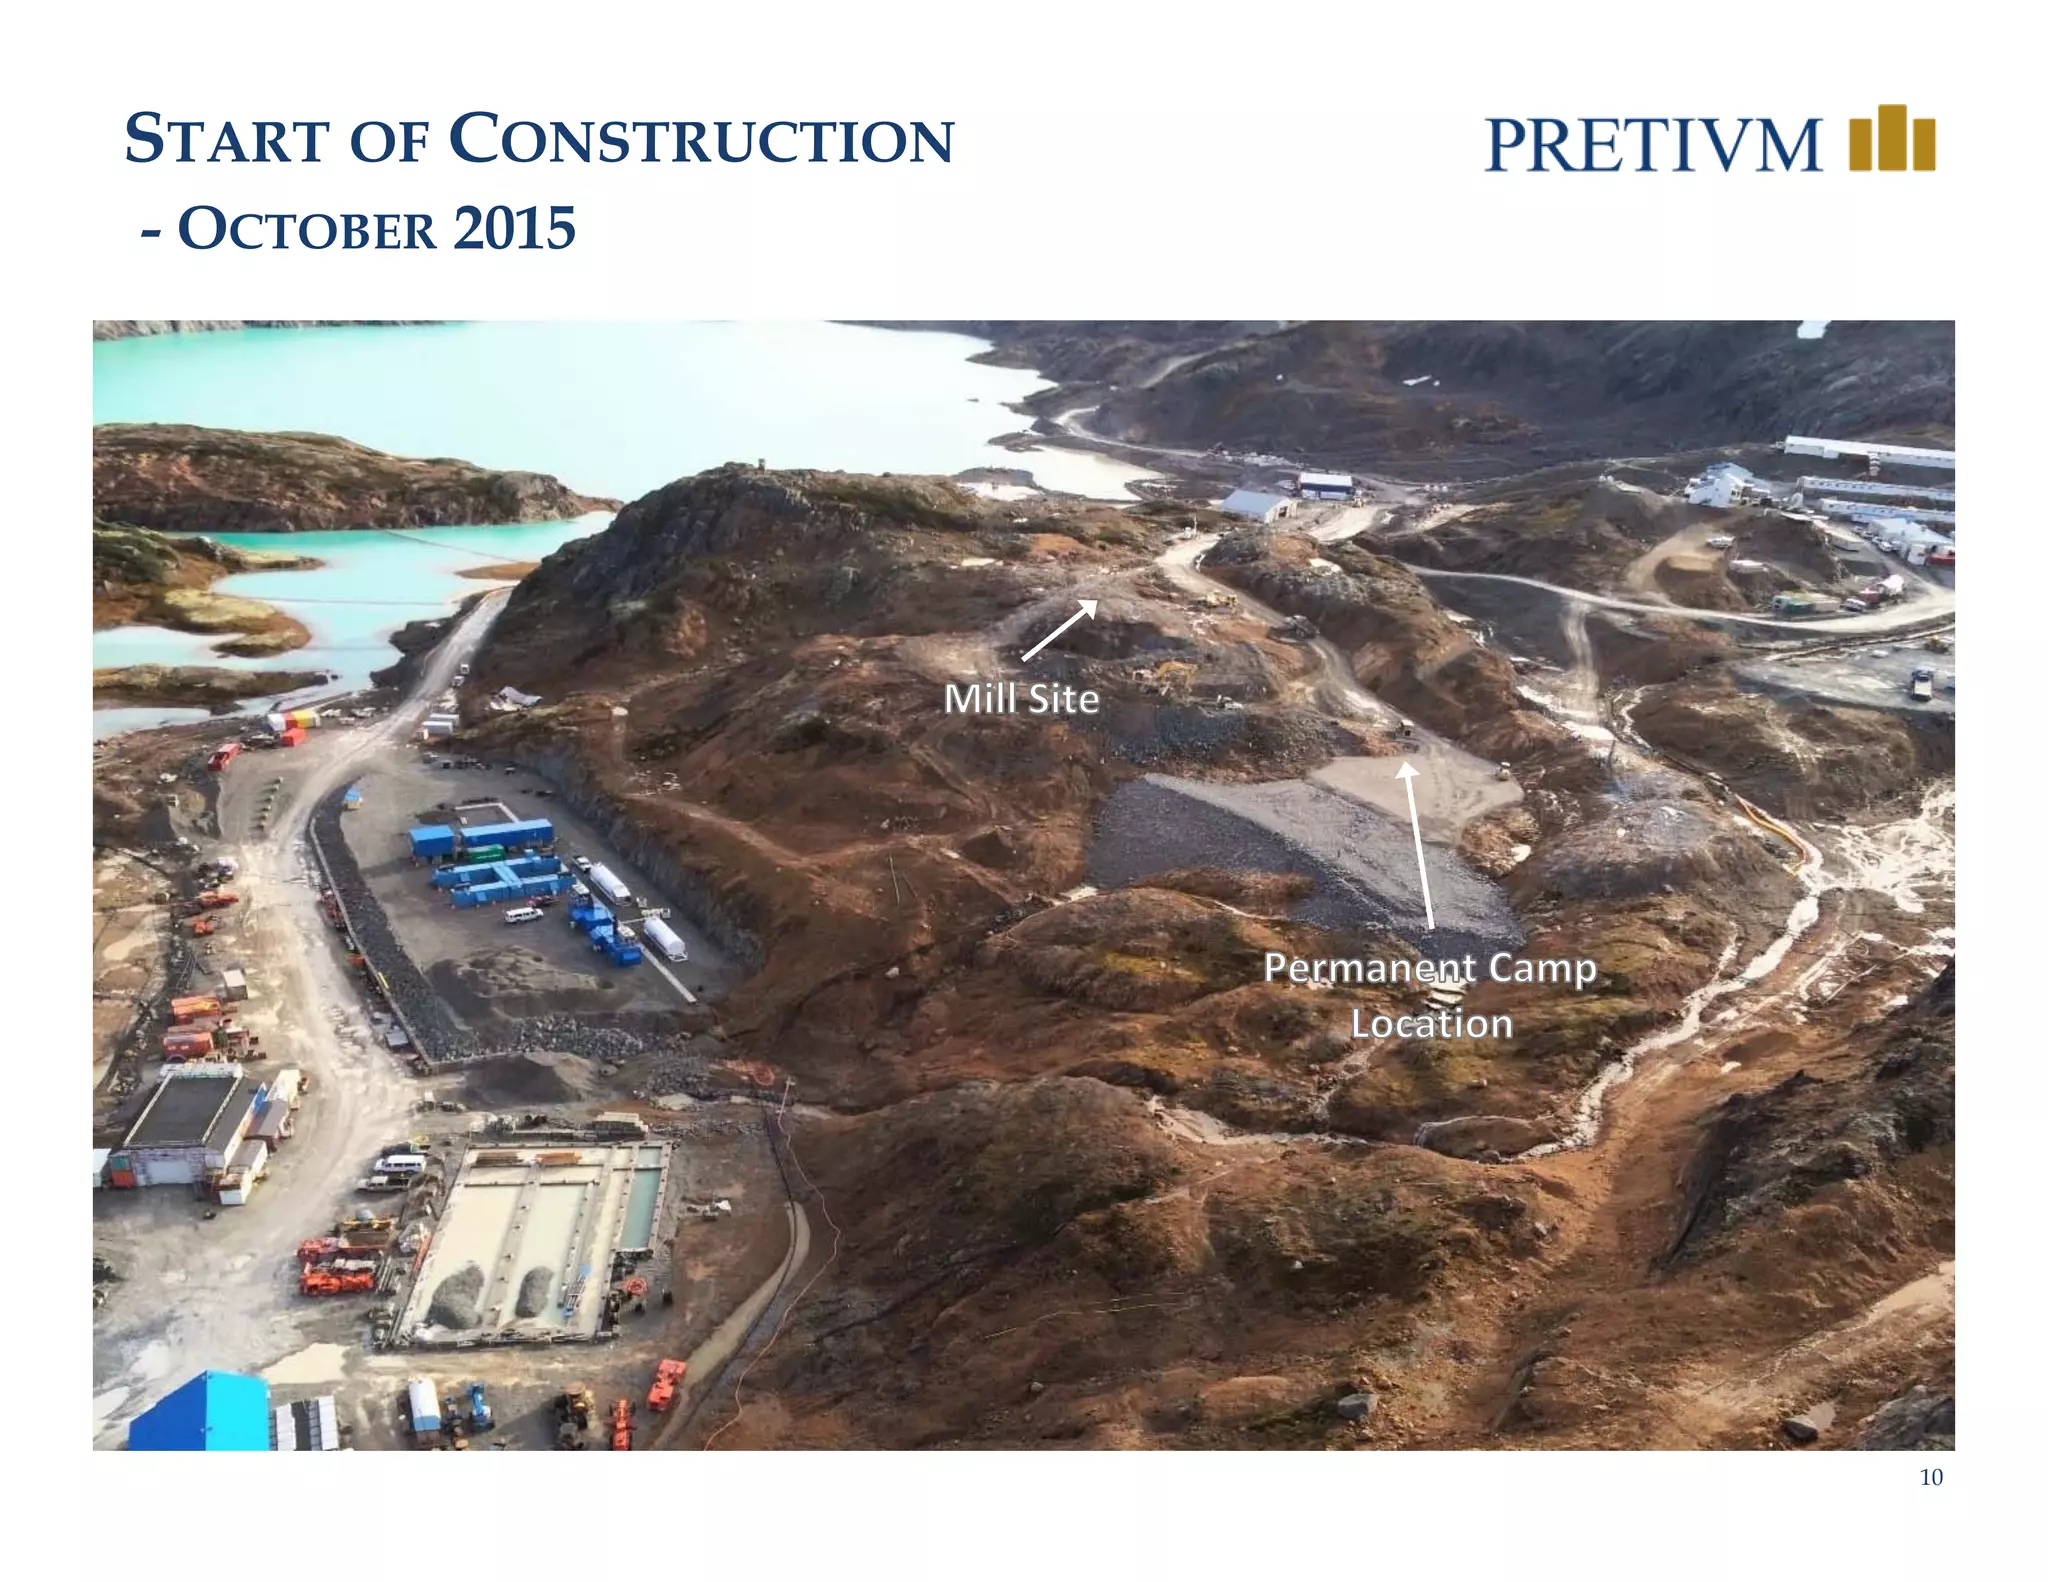
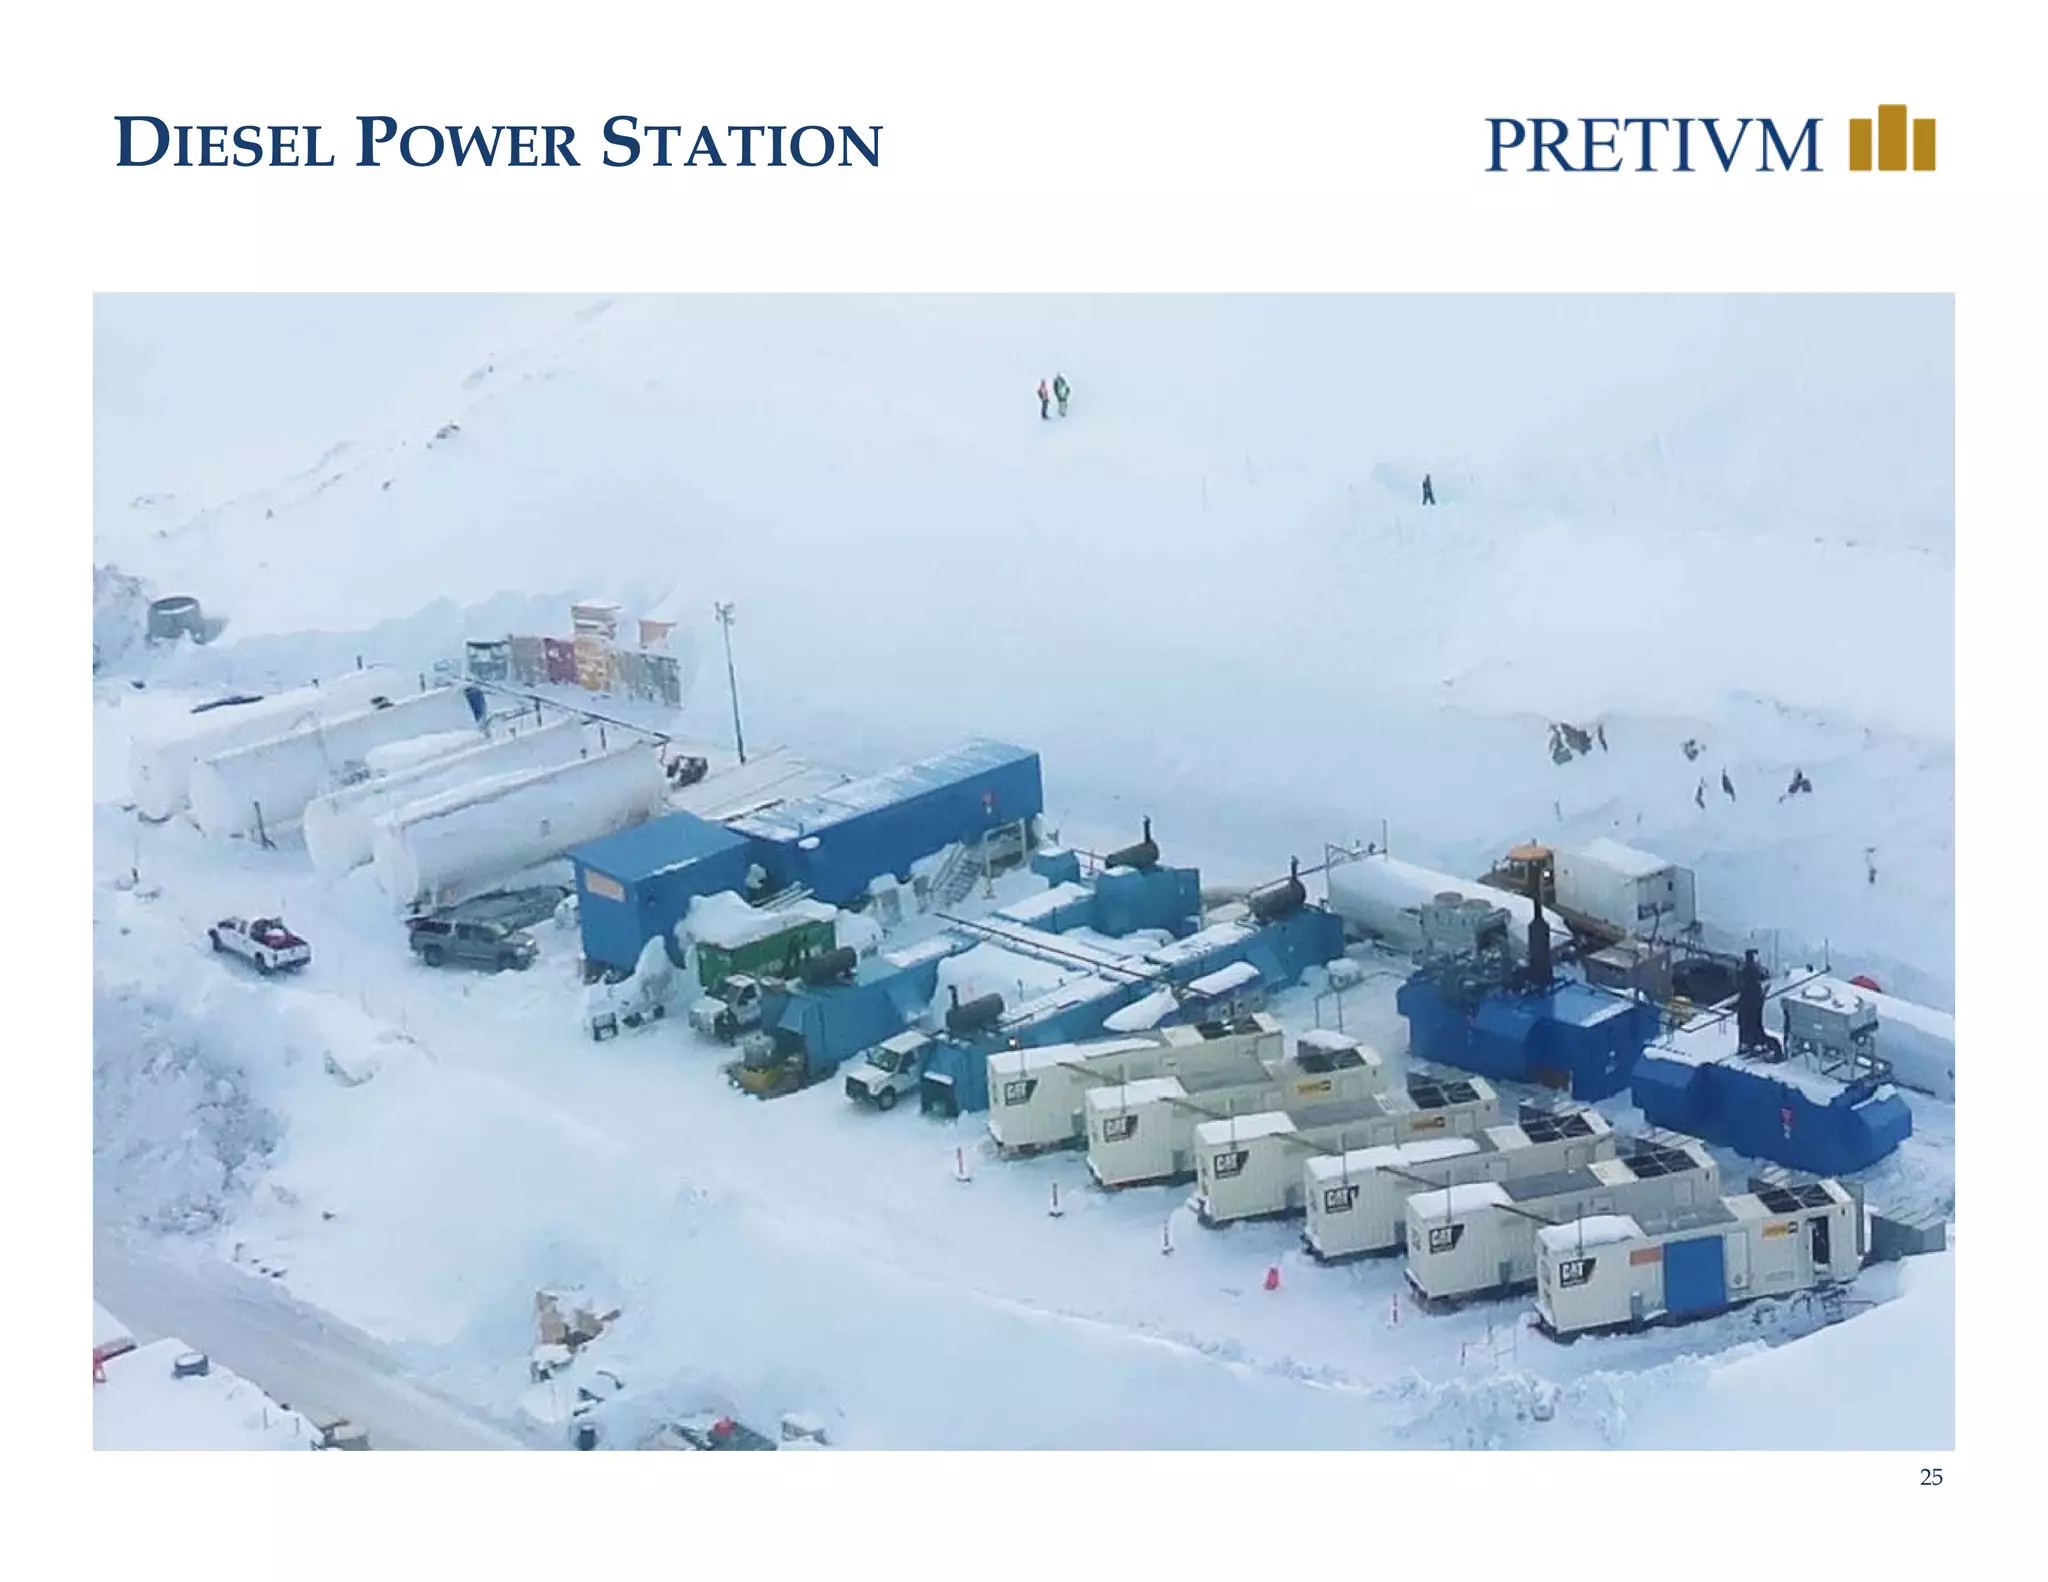
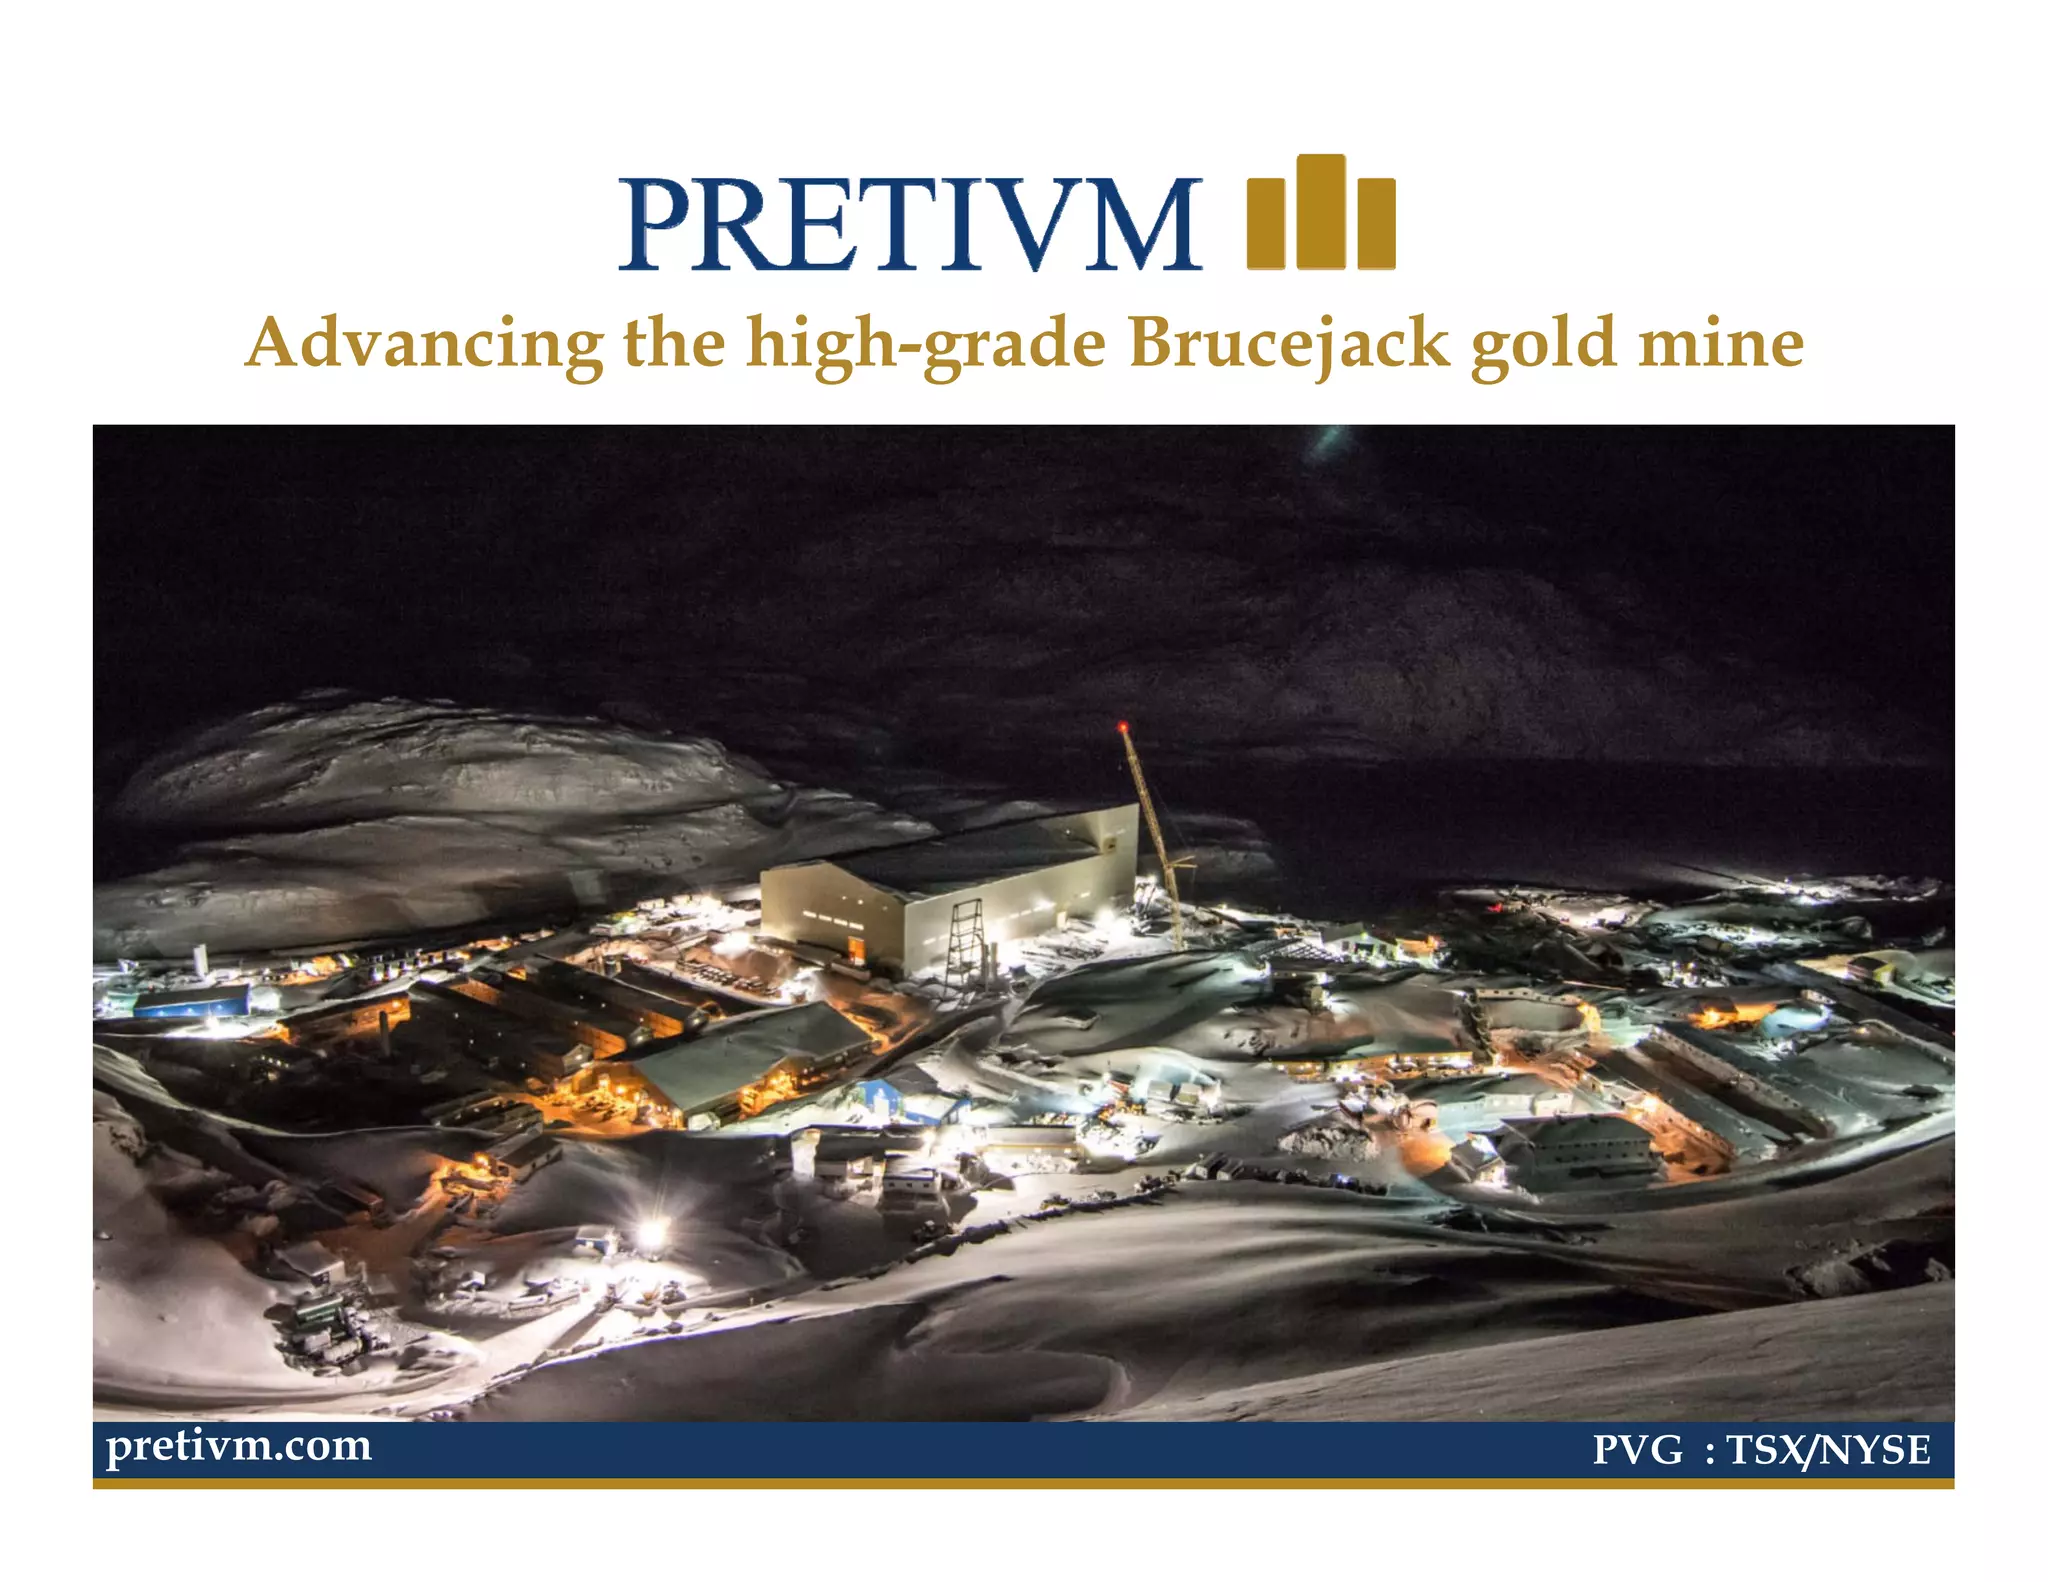
1) Pretivm Resources is advancing construction of its high-grade Brucejack gold mine in British Columbia, with commissioning targeted for early 2017.
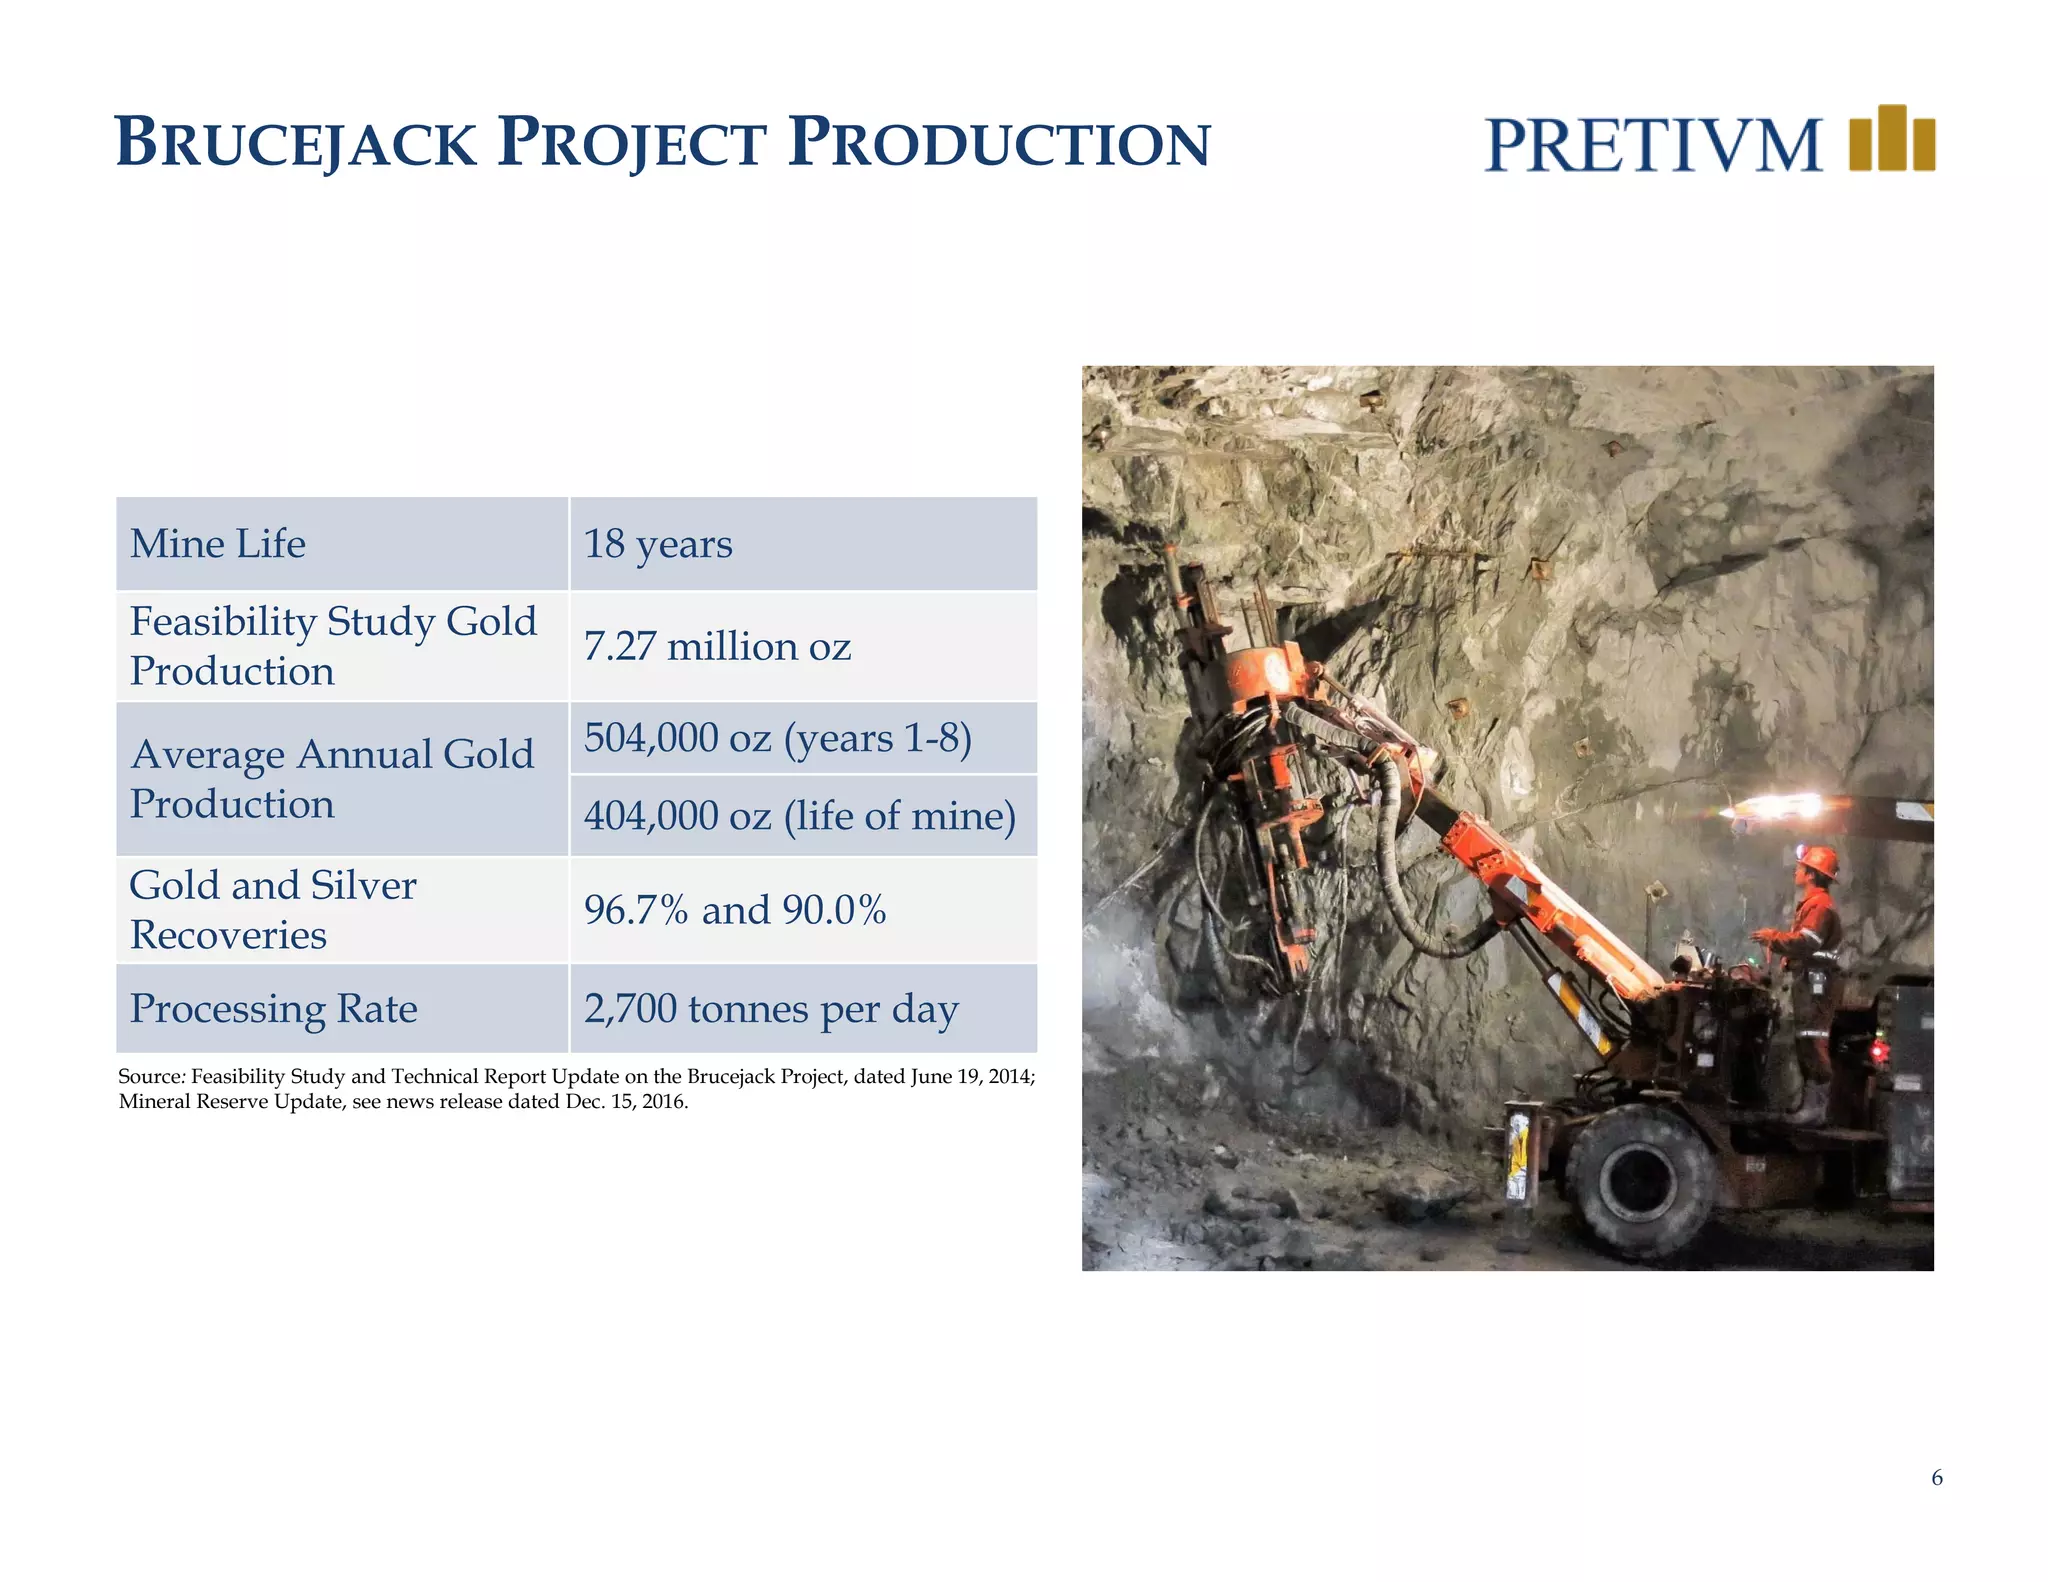
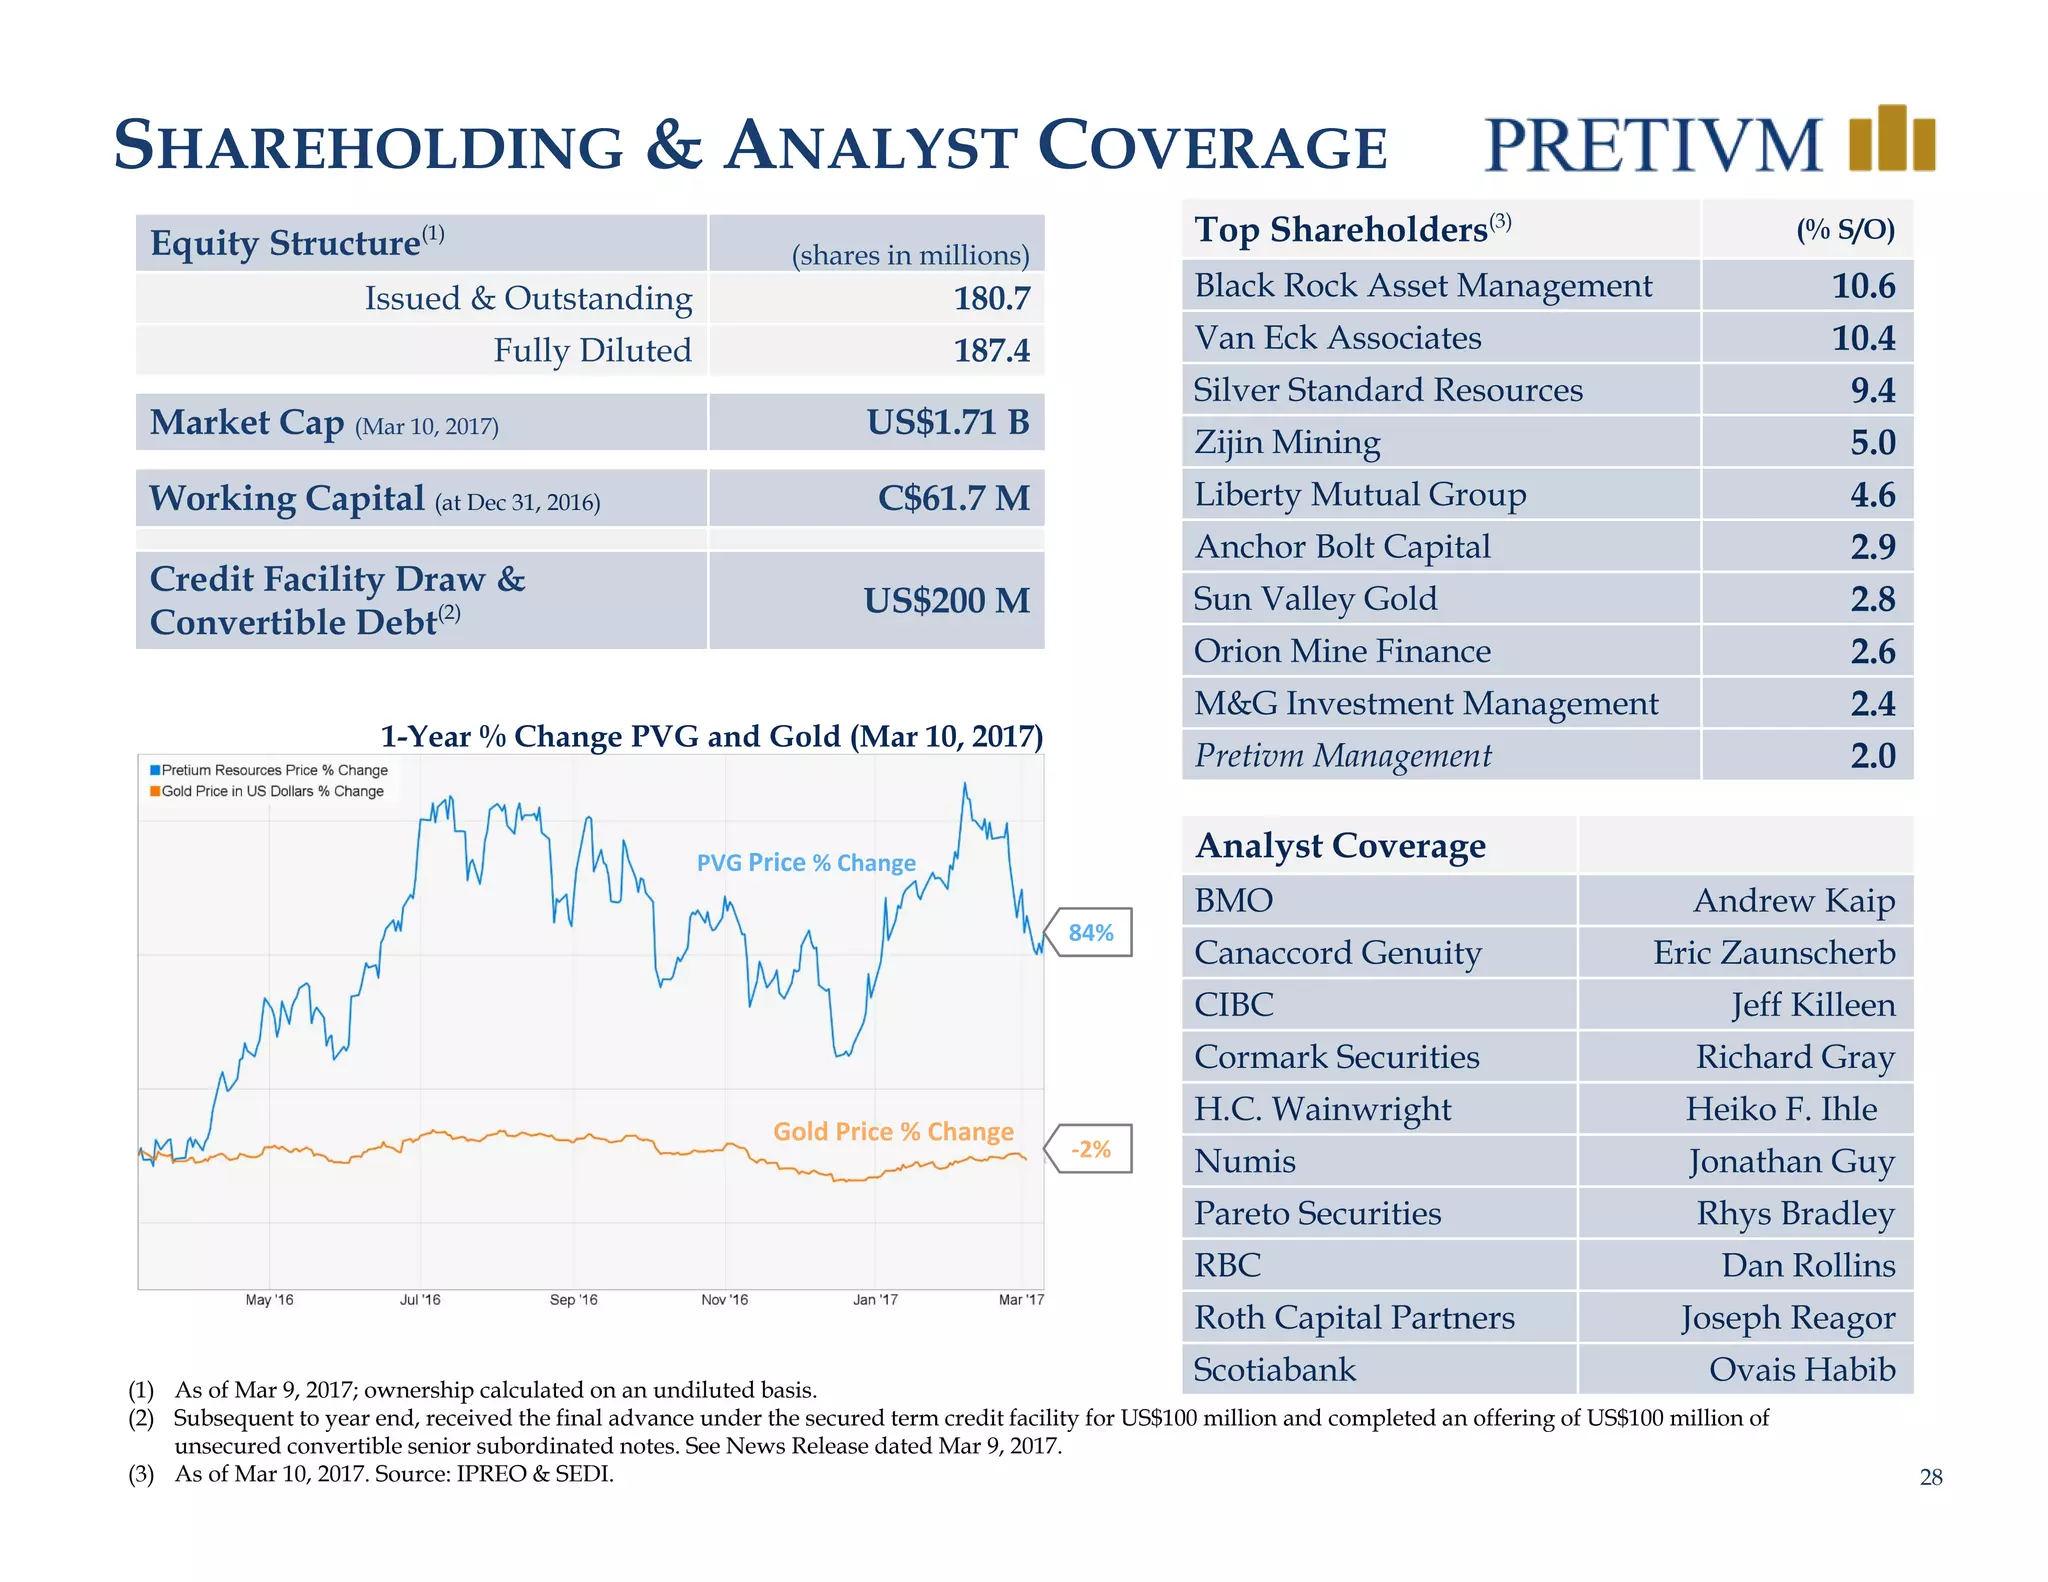
2) The mine is fully funded and expected to produce an average of 504,000 ounces of gold annually for the first eight years of its 18 year mine life at low all-in sustaining costs.
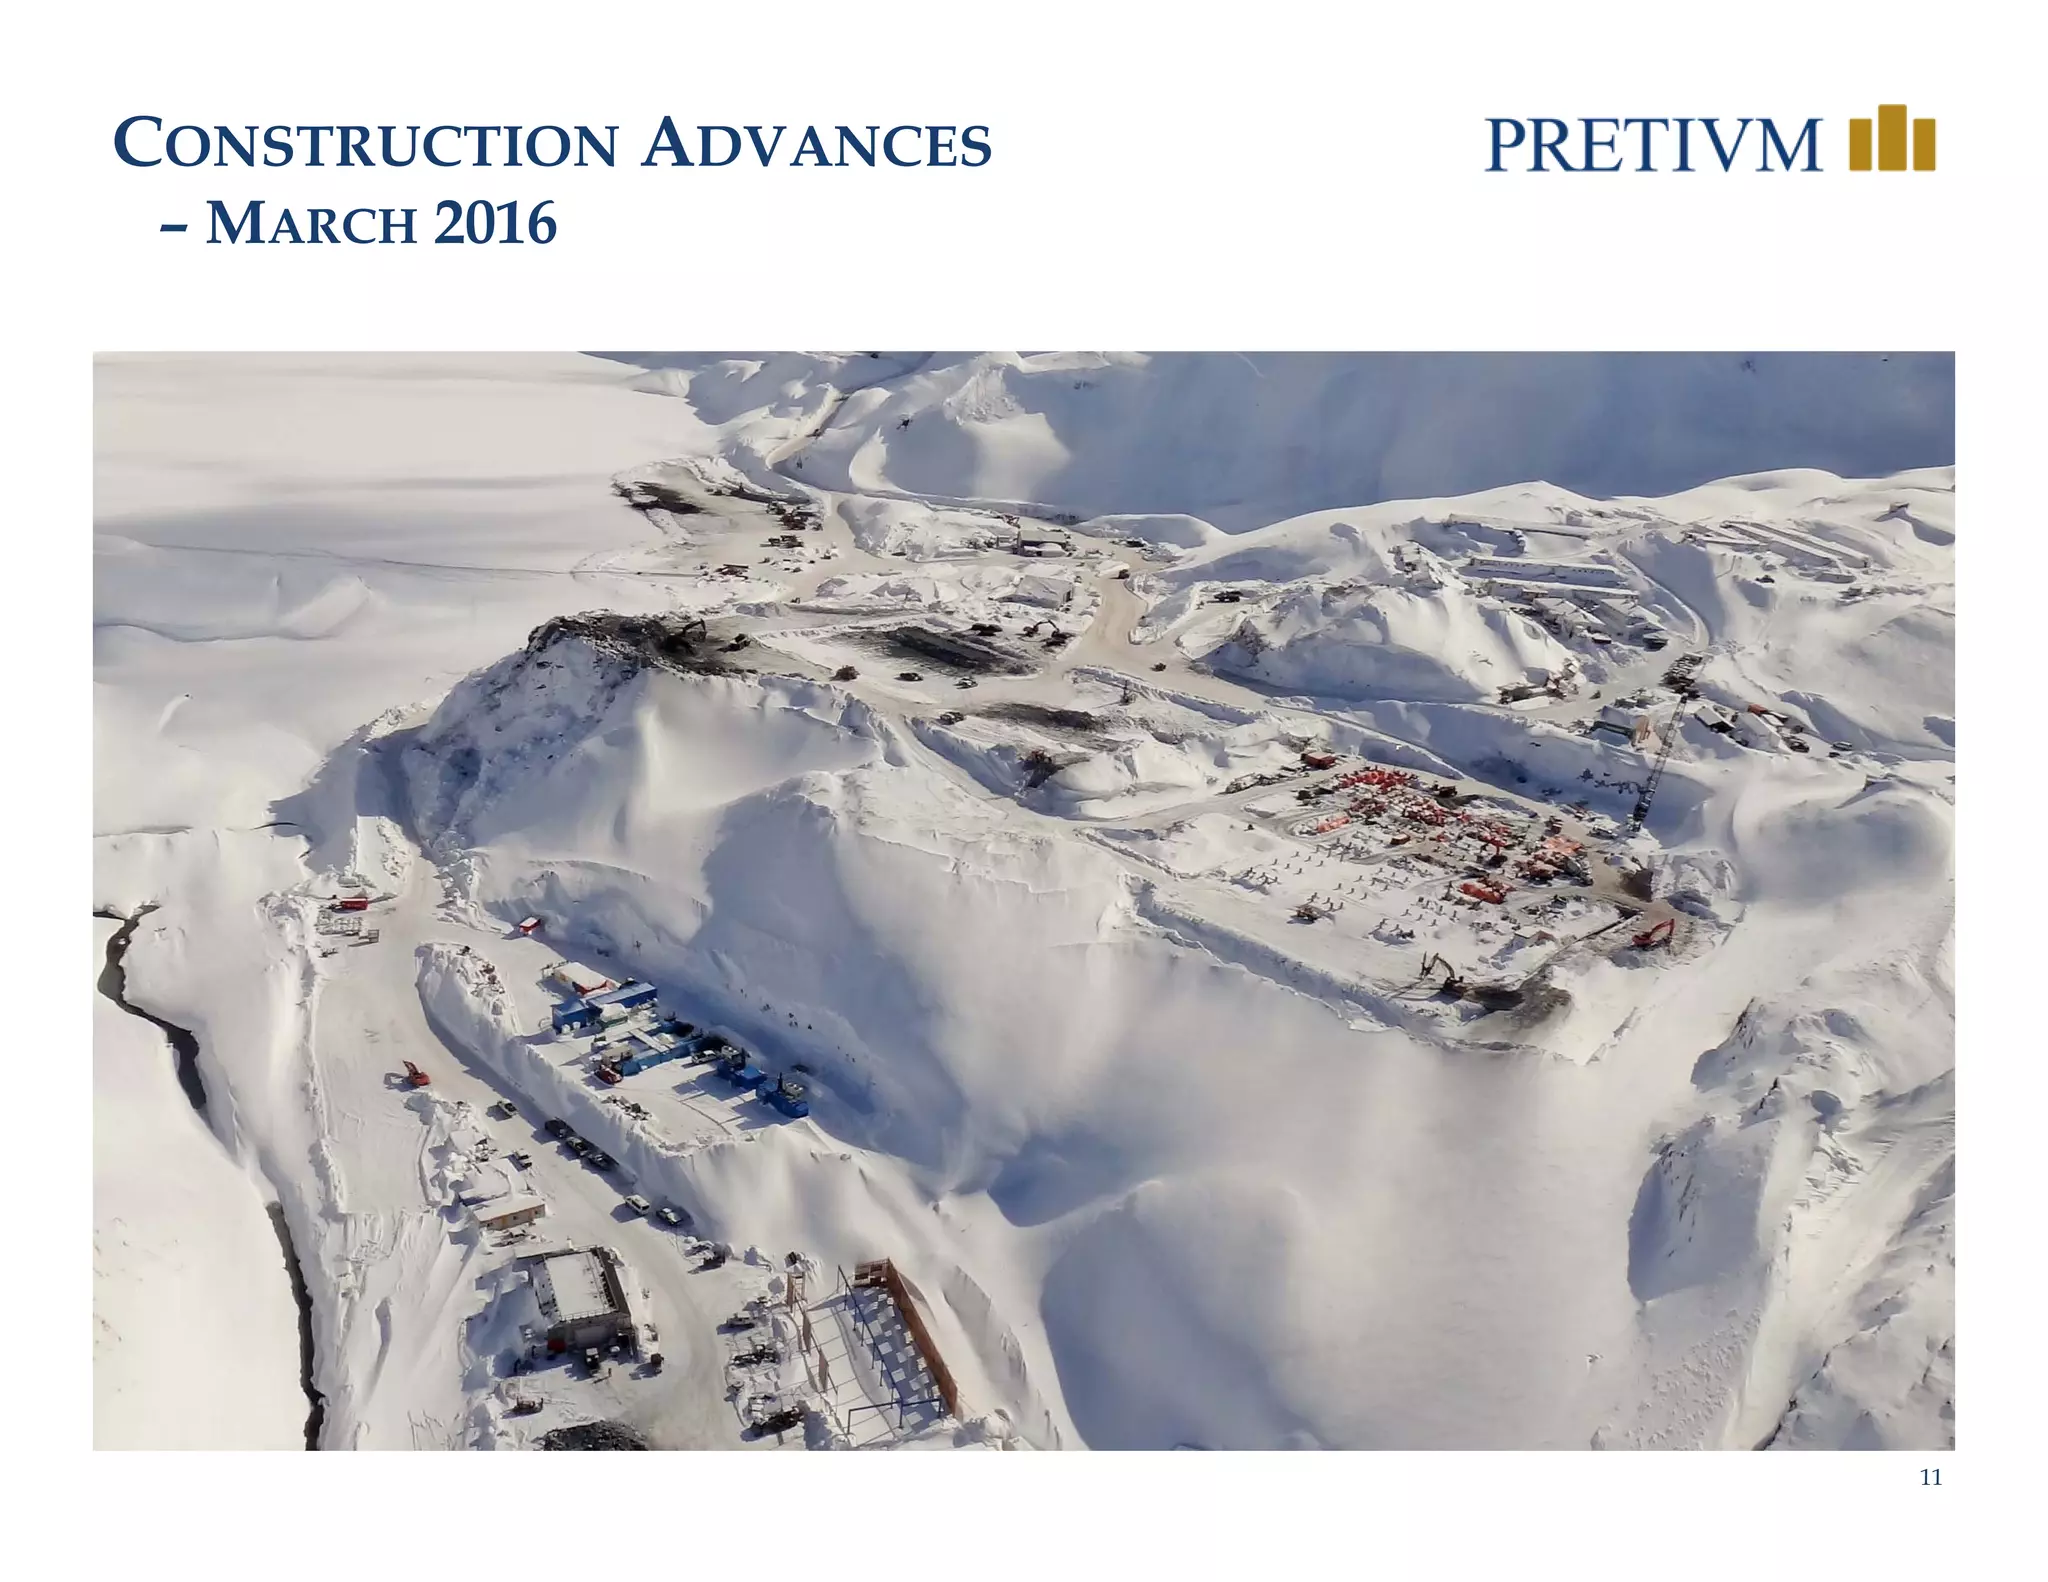
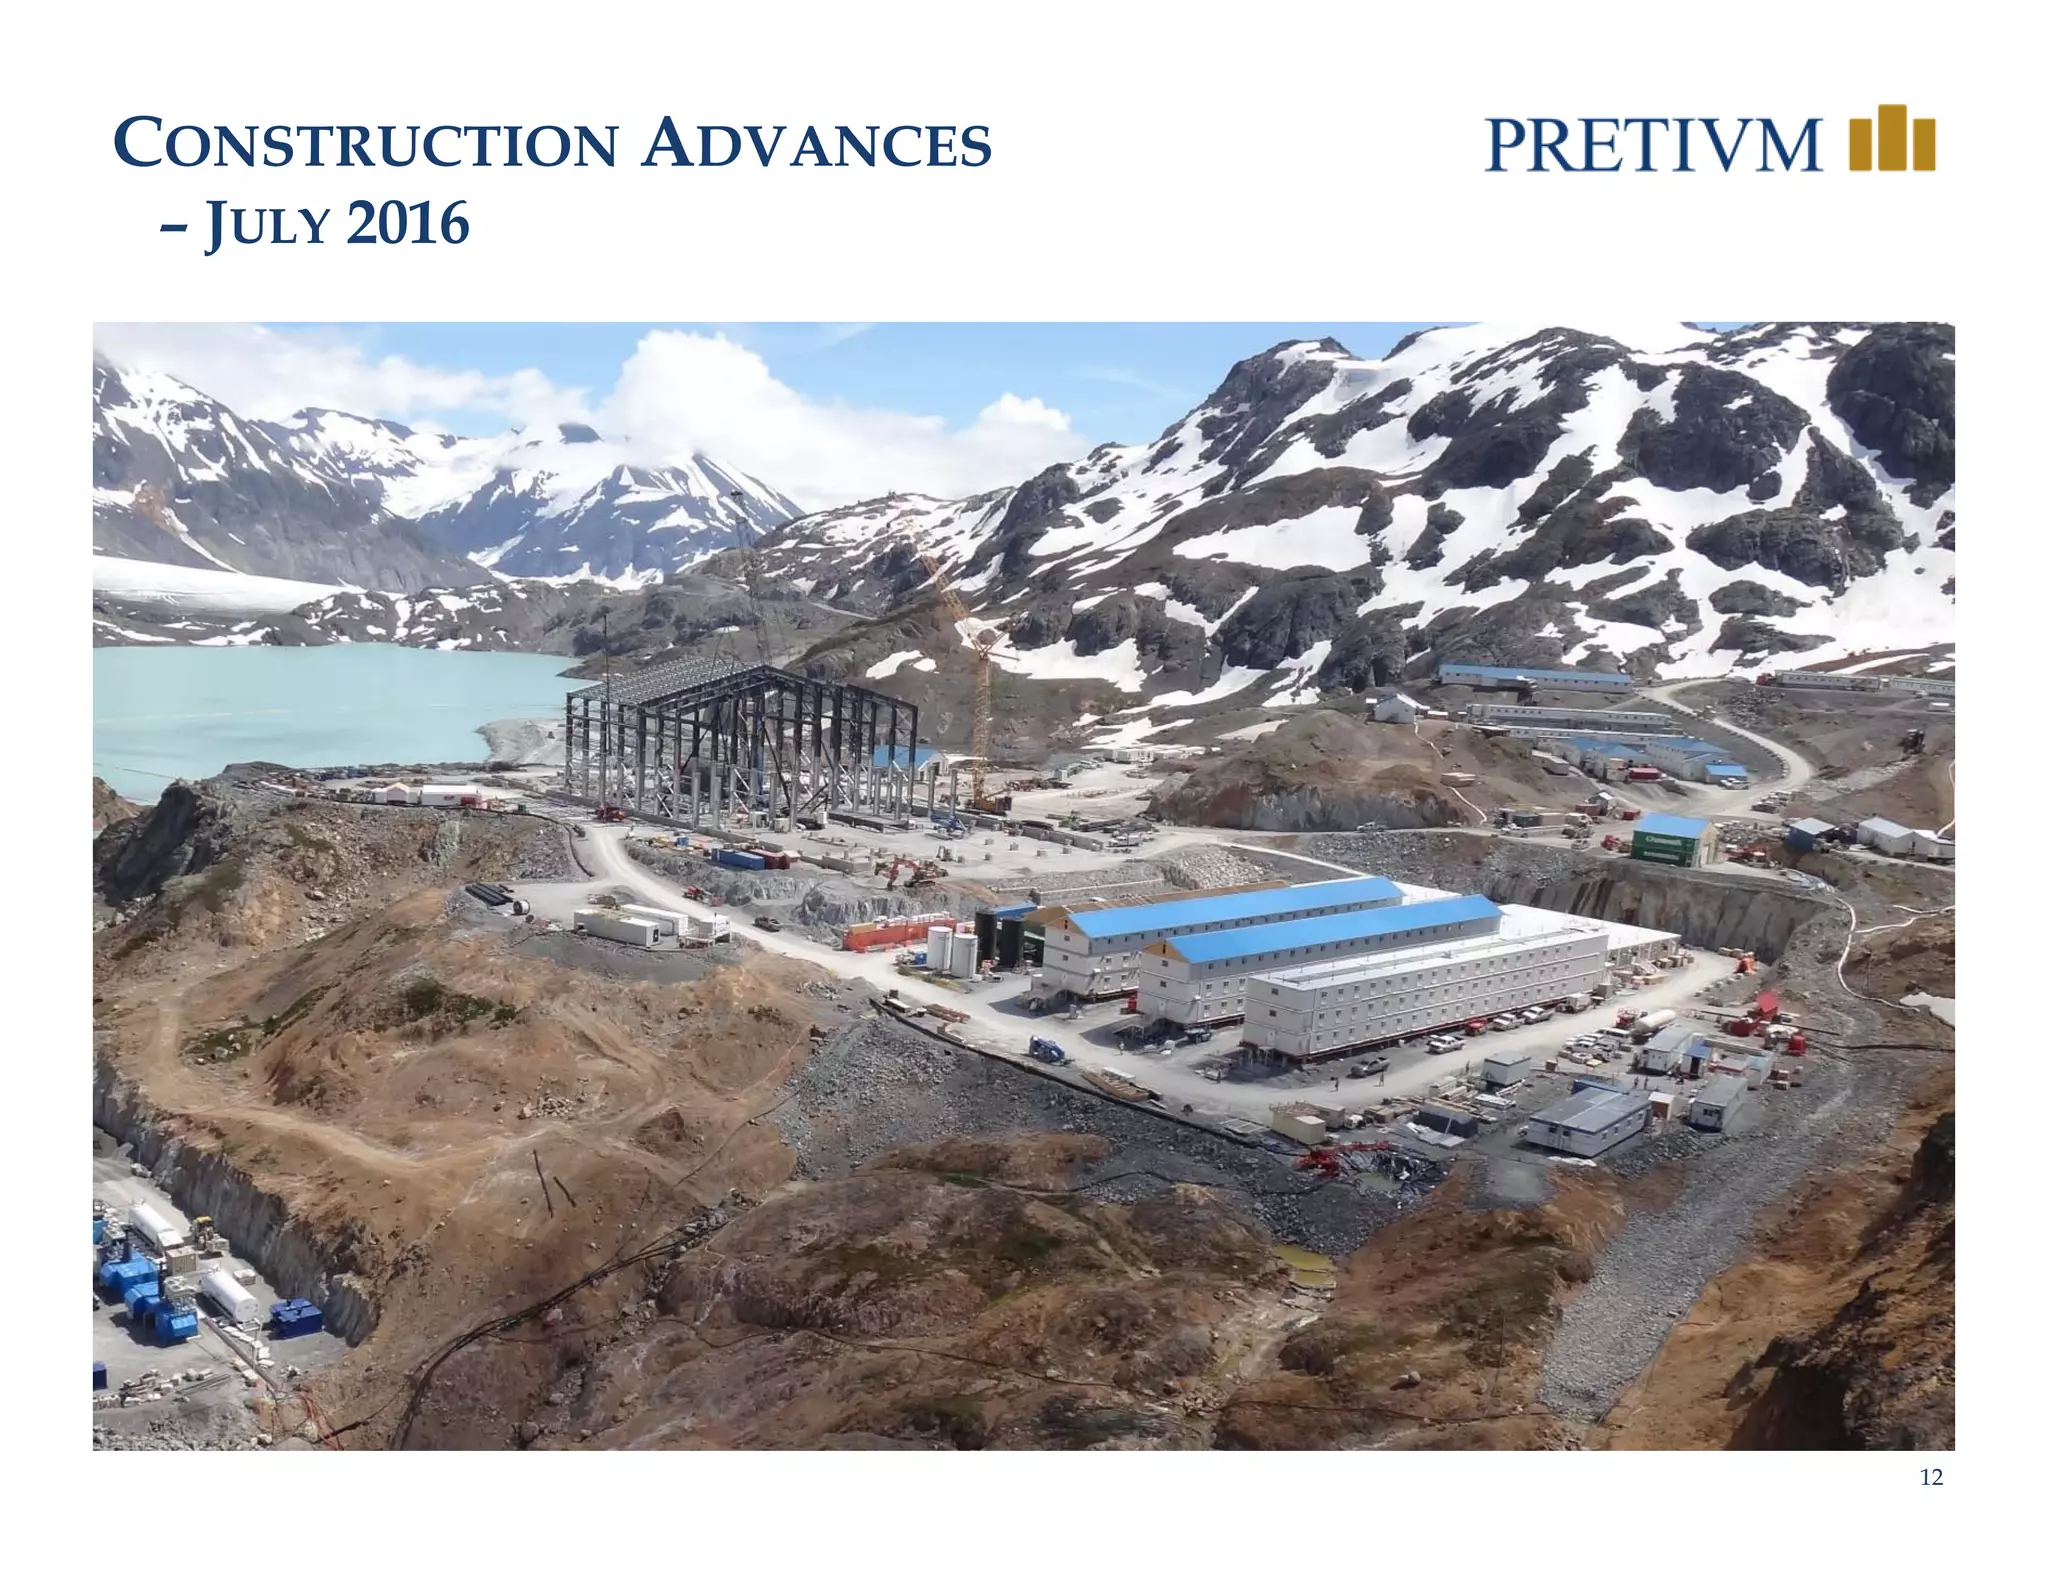
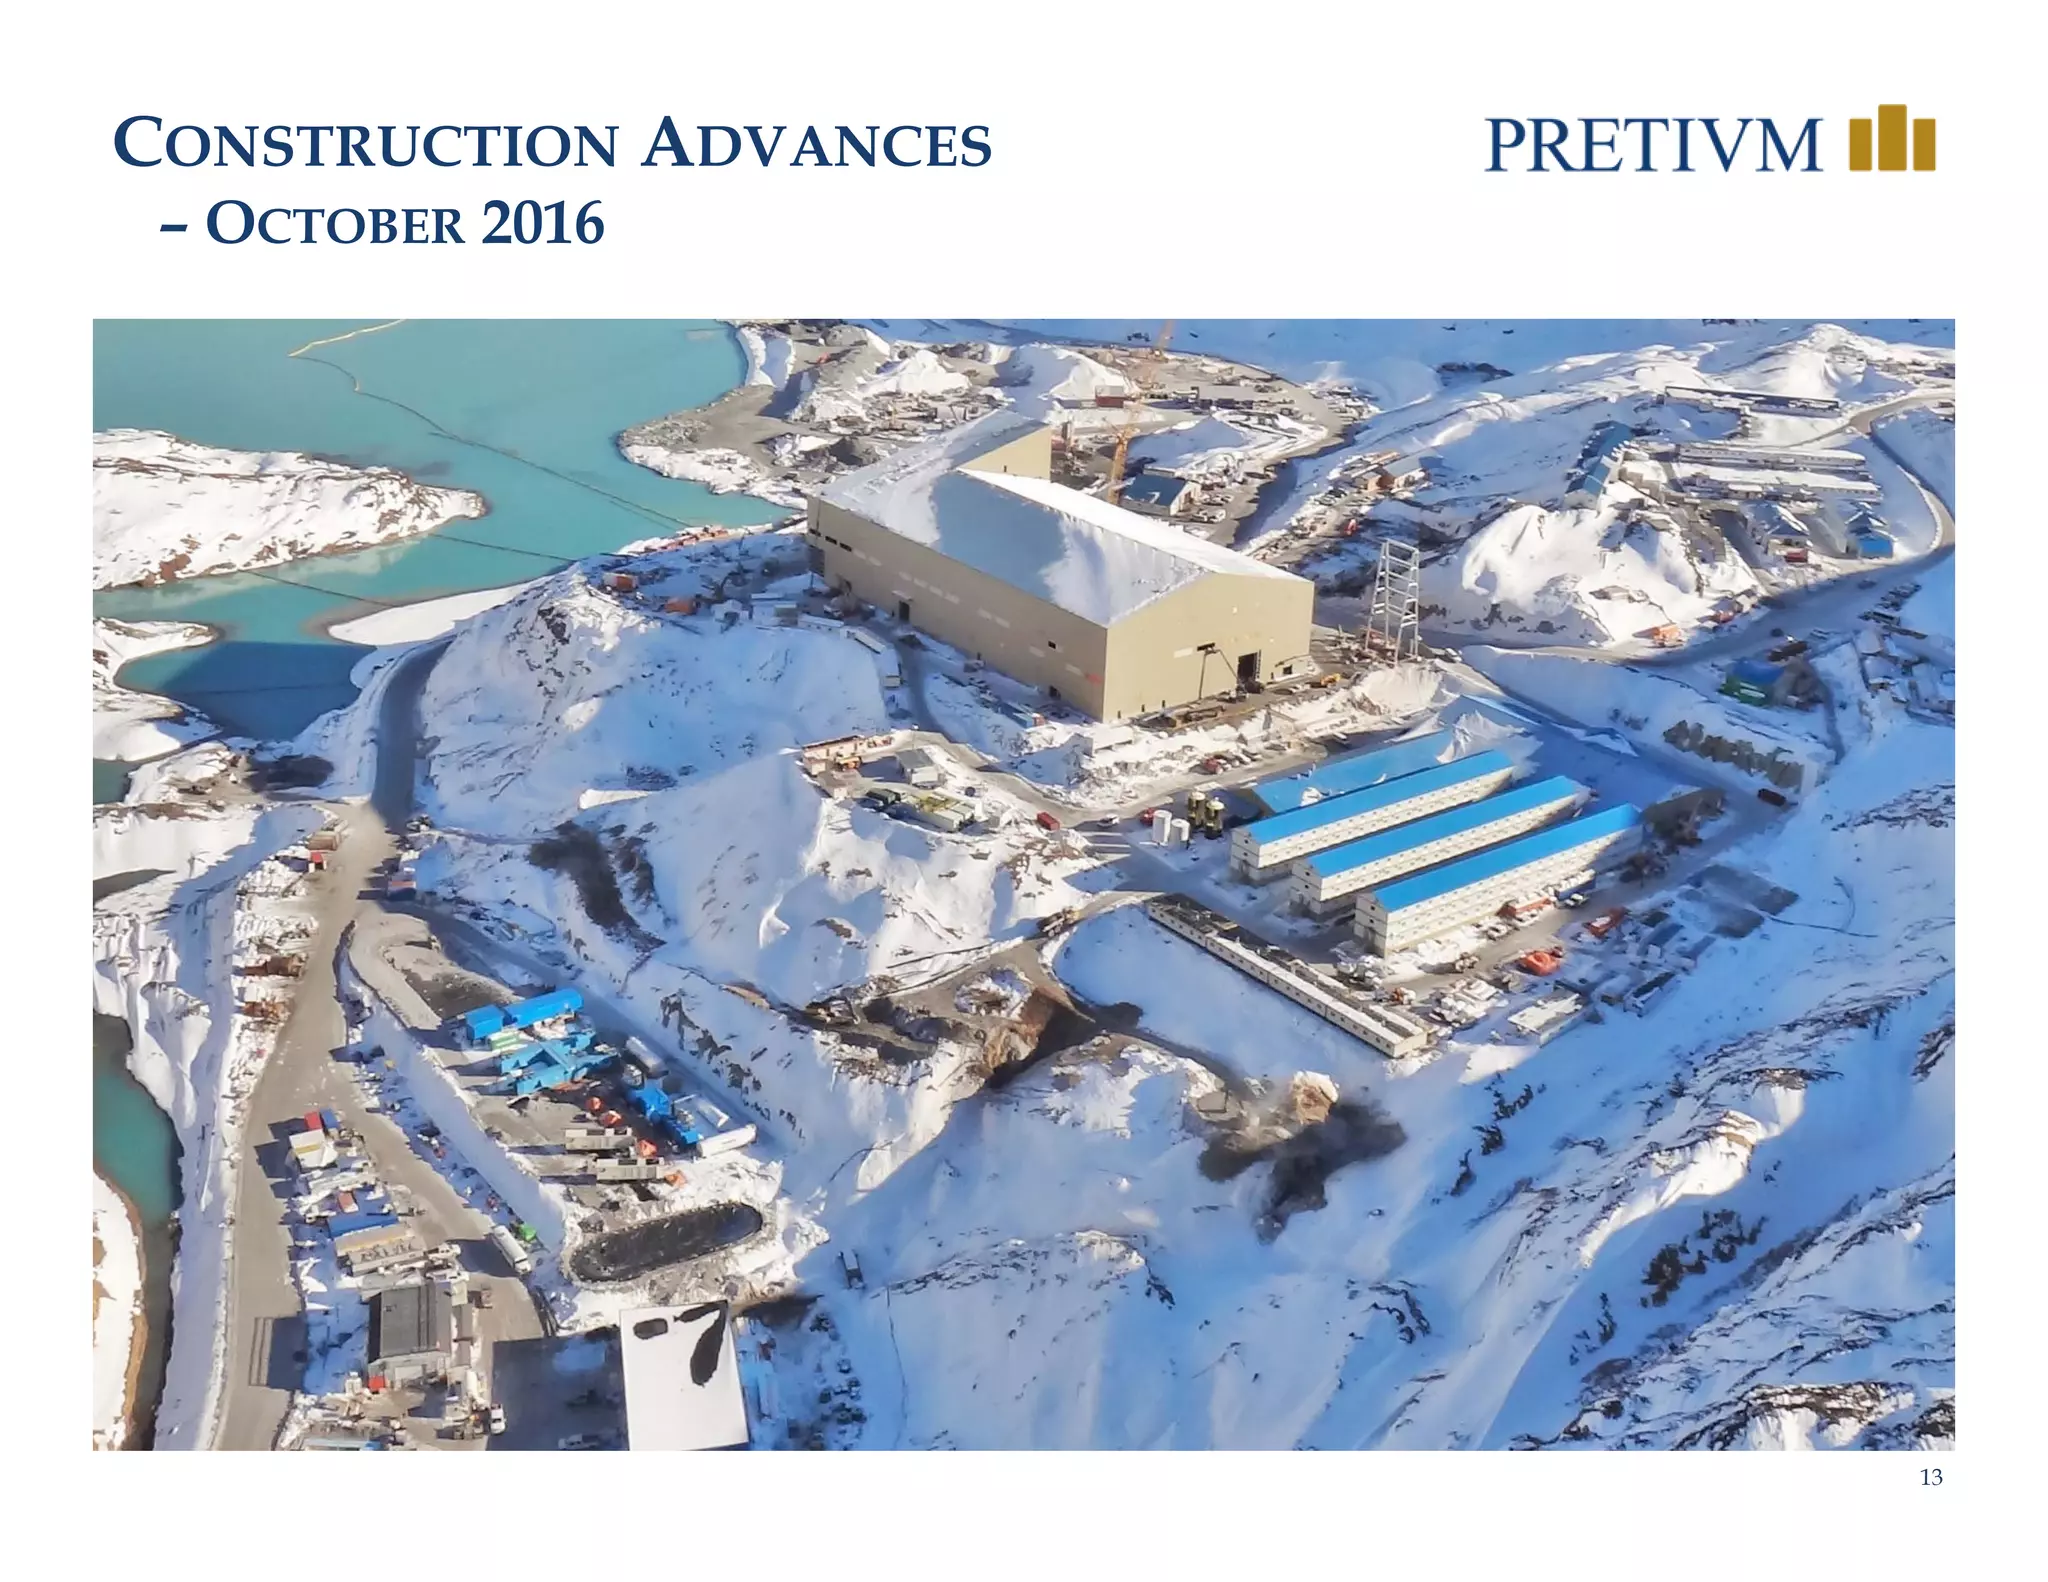
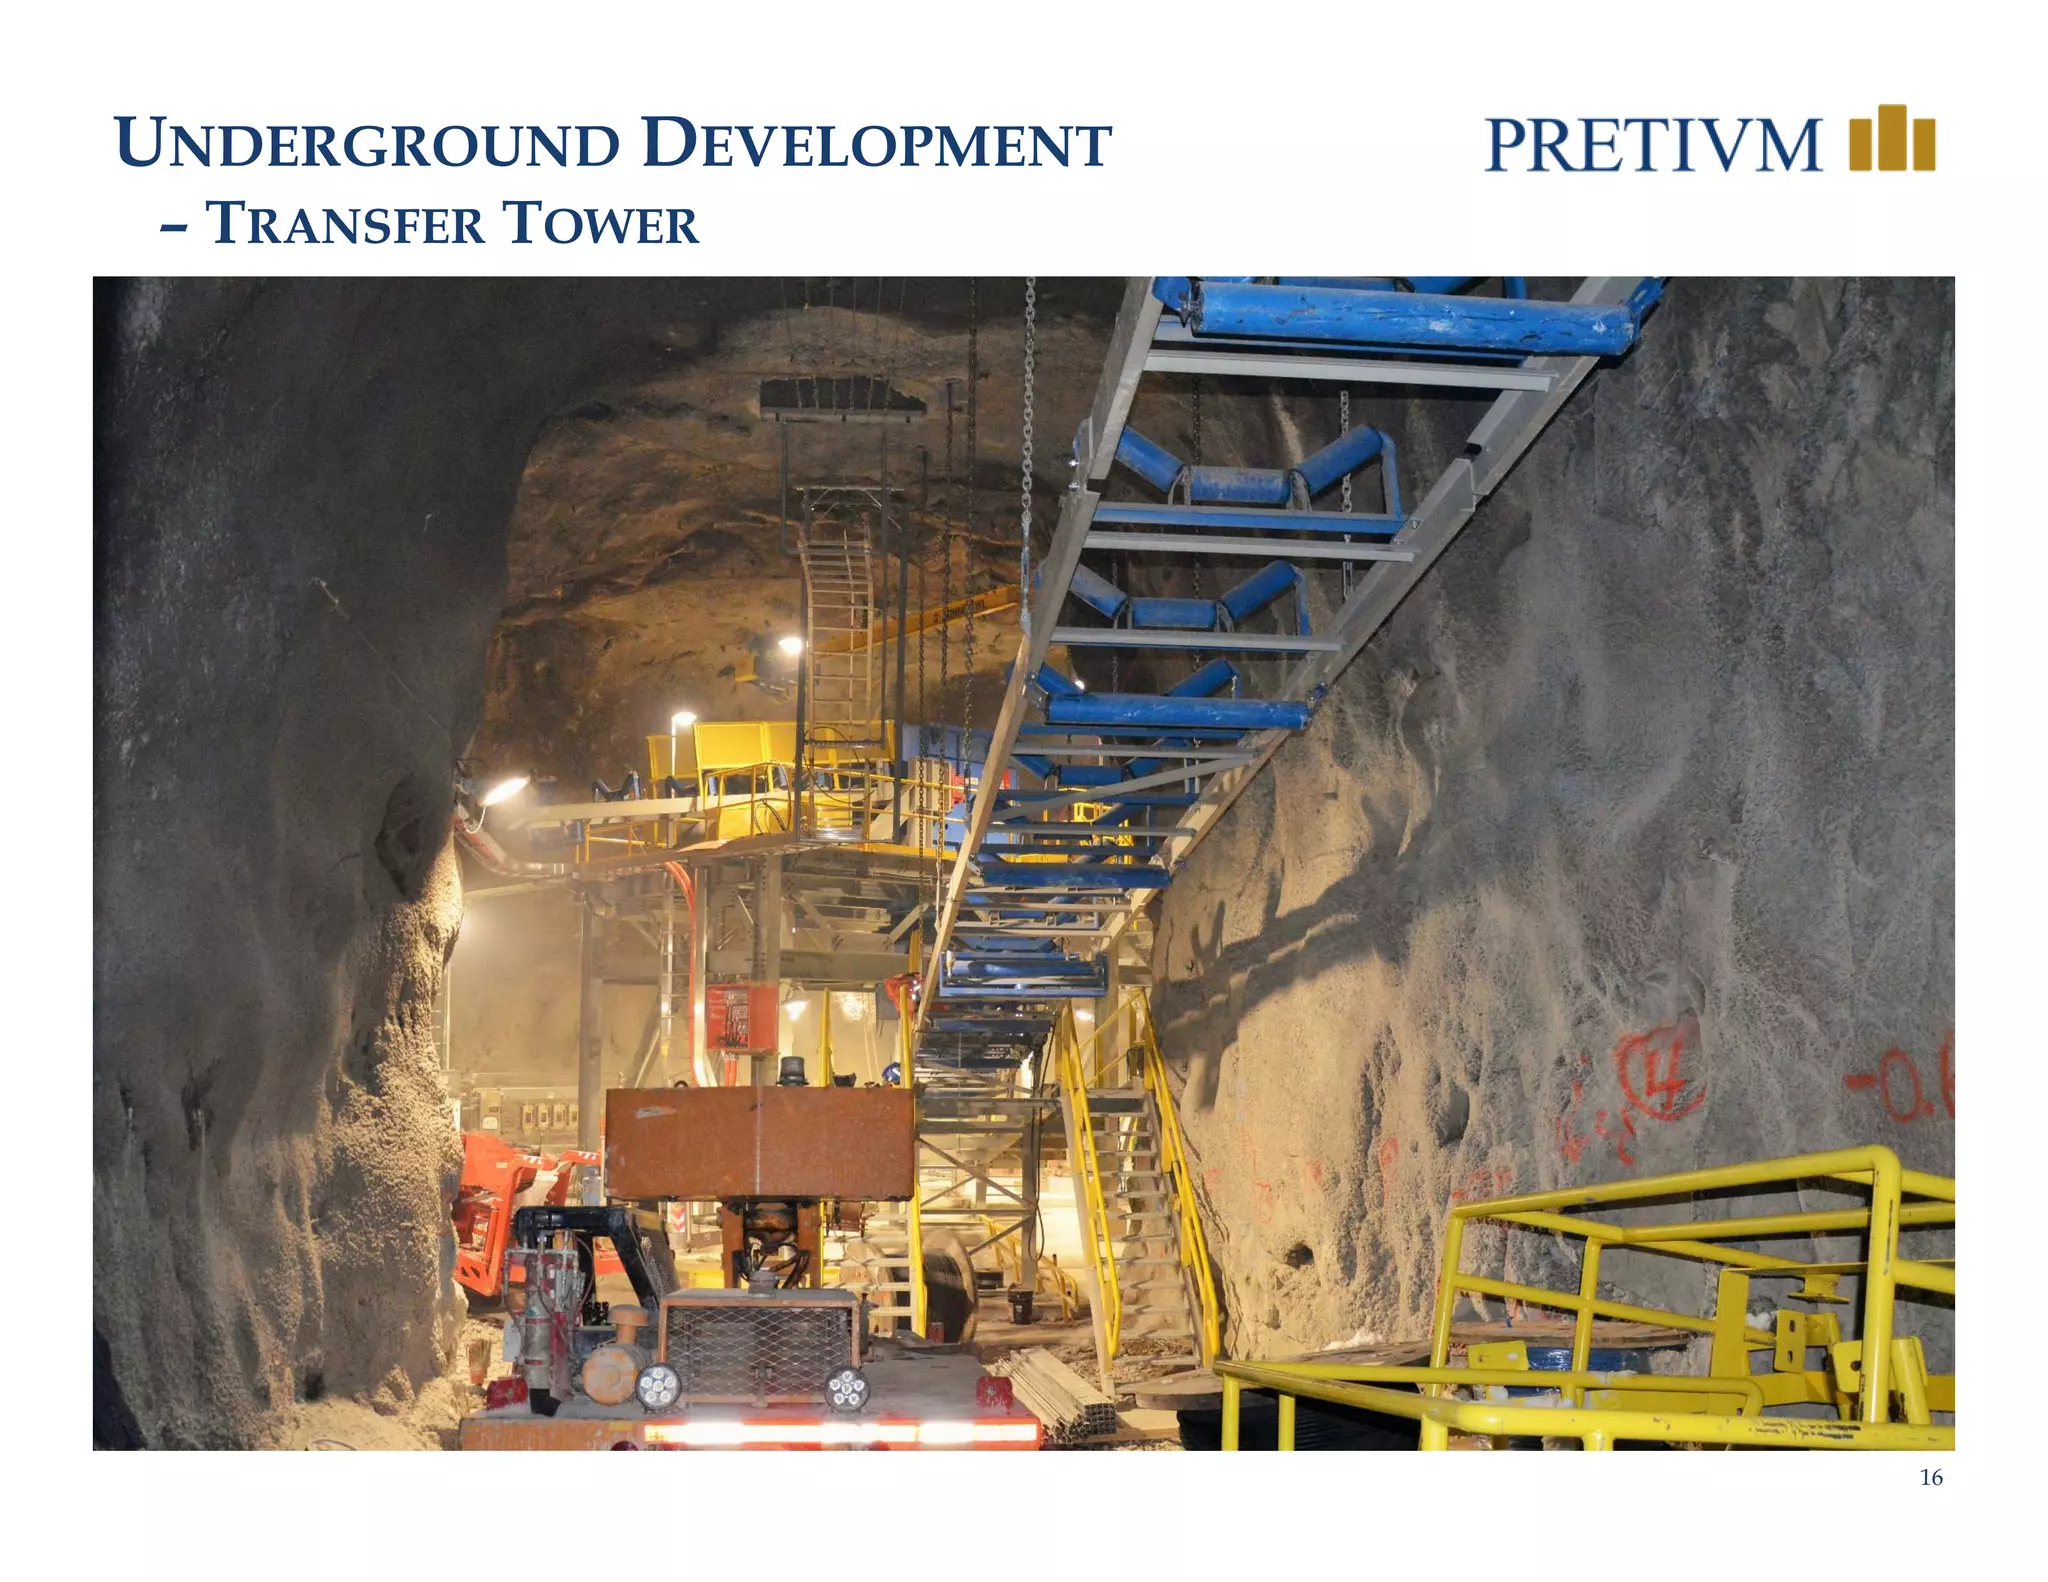
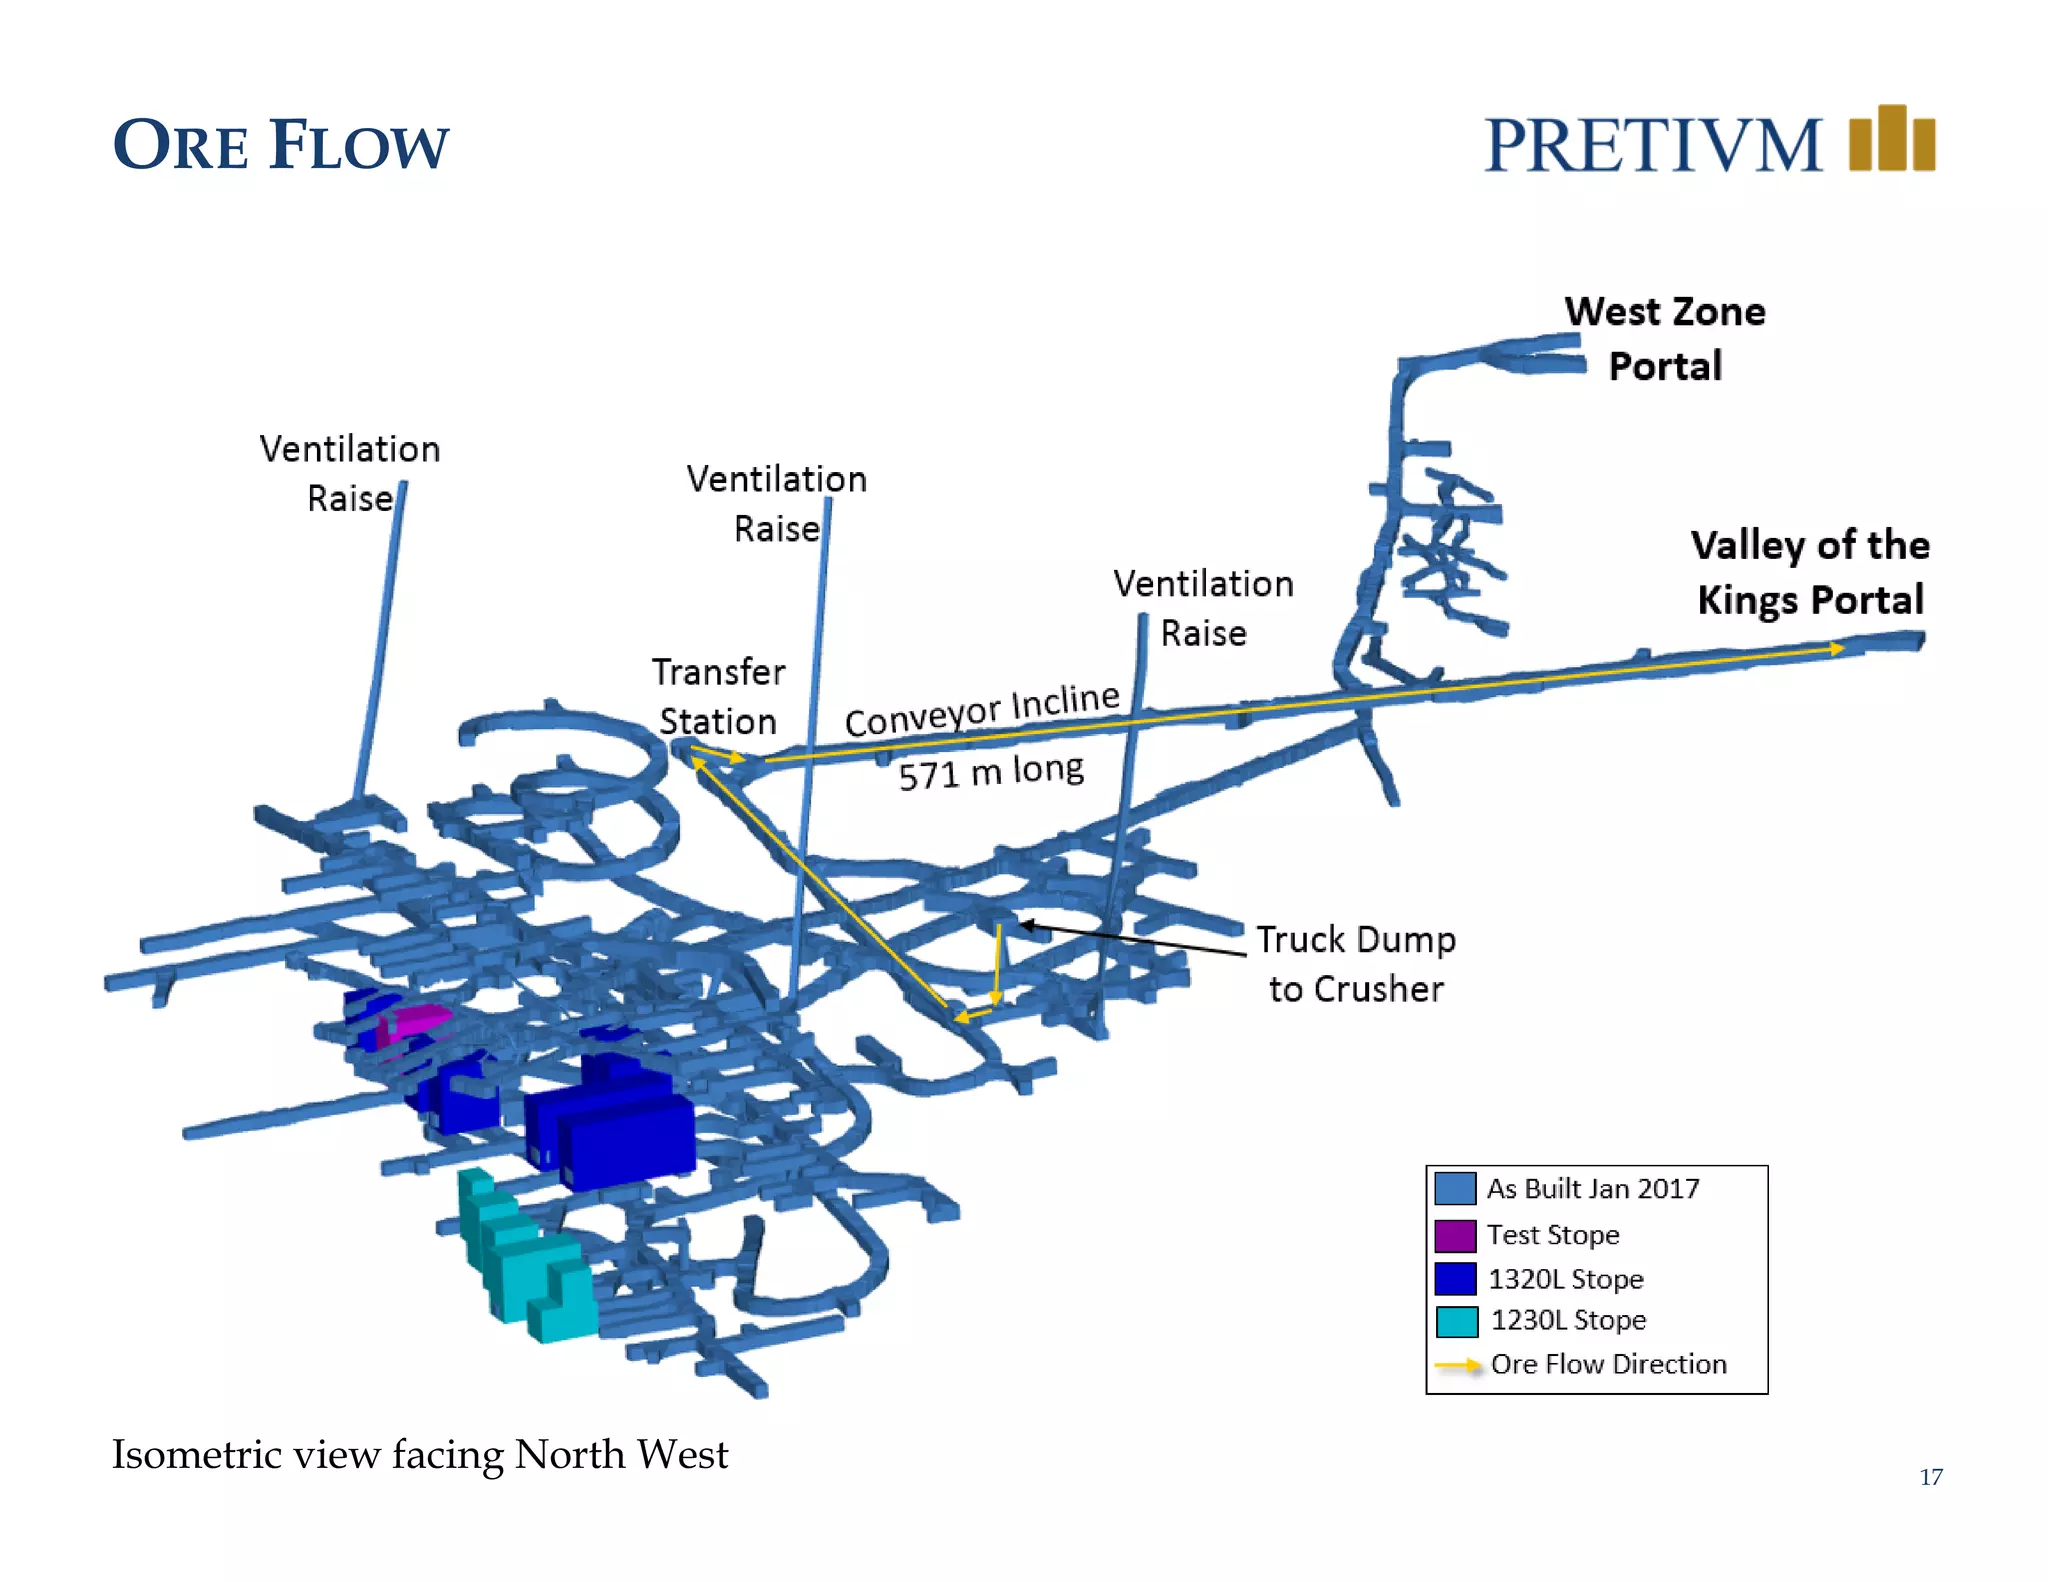
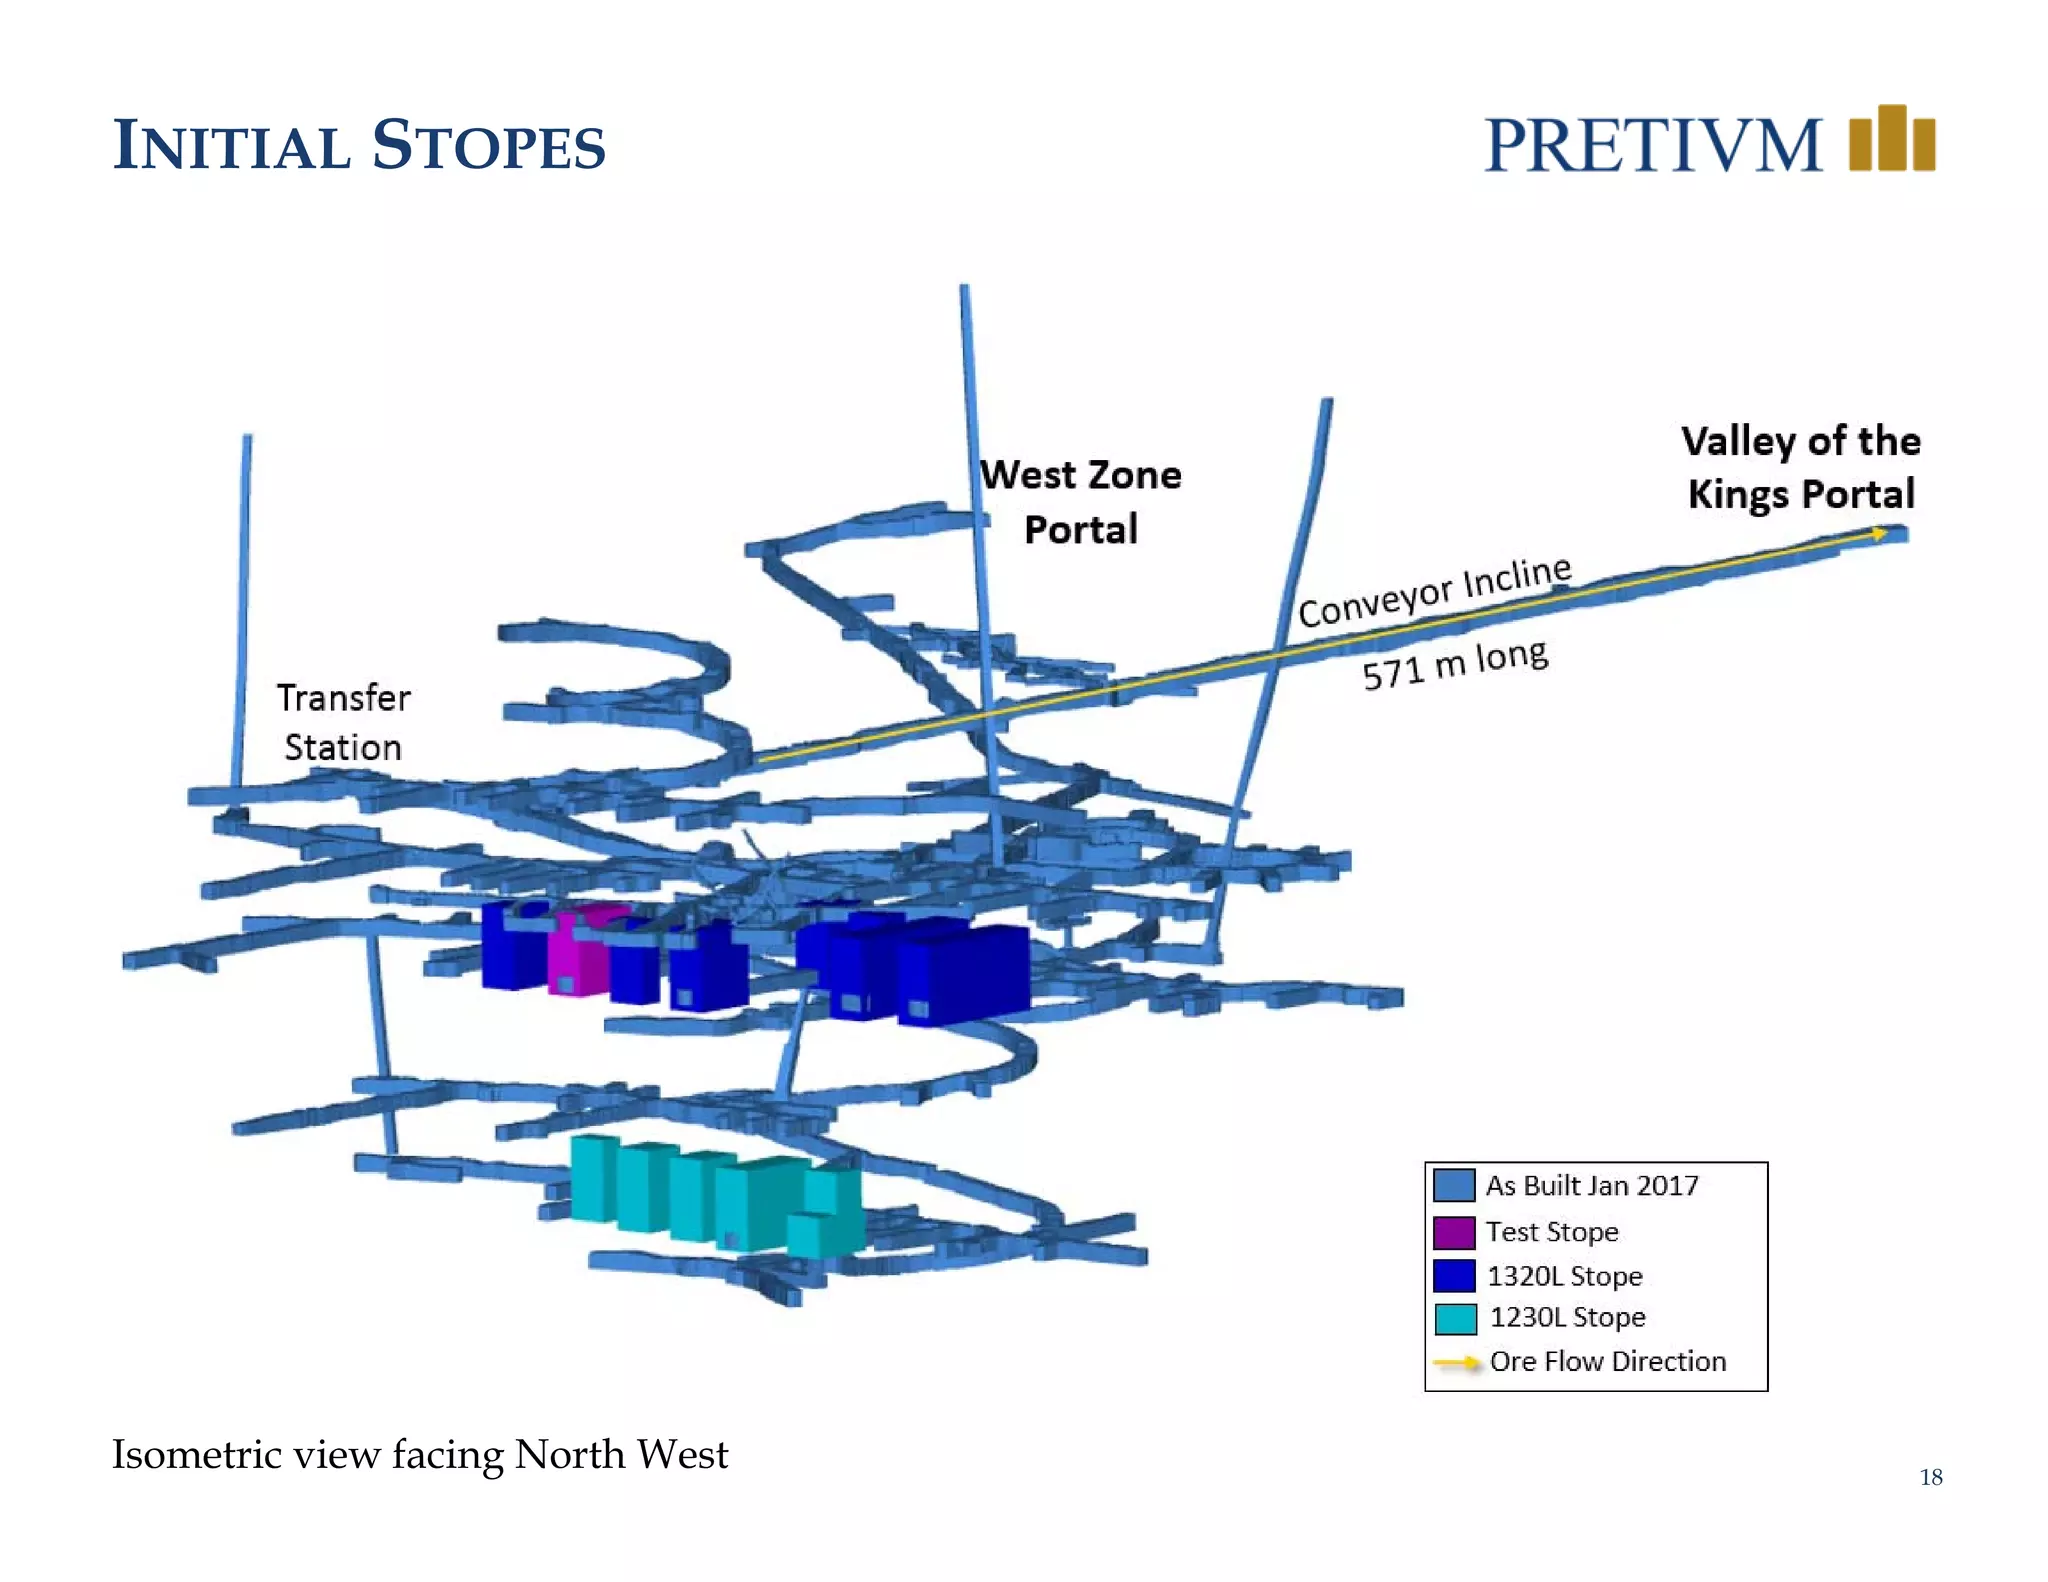
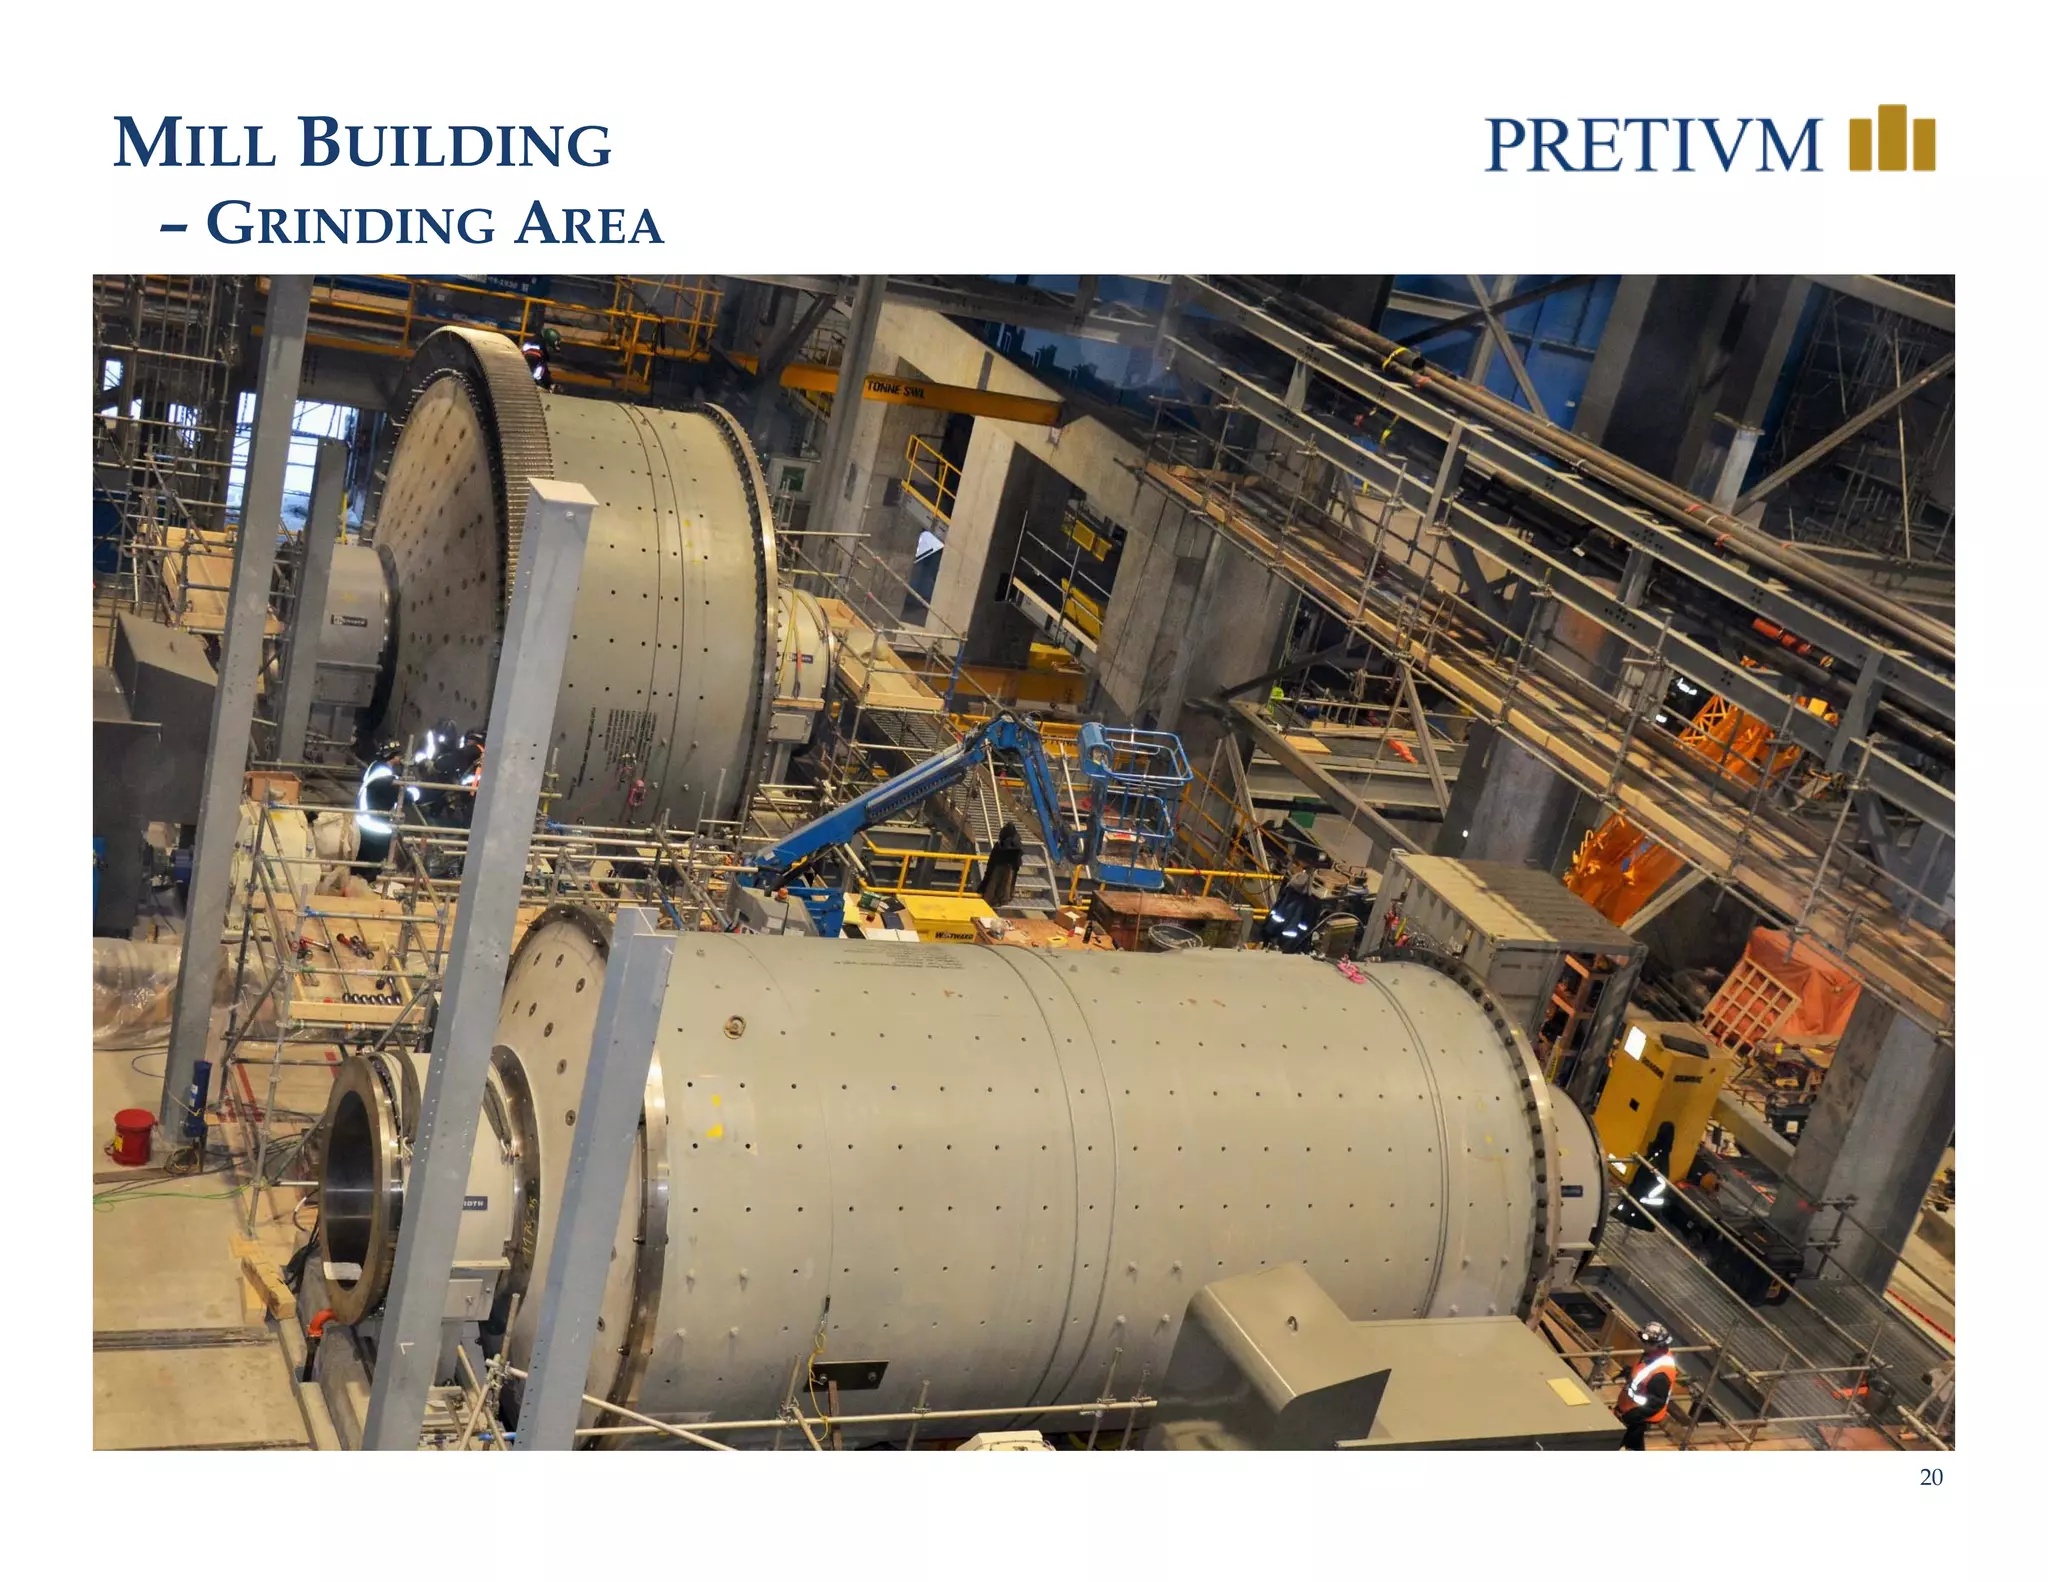
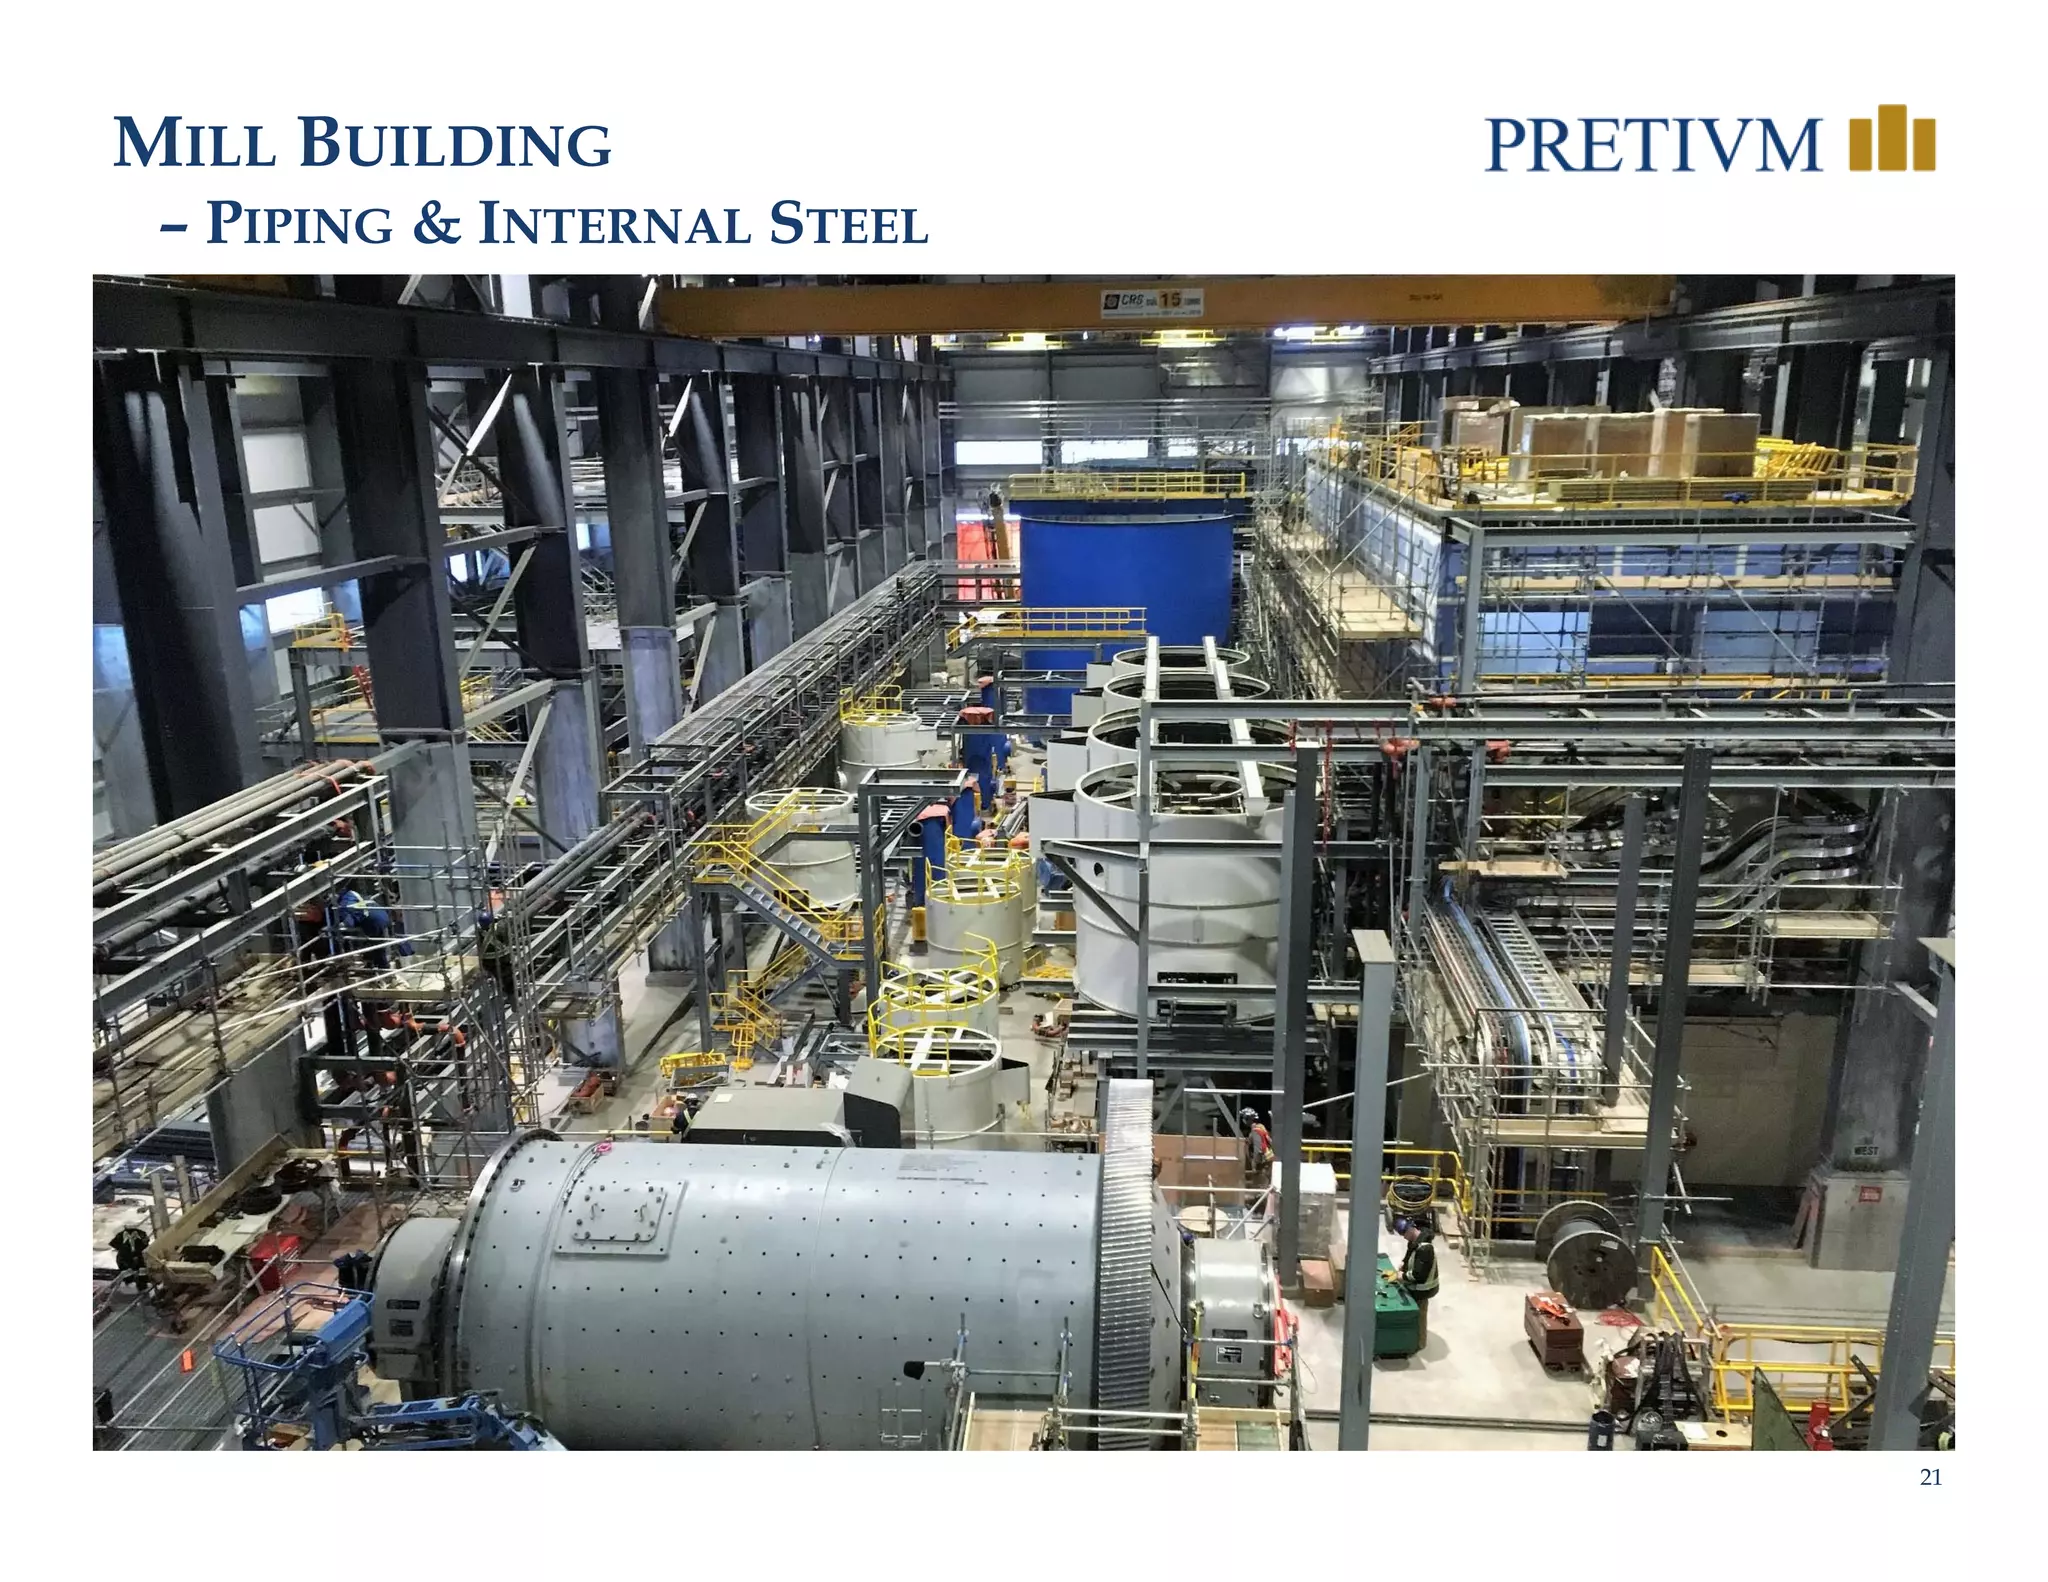
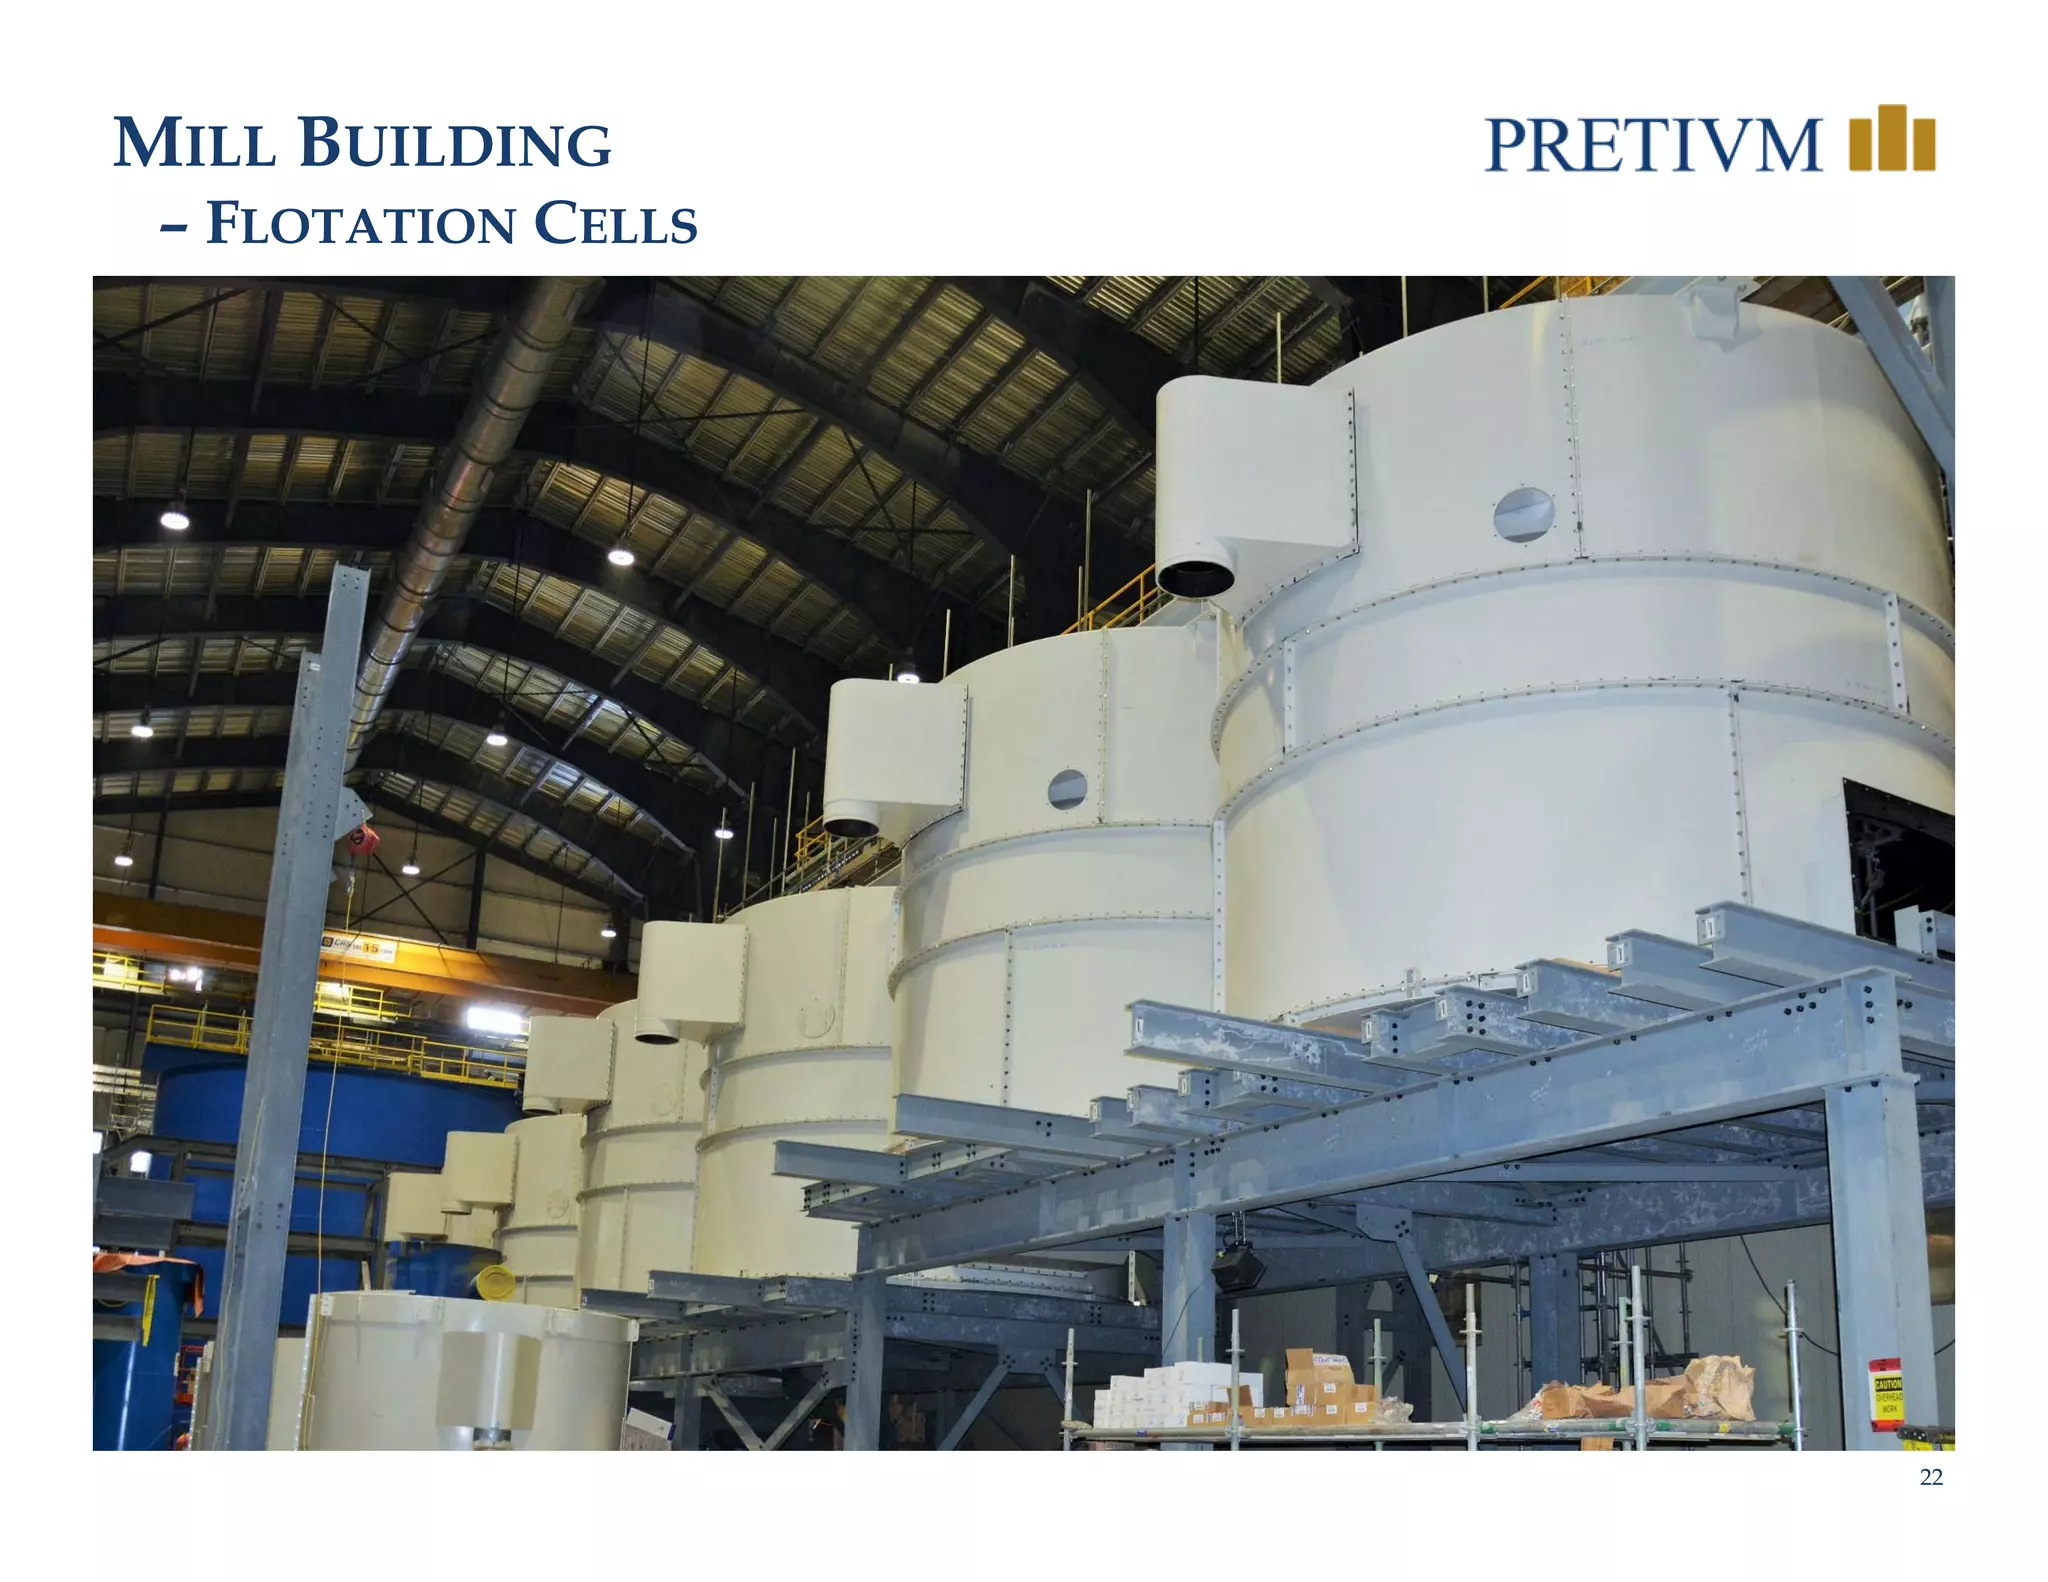
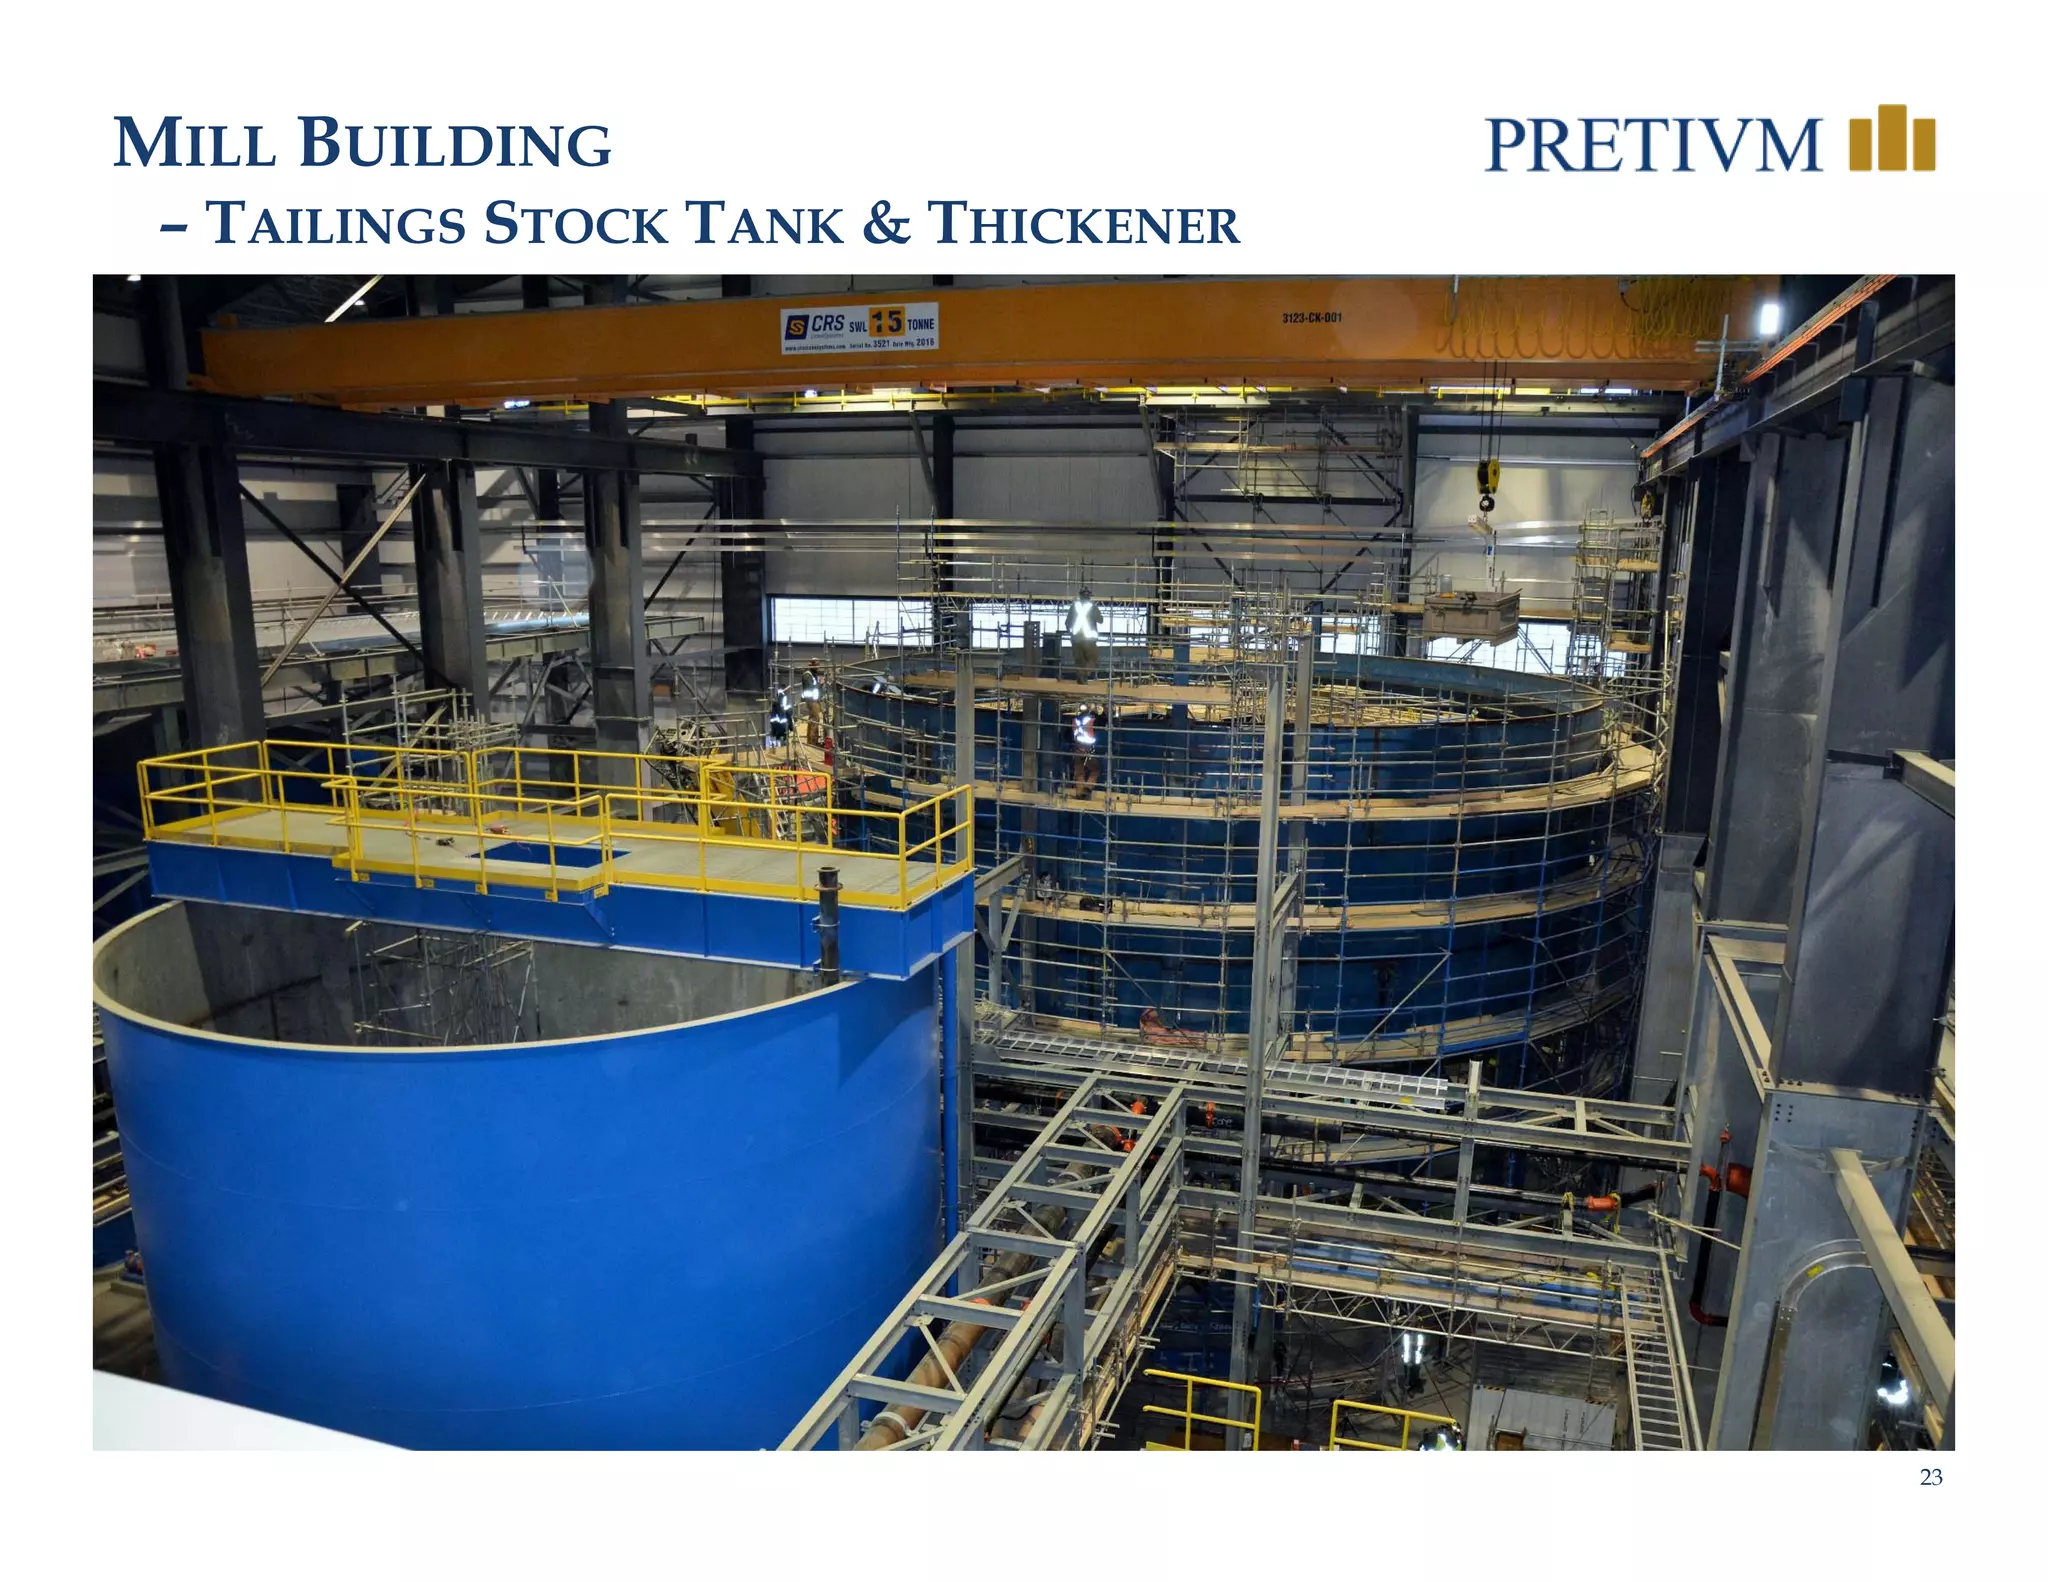
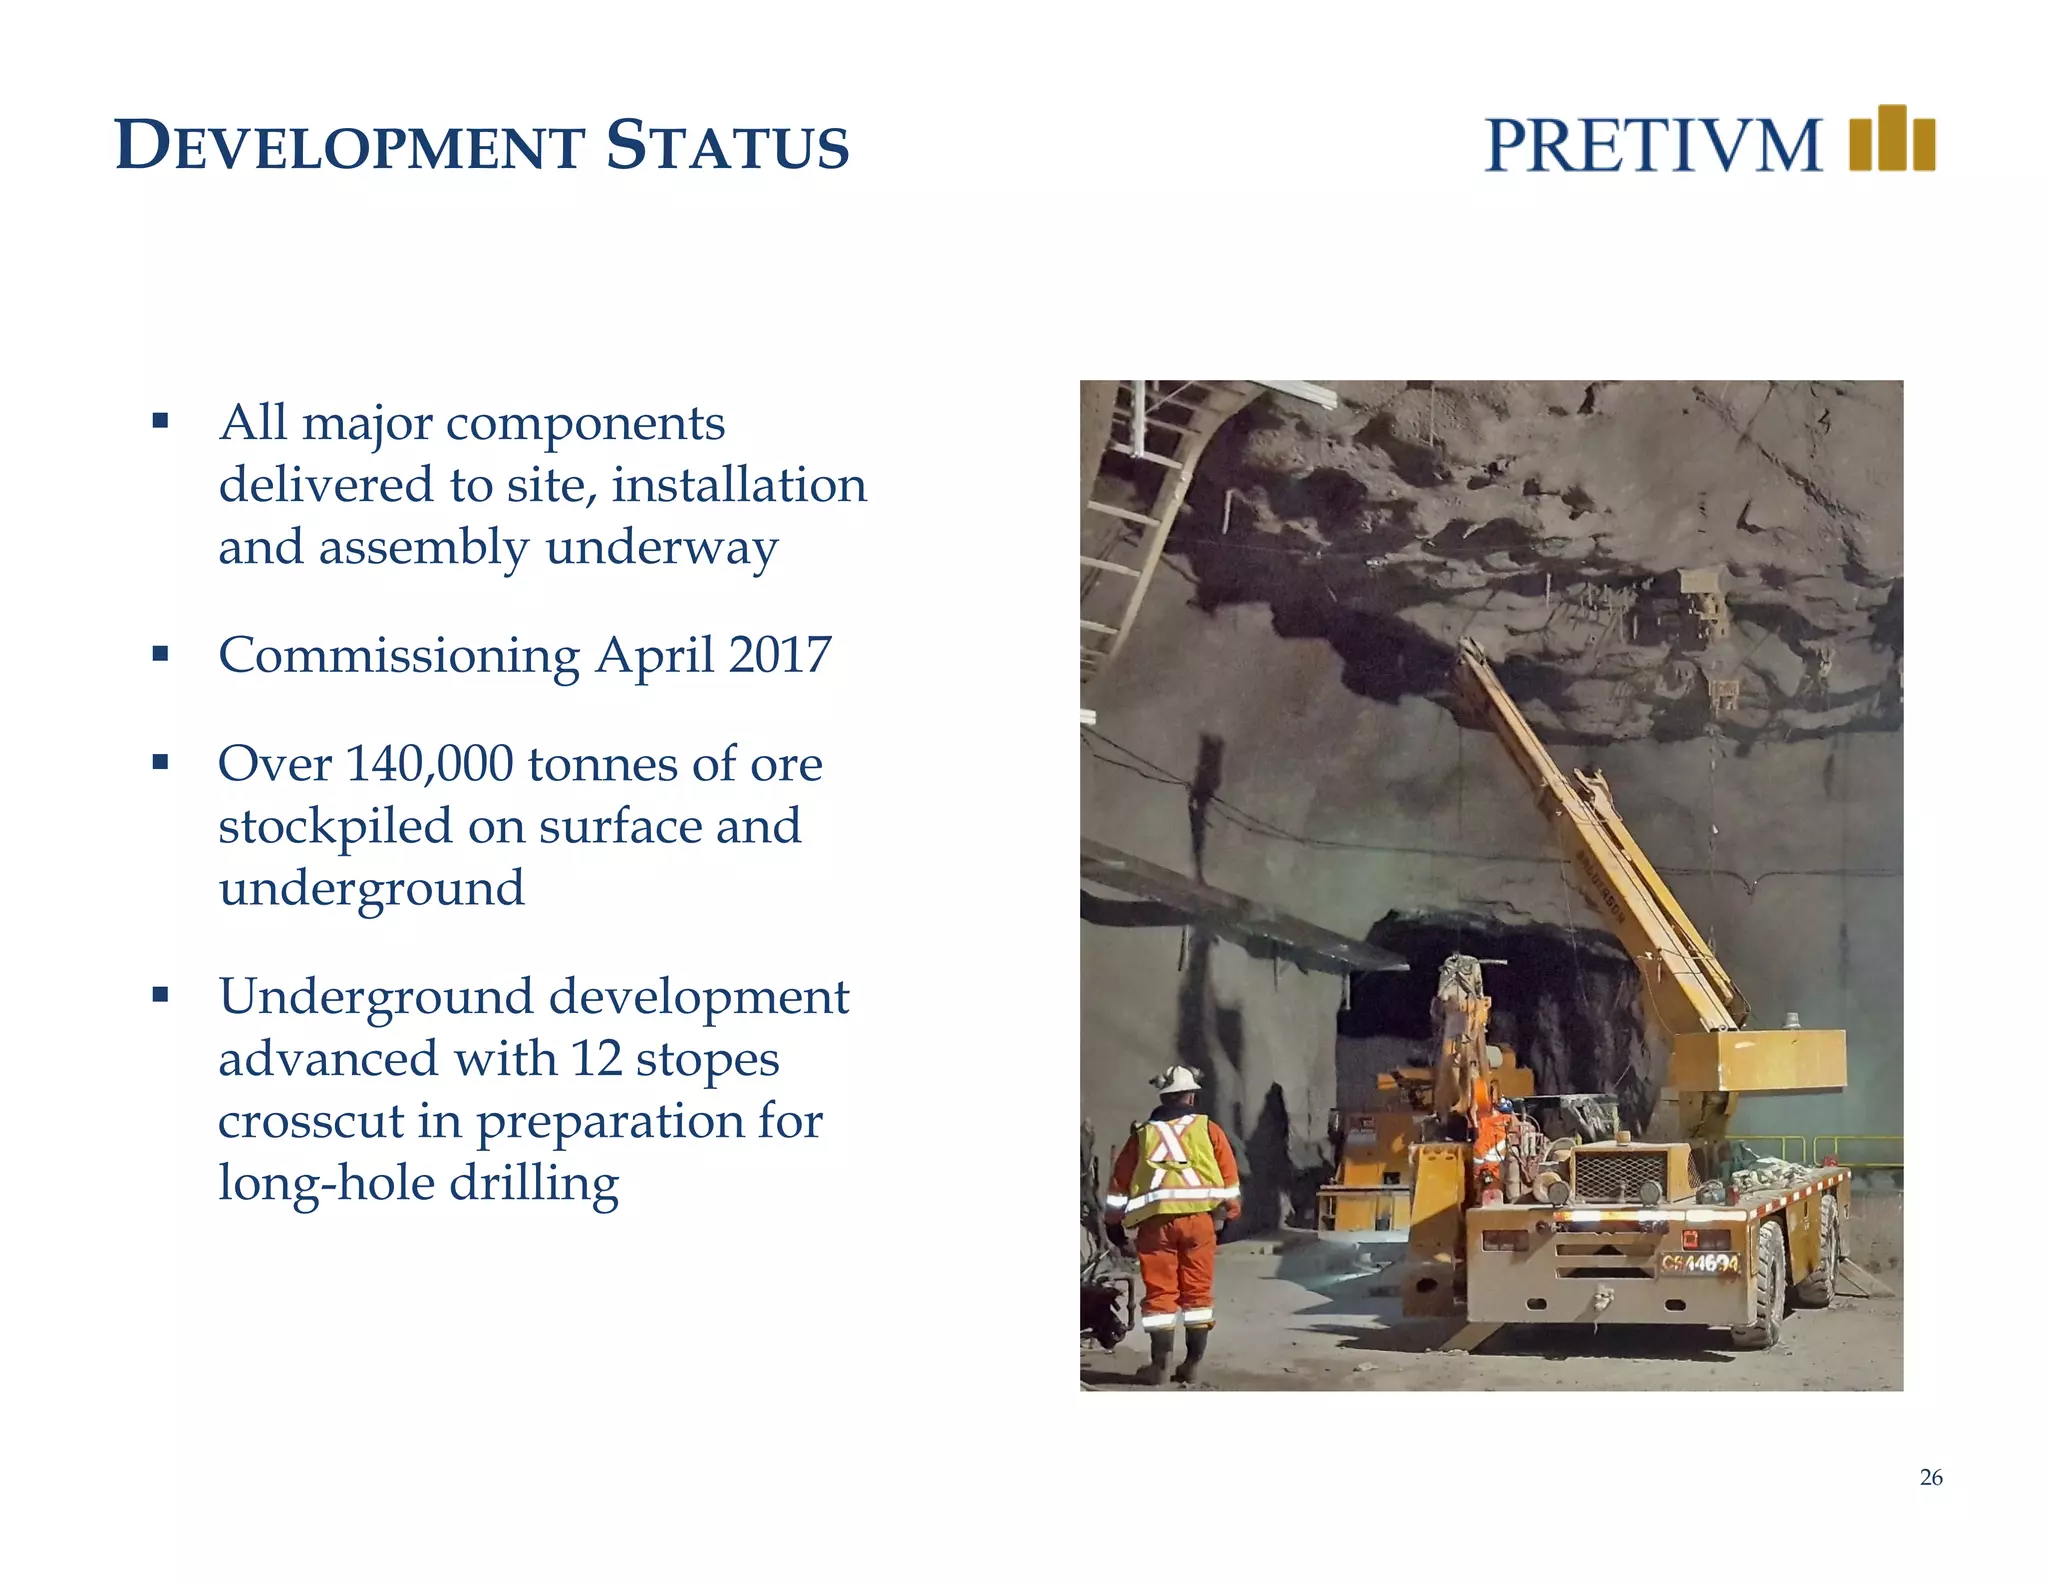
3) Construction is nearing completion, with all major equipment delivered and installed, over 140,000 tonnes of ore stockpiled, and underground development advanced with 12 stopes prepared for production.