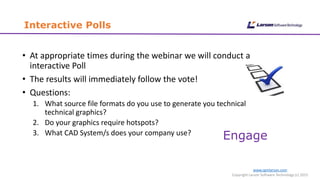
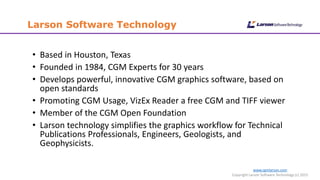
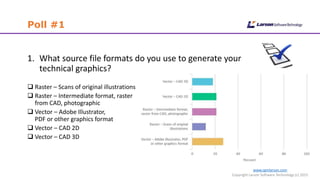
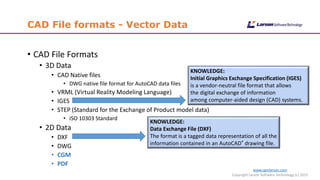
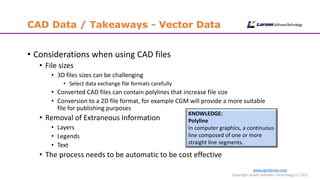
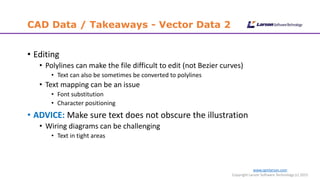
Technical Graphics data can originate from many different sources and as a result be in stored and exchanged in varying formats. The best practice is to manage and store the data in an open, quality and reliable electronic format.
Lesson objectives:
Understand what is symbol and how it helps.
Understand the types of symbol.
To learn how to create graphic, button symbol.
Converting object to symbol.
Edit symbols.
Using symbol color effect
The notes offer advice regarding the Irish Post-Primary Junior Certificate Technical Graphics examination. These notes are intended for study purposes only. Not all of the syllabus areas are represented in these notes.
Converting and Integrating Legacy Data and Documents When Implementing a New CMSdclsocialmedia
If you are in the Insurance and Financial industries, attend this webinar and learn the roadmap for implementing a content management system with a customized conversion process.
The transformation of graphical data plays a significant role in the production of technical publications. Invariably the source graphical information is not suitable for direct inclusion in a technical publication. The data will usually require some post processing either to change its electronic file format or add value to enable the user to interaction.
Talking Technical Illustration is a new bi-weekly webinar event, your host, David Manock, over 30 years industry experience. We will encourage interaction, Polls, Q & A, comments, share your views with the community. A great opportunity to communicate using the chat function, and we will open the participant microphone on request. Current topics: 3D Conversion, 3D file formats, 3D model display in technical documentation. We hope you can join the event and make a contribution.
VizEx Edit is the Larson professional technical illustration software. The creation and revision of 2D graphics is a crucial element of the production of technical publications. See the new version of VizEx Edit demonstrated, before release.
VizEx Edit Version 11 includes compelling functions for the Technical Illustrator/Writer.
Larson has developed software for the technical graphics industry for over 25 years. VizEx Edit is our flagship illustration software, easy to use, enabling the creation and revision of CGM graphics. VizEx Edit provides complete compliance with the S1000D and iSpec 2200 specifications.
Larson has developed software for the technical graphics industry for over 25 years. VizEx Edit is a native CGM editor, the ideal graphics creation and revision software, providing compliance with the S1000D and iSpec 2200 specifications.
The webinar objective is to communicate our current and future 3D graphics strategy. We will demonstrate a new software solution, and present our 3D product roadmap. Do not miss this event, it will be the official launch of the new Larson Technology 3D solution.
The deployment and mobilization of technical graphics in an electronic environment is a significant part of the technical publications distribution process. Larson Software Technology, experts in the technical graphics domain are pleased to present an informational webinar.
The topic has many factors to consider, file formats, platform, viewers, devices etc. We will provide valuable information and advice on the deployment choices, possible pitfalls and advantages of mobile deployment.
The presentation will also consist of live demonstations of available technologies and discuss future developments. Register now and learn more by participating in our latest webinar.
Larson has a deep understanding of the technical illustration discipline, and the requirement to deliver quality and standards compliant graphics. The session will describe the status of graphics today, and how we might create, revise and deliver them in the future. We will discuss both 2D and 3D graphics, we hope you can join us for this informative session.
The webinar will be a live demonstration of the graphics production process at MacLean Engineering. The guest presenter, David Manock, President, Vizualsite LLC, is an expert in the technical publications/illustration discipline. David will demonstrate how VizEx Transform automates the process of producing CGM graphics from 2D CAD data.
Larson's contribution to Manufacturing Day 2015 is a webinar presenting a live demonstration of the graphics production process at MacLean Engineering.
CGM (Computer Graphics Metafile) v SVG (Scalable Vector Graphic)Vizualsite LLC
The slides provide an overview of the two open graphics formats CGM and SVG. Included is a comparison of the formats and the benefits and limitations of both. They slides were part of a webinar, please follow the link to see a recording. https://attendee.gotowebinar.com/recording/9059357153062897153
Don Larson, CEO, will introduce our first webinar of 2018. The subject, very topical, CGM and SVG, we share our latest thoughts and technology relating to the 2D graphic formats.
CGM (Computer Graphics Metafile), is still probably the most widely used non-proprietary 2D graphics format. However, there is a new kid on the block, well not that new, SVG (Scalable Vector Graphic), version 1.0 of SVG was released in 2001.
The webinar will discuss the 3 C’s, Conversion, Compatibility and Compliance. We will share our experiences over the past 12 months, and our development strategy to support the formats.
The ability to view and interact with CGM graphics is a crucial task for many companies and organizations. The ability to view graphics is just one of the requirements, also important is the capability to convert to additional file formats. Also, the facility to print is equally significant, especially to larger format devices, a requirement in the Oil and Gas industry.
David Manock, the VP Sales and Marketing, will introduce and present our latest webinar.
As we build up to the 2018 S1000D User Forum in New Orleans, the timing is probably right to provide a refresher on the requirement for compliant graphics. Join us for an overview of the specification, issue 4.2, what’s new and some considerations when implementing a 2D graphics strategy.
We hope you can attend the event and benefit from our industry knowledge.
Larson's world leading CGM technology enables you to distribute your CGM graphics easily to co-workers, customers, partners and suppliers. The VizEx View family comprises of various products each designed to deliver reliable and quality CGM files. We will also demonstrate our new revolutionary VizEx View HTML5 product, no plug-in required.
Talking Technical Illustration is a new bi-weekly webinar event, your host, David Manock, over 30 years industry experience. We will encourage interaction, Polls, Q & A, comments, share your views with the community. A great opportunity to communicate using the chat function, and we will open the participant microphone on request. Topic: S1000D Illustrations, we will discuss illustration guidelines, hotspots, file formats. etc. We hope you can join the event and make a contribution.
CGM and SVG are currently the most significant file formats in technical illustration. We will discuss the current status of the formats, and make some important announcements with respect to our support of CGM and SVG.
Our popular annual workshop, CGM and SVG is back in 2019. The experience we’ve gained over the past year has been invaluable, especially the conversion from CGM to SVG. We will update the participants on the current status of the two formats and our strategy to support the technology and end-users.
More Related Content
Similar to Converting & Transforming Technical Graphics
The transformation of graphical data plays a significant role in the production of technical publications. Invariably the source graphical information is not suitable for direct inclusion in a technical publication. The data will usually require some post processing either to change its electronic file format or add value to enable the user to interaction.
Talking Technical Illustration is a new bi-weekly webinar event, your host, David Manock, over 30 years industry experience. We will encourage interaction, Polls, Q & A, comments, share your views with the community. A great opportunity to communicate using the chat function, and we will open the participant microphone on request. Current topics: 3D Conversion, 3D file formats, 3D model display in technical documentation. We hope you can join the event and make a contribution.
VizEx Edit is the Larson professional technical illustration software. The creation and revision of 2D graphics is a crucial element of the production of technical publications. See the new version of VizEx Edit demonstrated, before release.
VizEx Edit Version 11 includes compelling functions for the Technical Illustrator/Writer.
Larson has developed software for the technical graphics industry for over 25 years. VizEx Edit is our flagship illustration software, easy to use, enabling the creation and revision of CGM graphics. VizEx Edit provides complete compliance with the S1000D and iSpec 2200 specifications.
Larson has developed software for the technical graphics industry for over 25 years. VizEx Edit is a native CGM editor, the ideal graphics creation and revision software, providing compliance with the S1000D and iSpec 2200 specifications.
The webinar objective is to communicate our current and future 3D graphics strategy. We will demonstrate a new software solution, and present our 3D product roadmap. Do not miss this event, it will be the official launch of the new Larson Technology 3D solution.
The deployment and mobilization of technical graphics in an electronic environment is a significant part of the technical publications distribution process. Larson Software Technology, experts in the technical graphics domain are pleased to present an informational webinar.
The topic has many factors to consider, file formats, platform, viewers, devices etc. We will provide valuable information and advice on the deployment choices, possible pitfalls and advantages of mobile deployment.
The presentation will also consist of live demonstations of available technologies and discuss future developments. Register now and learn more by participating in our latest webinar.
Larson has a deep understanding of the technical illustration discipline, and the requirement to deliver quality and standards compliant graphics. The session will describe the status of graphics today, and how we might create, revise and deliver them in the future. We will discuss both 2D and 3D graphics, we hope you can join us for this informative session.
The webinar will be a live demonstration of the graphics production process at MacLean Engineering. The guest presenter, David Manock, President, Vizualsite LLC, is an expert in the technical publications/illustration discipline. David will demonstrate how VizEx Transform automates the process of producing CGM graphics from 2D CAD data.
Larson's contribution to Manufacturing Day 2015 is a webinar presenting a live demonstration of the graphics production process at MacLean Engineering.
CGM (Computer Graphics Metafile) v SVG (Scalable Vector Graphic)Vizualsite LLC
The slides provide an overview of the two open graphics formats CGM and SVG. Included is a comparison of the formats and the benefits and limitations of both. They slides were part of a webinar, please follow the link to see a recording. https://attendee.gotowebinar.com/recording/9059357153062897153
Don Larson, CEO, will introduce our first webinar of 2018. The subject, very topical, CGM and SVG, we share our latest thoughts and technology relating to the 2D graphic formats.
CGM (Computer Graphics Metafile), is still probably the most widely used non-proprietary 2D graphics format. However, there is a new kid on the block, well not that new, SVG (Scalable Vector Graphic), version 1.0 of SVG was released in 2001.
The webinar will discuss the 3 C’s, Conversion, Compatibility and Compliance. We will share our experiences over the past 12 months, and our development strategy to support the formats.
The ability to view and interact with CGM graphics is a crucial task for many companies and organizations. The ability to view graphics is just one of the requirements, also important is the capability to convert to additional file formats. Also, the facility to print is equally significant, especially to larger format devices, a requirement in the Oil and Gas industry.
David Manock, the VP Sales and Marketing, will introduce and present our latest webinar.
As we build up to the 2018 S1000D User Forum in New Orleans, the timing is probably right to provide a refresher on the requirement for compliant graphics. Join us for an overview of the specification, issue 4.2, what’s new and some considerations when implementing a 2D graphics strategy.
We hope you can attend the event and benefit from our industry knowledge.
Larson's world leading CGM technology enables you to distribute your CGM graphics easily to co-workers, customers, partners and suppliers. The VizEx View family comprises of various products each designed to deliver reliable and quality CGM files. We will also demonstrate our new revolutionary VizEx View HTML5 product, no plug-in required.
Talking Technical Illustration is a new bi-weekly webinar event, your host, David Manock, over 30 years industry experience. We will encourage interaction, Polls, Q & A, comments, share your views with the community. A great opportunity to communicate using the chat function, and we will open the participant microphone on request. Topic: S1000D Illustrations, we will discuss illustration guidelines, hotspots, file formats. etc. We hope you can join the event and make a contribution.
CGM and SVG are currently the most significant file formats in technical illustration. We will discuss the current status of the formats, and make some important announcements with respect to our support of CGM and SVG.
Our popular annual workshop, CGM and SVG is back in 2019. The experience we’ve gained over the past year has been invaluable, especially the conversion from CGM to SVG. We will update the participants on the current status of the two formats and our strategy to support the technology and end-users.
VizEx View HTML5 technology enables the display of CGM graphics in a web browser, without the requirement for a plug-in. Our popular event returns with an introduction to the technology, and the latest news on how we’re improving the technology. The event will be suitable for individuals and organizations who are new to the technology, and current customers. The developers will be on hand to answer technical questions, and explain how the technology is improving under the hood. We hope you can join us for this informative event.
We continue the build-up to the 2018 S1000D User Forum in New Orleans, with Part 2 of the S1000D Compliant Illustrations series.
In Part 2 we focus on interactivity, metadata, inserting and linking graphics. We also discuss file formats, CGM is still the preferred 2D graphics file format, and we cover SVG (Scalable Vector Graphic) not even mentioned in the S1000D specification.
We hope you can attend the event, and benefit from our industry knowledge.
VizEx Edit has complete support available for the WebCGM 2.0 profile, fully S1000D and ATA compliant. Create overlay hotspots, embedded hyperlinks, and link all your drawings together with this standard technology. The toolset includes a powerful feature enabling revision of existing CGM's. Edit line and fill colors, change fonts, reposition objects, or delete them.
The VizEx View HTML5 technology enables the seamless delivery of CGM files in a web environment. The requirement to install an ActiveX control, commonly called plugins, to view CGM files is over! The VizEx View HTML5 technology is a game changer and reinforces Larson's market leadership in the development of CGM related products.
VizEx View HTML5 is the first CGM viewer on the market that does not require a plug-in technology. There are many benefits associated with the technology from an IT and end-user perspective. We will provide an overview of the benefits during the event.
VizEx Transform is a truly unique application enabling the transformation of multiple graphical data formats into CGM in one simple to use interface. The application also has the ability to add hotspot information to the CGM graphics during the transformation process. This is all done using a batch process saving time and money.
The webinar will provide valuable information with respect to the S1000D specification and more specifically the creation and delivery of compliant Technical Illustrations. We will also discuss the use of 3D data and the guidelines provided by the specification.
The creation and delivery of illustrations is a significant component of an S1000D project. There are several factors that require consideration when creating and maintaining illustrations.
Larson is the most powerful montaging tool available in the geoscience industry today. CGM Studio's functionality and feature-rich toolset allow users to quickly and easily createlarge format, high-resolution montages and posters for sophisticated discussions and presentations.
The Evolution of CGM (Computer Graphics Metafile) Viewing. The objective of the workshop is to provide you with all the information required to implement our evolutionary technology.
06-04-2024 - NYC Tech Week - Discussion on Vector Databases, Unstructured Data and AI
Round table discussion of vector databases, unstructured data, ai, big data, real-time, robots and Milvus.
A lively discussion with NJ Gen AI Meetup Lead, Prasad and Procure.FYI's Co-Found
Chatty Kathy - UNC Bootcamp Final Project Presentation - Final Version - 5.23...John Andrews
SlideShare Description for "Chatty Kathy - UNC Bootcamp Final Project Presentation"
Title: Chatty Kathy: Enhancing Physical Activity Among Older Adults
Description:
Discover how Chatty Kathy, an innovative project developed at the UNC Bootcamp, aims to tackle the challenge of low physical activity among older adults. Our AI-driven solution uses peer interaction to boost and sustain exercise levels, significantly improving health outcomes. This presentation covers our problem statement, the rationale behind Chatty Kathy, synthetic data and persona creation, model performance metrics, a visual demonstration of the project, and potential future developments. Join us for an insightful Q&A session to explore the potential of this groundbreaking project.
Project Team: Jay Requarth, Jana Avery, John Andrews, Dr. Dick Davis II, Nee Buntoum, Nam Yeongjin & Mat Nicholas
Unleashing the Power of Data_ Choosing a Trusted Analytics Platform.pdfEnterprise Wired
In this guide, we'll explore the key considerations and features to look for when choosing a Trusted analytics platform that meets your organization's needs and delivers actionable intelligence you can trust.
Enhanced Enterprise Intelligence with your personal AI Data Copilot.pdfGetInData
Recently we have observed the rise of open-source Large Language Models (LLMs) that are community-driven or developed by the AI market leaders, such as Meta (Llama3), Databricks (DBRX) and Snowflake (Arctic). On the other hand, there is a growth in interest in specialized, carefully fine-tuned yet relatively small models that can efficiently assist programmers in day-to-day tasks. Finally, Retrieval-Augmented Generation (RAG) architectures have gained a lot of traction as the preferred approach for LLMs context and prompt augmentation for building conversational SQL data copilots, code copilots and chatbots.
In this presentation, we will show how we built upon these three concepts a robust Data Copilot that can help to democratize access to company data assets and boost performance of everyone working with data platforms.
Why do we need yet another (open-source ) Copilot?
How can we build one?
Architecture and evaluation
06-04-2024 - NYC Tech Week - Discussion on Vector Databases, Unstructured Data and AI
Discussion on Vector Databases, Unstructured Data and AI
https://www.meetup.com/unstructured-data-meetup-new-york/
This meetup is for people working in unstructured data. Speakers will come present about related topics such as vector databases, LLMs, and managing data at scale. The intended audience of this group includes roles like machine learning engineers, data scientists, data engineers, software engineers, and PMs.This meetup was formerly Milvus Meetup, and is sponsored by Zilliz maintainers of Milvus.
Techniques to optimize the pagerank algorithm usually fall in two categories. One is to try reducing the work per iteration, and the other is to try reducing the number of iterations. These goals are often at odds with one another. Skipping computation on vertices which have already converged has the potential to save iteration time. Skipping in-identical vertices, with the same in-links, helps reduce duplicate computations and thus could help reduce iteration time. Road networks often have chains which can be short-circuited before pagerank computation to improve performance. Final ranks of chain nodes can be easily calculated. This could reduce both the iteration time, and the number of iterations. If a graph has no dangling nodes, pagerank of each strongly connected component can be computed in topological order. This could help reduce the iteration time, no. of iterations, and also enable multi-iteration concurrency in pagerank computation. The combination of all of the above methods is the STICD algorithm. [sticd] For dynamic graphs, unchanged components whose ranks are unaffected can be skipped altogether.
Adjusting OpenMP PageRank : SHORT REPORT / NOTESSubhajit Sahu
For massive graphs that fit in RAM, but not in GPU memory, it is possible to take
advantage of a shared memory system with multiple CPUs, each with multiple cores, to
accelerate pagerank computation. If the NUMA architecture of the system is properly taken
into account with good vertex partitioning, the speedup can be significant. To take steps in
this direction, experiments are conducted to implement pagerank in OpenMP using two
different approaches, uniform and hybrid. The uniform approach runs all primitives required
for pagerank in OpenMP mode (with multiple threads). On the other hand, the hybrid
approach runs certain primitives in sequential mode (i.e., sumAt, multiply).
1. Converting and Transforming Technical Graphics
August 19th 2015
11am Eastern Time, USA
Presenters – Don Larson, Larson Software Technology & David Manock, Vizualsite LLC
Welcome to the Informational Webinar
2. www.cgmlarson.com
Copyright Larson Software Technology (c) 2015
Agenda
• Introduction
• Housekeeping
• Company Overview
• Slide Presentation and Demos
• Summary
• Closing Information
3. Webinar: Housekeeping
• All attendees will be muted for the duration of the Webinar
• If you experience problems when joining the webinar please
use the questions function to communicate
• VOIP is the recommended audio option
• It is possible to download handouts during the presentation
• Post questions during the webinar using the panel
• Questions will be answered following the main presentation
or by a follow up email
• Please vote in the interactive Poll,
it is easy and private
• The results will be live!
www.cgmlarson.com
Copyright Larson Software Technology (c) 2105
4. Interactive Polls
www.cgmlarson.com
Copyright Larson Software Technology (c) 2015
• At appropriate times during the webinar we will conduct a
interactive Poll
• The results will immediately follow the vote!
• Questions:
1. What source file formats do you use to generate you technical
technical graphics?
2. Do your graphics require hotspots?
3. What CAD System/s does your company use?
Engage
5. www.cgmlarson.com
Copyright Larson Software Technology (c) 2015
Larson Software Technology
• Based in Houston, Texas
• Founded in 1984, CGM Experts for 30 years
• Develops powerful, innovative CGM graphics software, based on
open standards
• Promoting CGM Usage, VizEx Reader a free CGM and TIFF viewer
• Member of the CGM Open Foundation
• Larson technology simplifies the graphics workflow for Technical
Publications Professionals, Engineers, Geologists, and
Geophysicists.
6. Webinar Objectives
www.cgmlarson.com
Copyright Larson Software Technology (c) 2015
• Provide lessons learned when transforming technical graphics
• Focus on common graphic source formats
• Raster and Vector data
• Describe the data preparation considerations and techniques to
achieve the best results
• Highlight the pitfalls of graphic conversion
• Provide Tips, Benefits, Advice and Knowledge during the webinar
• Summarize the graphic conversion and transformation process
7. Introduction
www.cgmlarson.com
Copyright Larson Software Technology (c) 2015
• The reuse of technical graphics produced in varying formats can
be a significant challenge during the publications production
process
• Different file formats can present different issues and resolutions
• Quality is a major consideration for the source data and output
requirement for publishing
• Using ‘Best Practice’ will reduce production time and costs
8. www.cgmlarson.com
Copyright Larson Software Technology (c) 2015
Today’s Technical Graphics Process
• Technical graphics are usually originated, generated or revised
in a electronic format
• Can also be legacy raster, a scan of a hard copy illustrations
• The most likely starting point for a new technical graphic today
is probably from a CAD system
• This could be a 2D or 3D CAD source data
• Spare part illustrations
• Schematics
• Wiring Diagrams
• Draw from scratch – could be quicker
• Dependent of availability and suitability of CAD data
• Create illustration using a photograph as a template
KNOWLEDGE:
Computer Aided Design is mainly used for
detailed engineering of 3D models and/or 2D
drawings of physical components, but it is also
used throughout the engineering process from
conceptual design and layout of products.
9. www.cgmlarson.com
Copyright Larson Software Technology (c) 2015
Possible Data Sources
• Legacy Hard Copy
• Illustrations on paper or drafting film
• Not very common today but could still exist
• Raster file
• Legacy format
• Scanned line art illustrations
• Intermediate format
• Exported from 3rd party software, CAD possibly
• Photographs a good example
• Vector graphics
• 2D or 3D CAD system
• Many formats are possible and used
• Adobe Illustrator, CorelDRAW
• PDF
• Embedded vector and raster data
KNOWLEDGE:
The word Raster originates from the term
'raster scan,' which was how old CRT
monitors displayed images, by magnetically
steering a concentrated electron beam line
by line to form an image.
KNOWLEDGE:
Vector graphics is the use of geometrical
primitives such as points, lines, curves, and
shapes or polygons—all of which are based
on mathematical expressions—to
represent images in computer graphics.
10. www.cgmlarson.com
Copyright Larson Software Technology (c) 2015
Poll #1
1. What source file formats do you use to generate your
technical graphics?
Raster – Scans of original illustrations
Raster – Intermediate format, raster
from CAD, photographic
Vector – Adobe Illustrator,
PDF or other graphics format
Vector – CAD 2D
Vector – CAD 3D
12. www.cgmlarson.com
Copyright Larson Software Technology (c) 2015
Introduction – Raster Data
• Raster legacy data still plays a significant role in the technical
publications process
• Source – e.g. photographs
• Original – e.g. scanned line art
• Delivery – e.g. TIFF files
• Analysis of raster data can prove to be beneficial
• Optimizing production process
• Raster Data may require enhancements with the addition of
hotspots
• We will examine the possible pitfalls of this process (OCR)
• Raster Data as an intermediate format
• Correct decision at the time but now alternatives could exist?
• Photographic files, intermediate and delivery
13. www.cgmlarson.com
Copyright Larson Software Technology (c) 2015
Hard Copy – Raster Data
• Rare - Hard Copy - The lowest common denominator
• Quality
• Dependent on the storage of the illustrations
• What generation are they? originals or copies
• BENEFIT: If the original or the copy is of good
quality then your going to achieve quality output
• It could be worth investigating if the hard copy is still
available
• TIP: Is a re-scan possible to improve quality
14. www.cgmlarson.com
Copyright Larson Software Technology (c) 2015
Clean-up – Raster Data
• Quality of the legacy scan - Considerations?
• It is unlikely you will be able to improve the quality of a scan apart from
a general clean up
• TIP: clean up scans using the well known raster editors, for
example Adobe Photoshop & Corel Photo-Paint
• The scans sometimes contain sporadic pixels (Noise) not part of the main image
• The pixels can be removed using software functions, for example
• Corel Photo Paint
• Remove Noise
• Adobe Photoshop
• Despeckle
• Dust & Scratches
15. www.cgmlarson.com
Copyright Larson Software Technology (c) 2015
File Formats – Raster Data
• Raster File Formats
• TIFF is the most common raster format for line art scans, usually using a
compression algorithm to reduce the file size
• Other raster formats include:
• JPEG (Joint Photographic Experts Group)
• BMP (Bitmap Image File)
• PNG (Portable Network Graphic)
• PCX (PiCture eXchange)
• GIF (Graphics Interchange Format)
• TIP: Specifications compliance to
S1000D etc.
• Save the TIFF as part of a CGM file
• It will retain its quality and properties
• It can also be combined with Vector data
KNOWLEDGE - TIFF (Tagged Image File Format)
Industry-standard method for storing scanned
and other digital black-and-white, grayscale, and
full-color images. Developed mainly for desktop
publishing, TIFF has found applications in several
other areas such as computer aided design
(CAD), fax transmission. TIFF
saves detailed image information with
each pixel, resulting in a relatively large data file.
16. www.cgmlarson.com
Copyright Larson Software Technology (c) 2015
Properties – Raster Legacy
• DPI (Dots Per Inch) better known as image
resolution
• The DPI is a major factor when determining
the scan quality (300 DPI a good baseline)
• TIP: Right click the file and select Properties
• The smaller the number the lower the quality
• The publishing of the illustration is a major
factor when considering if the DPI is acceptable
• Higher resolution to maintain quality for print
• The display on a laptop screen for example the
DPI can be lower but if the viewing tool can
zoom the user will see deterioration as they
zoom-in
18. www.cgmlarson.com
Copyright Larson Software Technology (c) 2015
Analysis – Raster Legacy
• TIP: If the raster quality is very poor, and the original data is
available consider a re-scan
• If possible consider increasing resolution of output
• (200-300dpi)
• TIP: Evaluate manually re-drawing as a vector illustration
• Assess the longevity of the graphic and its future use
• The cost versus use
• Does the legacy illustration now exist in a CAD format
• If yes, could be repurposed
19. www.cgmlarson.com
Copyright Larson Software Technology (c) 2015
Auto-trace – Raster Legacy
• An alternative to manual re-draw is Auto-Trace
• The two major mass market graphics programs
both have the facility
• CorelDRAW - Centerline Trace
• Adobe Illustrator – Image Trace
• TIP: Perform tests on typical files before
committing to this strategy
• It could be quicker to re-draw
than clean-up the trace
• ADVICE: consider the longevity of
the file how many more revisions
could take place
20. www.cgmlarson.com
Copyright Larson Software Technology (c) 2015
Transforming - Raster Data
• Resizing, rotating etc. impacts the quality of the image
• The technical term is Interpolation
• In basic terms the pixels have to be remapped when transformed
• ADVICE: this can effect the quality of your image
• TIP: Artifact’s of interpolation can be used to improve the
appearance
HaloBlurringAnti-aliasing
21. www.cgmlarson.com
Copyright Larson Software Technology (c) 2015
Intermediate Raster Data
• Raster data can also originate from 3rd party software
• Example's, CAD, Graphics software etc.
• The possible reasons for using raster export:
• The limitation's of the export options
• The limitation's of the import options of target publishing software
• Historical – we’ve always done it that way?
• ADVICE:
• Validate the export settings being used
• Is it possible to increase the DPI of the export?
• Is a vector option available?
22. www.cgmlarson.com
Copyright Larson Software Technology (c) 2015
Intermediate Raster Data - 2
• Photographic data has always played an important role in
publications
• Predominantly used as a maintenance type illustration
• It can be used directly and annotated appropriately
• Alternative, the photograph can be used as a template
• Traced to create line art version
• BENEFIT: Relevant information can be highlighted and be
distinct
24. www.cgmlarson.com
Copyright Larson Software Technology (c) 2015
OCR (Optical Character Recognition)
• The BIG question why OCR a raster technical illustration?
• Primary reason, illustration requires hotspot regions
• OCR is a very good way of achieving a defined region
• Dependency on quality of raster text
• Spare Part illustrations are more likely to have hotspots
• ADVICE: Assess suitability for OCR – is it capable of graphic
hot spotting?
• TIP: Data Analysis Steps:
• Determine if characters sufficiently formed to make OCR viable?
• Best Practice: Test a generic subset of data to determine viability
• Use test results to select the best process
25. www.cgmlarson.com
Copyright Larson Software Technology (c) 2015
OCR (Optical Character Recognition) 2
• Test Passed:
• Convert the whole batch of files using OCR software
• Test Fails:
• There are probably 2 options:
1. Regenerate the required text for the graphic and include hotspot information
2. Manually Hotspot the raster Data (Overlay)
28. www.cgmlarson.com
Copyright Larson Software Technology (c) 2015
Introduction - Vector Data
• Vector Data can be in varied formats
• In the majority of cases it is preferable to Raster Data, mainly for quality reasons
• BENEFIT: Vector Data can be scaled and the quality is maintained
• True both for hard copy and on a computer display
• The display of a vector file, enhanced display by using anti-aliasing
• This ability will be software dependent (Viewer)
• Vector Data Sources, the most common:
• CAD Systems
• General Graphics Software
• PDF
• Technical Writing software
KNOWLEDGE:
Anti-Aliasing (in computer graphics) a
technique used to add greater realism to
a digital image by smoothing jagged
edges on curved lines and diagonals.
30. www.cgmlarson.com
Copyright Larson Software Technology (c) 2015
Poll #3
• What CAD System/s does your company use?
Autodesk
Catia
PTC Creo Parametric (ProE)
Siemens NX - Unigraphics
Solidworks
31. www.cgmlarson.com
Copyright Larson Software Technology (c) 2015
CAD File formats - Vector Data
• CAD File Formats
• 3D Data
• CAD Native files
• DWG native file format for AutoCAD data files
• VRML (Virtual Reality Modeling Language)
• IGES
• STEP (Standard for the Exchange of Product model data)
• ISO 10303 Standard
• 2D Data
• DXF
• DWG
• CGM
• PDF
KNOWLEDGE:
Initial Graphics Exchange Specification (IGES)
is a vendor-neutral file format that allows
the digital exchange of information
among computer-aided design (CAD) systems.
KNOWLEDGE:
Data Exchange File (DXF)
The format is a tagged data representation of all the
information contained in an AutoCAD® drawing file.
33. www.cgmlarson.com
Copyright Larson Software Technology (c) 2015
CAD Data / Takeaways - Vector Data
• Considerations when using CAD files
• File sizes
• 3D files sizes can be challenging
• Select data exchange file formats carefully
• Converted CAD files can contain polylines that increase file size
• Conversion to a 2D file format, for example CGM will provide a more suitable
file for publishing purposes
• Removal of Extraneous Information
• Layers
• Legends
• Text
• The process needs to be automatic to be cost effective
KNOWLEDGE:
Polyline
In computer graphics, a continuous
line composed of one or more
straight line segments.
34. www.cgmlarson.com
Copyright Larson Software Technology (c) 2015
CAD Data / Takeaways - Vector Data 2
• Editing
• Polylines can make the file difficult to edit (not Bezier curves)
• Text can also be sometimes be converted to polylines
• Text mapping can be an issue
• Font substitution
• Character positioning
• ADVICE: Make sure text does not obscure the illustration
• Wiring diagrams can be challenging
• Text in tight areas
35. www.cgmlarson.com
Copyright Larson Software Technology (c) 2015
General Graphics Software - Vector Data
• General Mass Market Graphics Software
• 2D Data
• Adobe Illustrator
• CorelDRAW X7
• Commercial Industry requirements for graphic publishing are
usually satisfied by already available formats
• File Formats
• AI (Adobe Illustrator)
• PDF (Portable Document Format)
• DWG
• SVG (Scalable Vector Graphic)
• Specification driven industries may well require the CGM format
to be valid
• TIP: CorelDraw X7 does support CGM but not the profiles required for
specification compliance
36. www.cgmlarson.com
Copyright Larson Software Technology (c) 2015
Graphics Software Takeaways - Vector Data
• Very good choice of export formats
• PDF is now an open format so good potential to use as archive
• SVG another open format
• ADVICE: SVG probably not a good choice for an archive format
• File sizes
• Very good, usually small and easy to handle
• Good compatibility with publishing software
• ADVICE:
• Do not support the CGM format for compliance with industry
specifications
• Not capable of adding hotspot information used in interactive manuals
• TIP: To be specification compliant save as a TIFF, not ideal
38. www.cgmlarson.com
Copyright Larson Software Technology (c) 2015
Specialist Software Takeaways - Vector Data
• Used in all areas of manufacturing
• Including specification's driven Aerospace and Defense industries
• Support for CGM is a given
• Cost generally higher than general graphics software
• Specific functionality will earn pay back
• Very good choice of import and export formats
• Very good handling of both 2D and 3D files
• Good compatibility with publishing software
• Especially electronic delivery for IETM’s
39. www.cgmlarson.com
Copyright Larson Software Technology (c) 2015
PDF Format - Vector Data
• PDF (Portable Document Format)
• In 2008 PDF became an ISO standard
• ISO International Standard - ISO 32000-1
• All new releases of the format are governed by ISO
• Interoperability was always the mission for PDF,
ISO governance can only strengthen this objective
KNOWLEDGE:
Portable Document Format (PDF)
A file format used to present and exchange
documents reliably, independent of
software, hardware, or operating system.
KNOWLEDGE:
ISO (International Organization for Standardization)
is an independent, non-governmental membership
organization and the world's largest developer of
voluntary International Standards.
40. www.cgmlarson.com
Copyright Larson Software Technology (c) 2015
PDF Format - Vector Data
• PDF was based on PostScript another Adobe technology
• Therefore it does support graphics primitives
• Lines, Bezier curves etc.
• Can also contain raster data
• BENEFIT: You can open a PDF file in different graphics
programs and edit them
• ADVICE: Not all PDF files are creating equal, it is possible
older PDF files will not have a vector structure
• TIP: PDF can be a good export option from a CAD system
42. www.cgmlarson.com
Copyright Larson Software Technology (c) 2015
Technical Writing Software - Vector Data
• Technical Writing Software can contain graphics
• Framemaker
• Arbortext Editor
• oXygen
• ETC.
• This data source is possible
• Unlikely this will be the only source of graphical data
• There are methods of retrieving the data
• The method will vary depending on software
• Raster or Vector Data
43. www.cgmlarson.com
Copyright Larson Software Technology (c) 2015
CGM – Supports Raster and Vector Data
• Another good 2D format to consider is CGM
• CGM (Computer Graphics Metafile)
• An Open Non-Proprietary format
• Actively governed and developed by the CGM Open Foundation
• Ability to contain both Raster and Vector Data and retain attributes
• Specifications compliant, S1000D and ATA
• Interoperable
• Can contain metadata, for example can contain hotspot information
• TIP: Specialist software e.g. VizEx Edit a good choice to
maintain CGM files
44. www.cgmlarson.com
Copyright Larson Software Technology (c) 2015
Summary
• There are many opportunities to source information to produce your
technical graphics
• The number of source formats is diverse
• Selecting the appropriate one can be a challenge
• The primary considerations should be, quality, re-use and publishing
• Ideally choose a format that answers all of these criteria
• Managing more than one file type can cause configuration control issues
• We hope todays webinar has provided information that you found
interesting and above all useful
46. www.cgmlarson.com
Copyright Larson Software Technology (c) 2015
Closing Information
• You can discover more information about
Larson Software Technology at www.cgmlarson.com
• A link to a recording of the webinar will be sent via email
• All the materials will be available:
• www.slideshare.net/donlarson1
• Twitter feed, follow us!
• www.twitter.com/cgmlarson
• Visit us at the S1000D User Forum, San Diego, CA
• 21st-23rd September 2015
• Next Webinar: MacLean Engineering - Case Study - Transform CAD Data
• Friday 0ctober 2nd 10am Central – Part of Manufacturing Day