Download to read offline
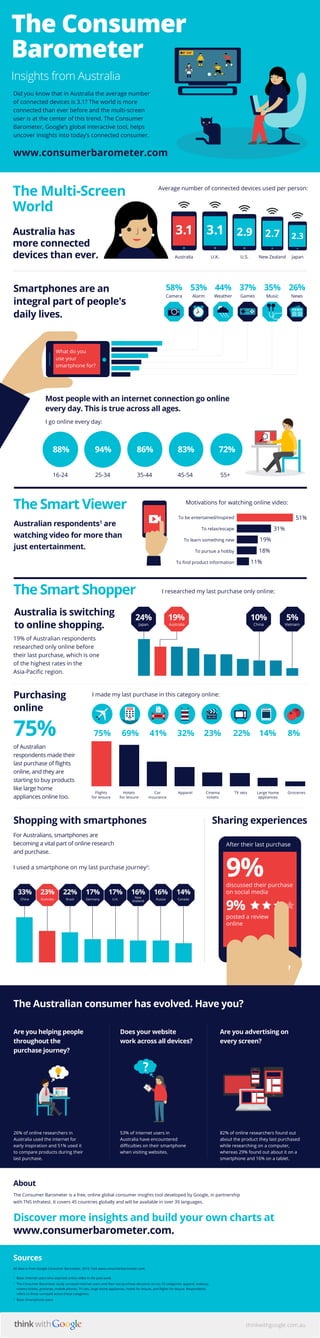

This document discusses smartphone and internet usage trends in Australia based on survey data. It finds that: 1) Australians are heavily reliant on smartphones, with over half using them for activities like alarms, cameras, music, news, and games daily. 2) Most Australians go online every day across all age groups, and the average number of connected devices per person is 3.1. 3) Australians are switching to online shopping, with 19% researching purchases only online which is one of the highest rates in the Asia-Pacific region. They are also buying more product categories like flights and large appliances online.


![[EN].CleverGroup Vietnam Profile 20251202](https://cdn.slidesharecdn.com/ss_thumbnails/en-260120091417-fe6f88ec-thumbnail.jpg?width=640&height=640&fit=bounds)


