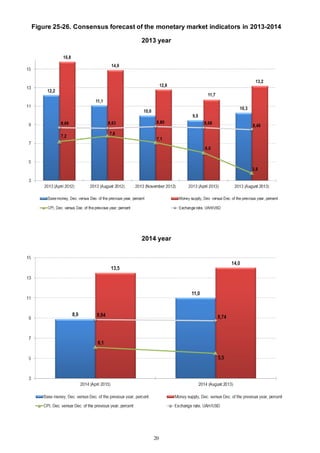
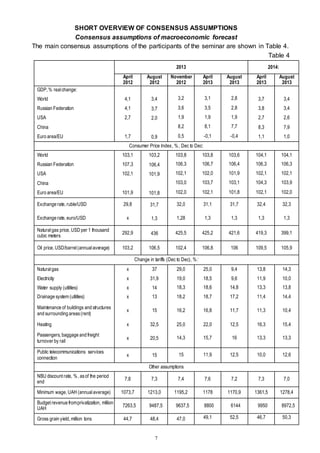
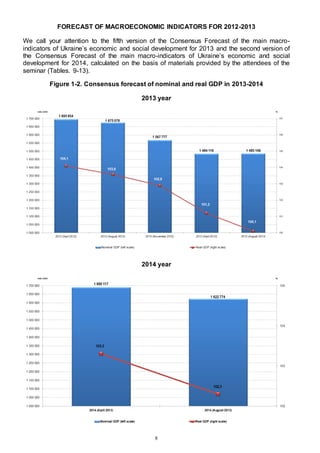
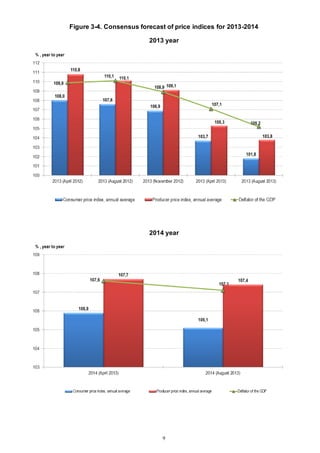
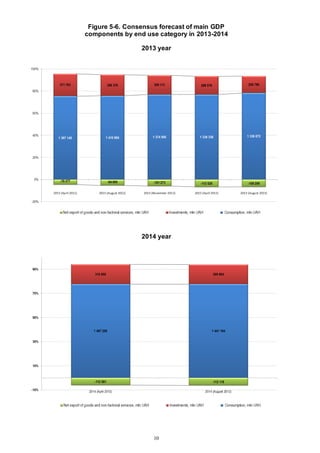
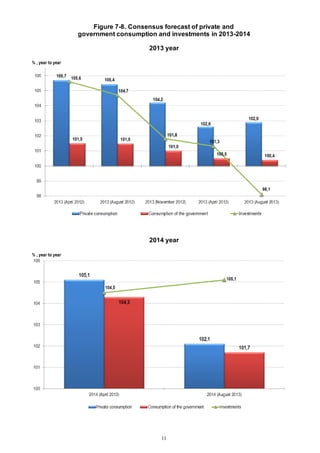
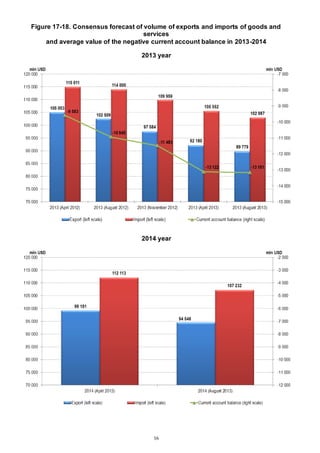
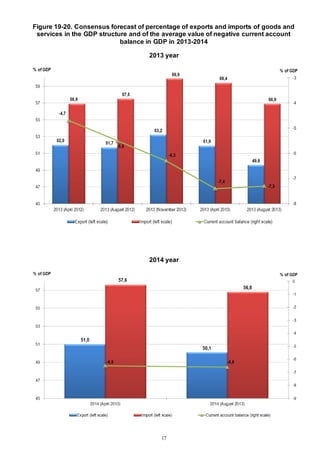
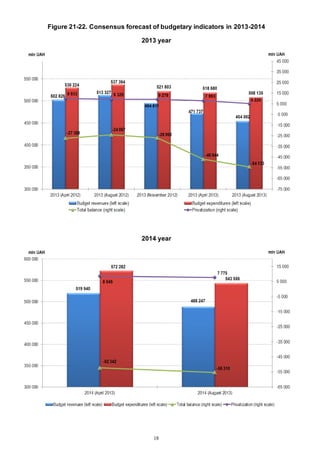
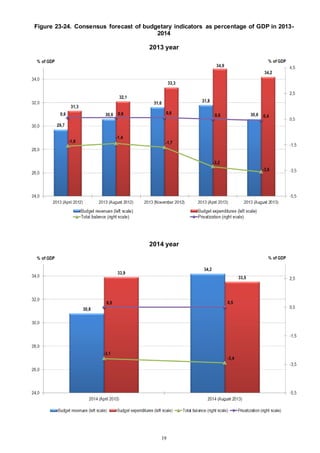
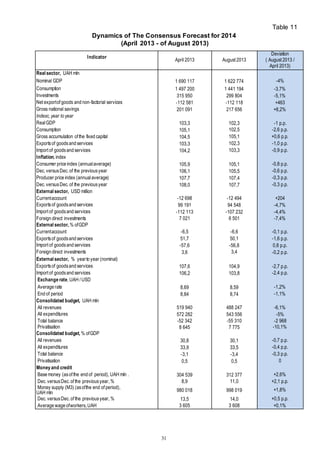
This document presents the consensus forecast for macroeconomic indicators in Ukraine from 2013-2016 as agreed upon by experts from various Ukrainian government institutions, international organizations, research institutes, and private sector organizations. The consensus forecast was developed through a seminar where experts discussed forecasts, economic trends, and research results to reach agreement on key indicators. The document provides the consensus forecasts for GDP growth, inflation, budget balances, trade, currency exchange rates, and other indicators for 2013-2014 in detail and average forecasts for 2015-2016. It also discusses risks to the forecasts for 2013-2014.
Innovation support and economic development at the regional level: panel data...Jan Huňady
Presentation of research paper.
Publication is available at:
https://dx.doi.org/10.14254/2071-8330.2017/10-3/11
Abstract: The paper deals with the problem of innovation support and economic development at the regional level. The innovation potential still differs significantly among the EU regions. Perhaps the key factor determining innovation potential and performance of a region is R&D expenditure. The main aim of the paper is to test the potential relationship between gross domestic expenditure on R&D and economic development of the regions. Our dataset consists of the data on the regions of four Visegrad countries during the period of 2001-2014. We assume the existence of non-linear relationship and expect that R&D expenditures are significantly lower in less developed regions. Using the panel Granger causality and panel regression analysis based on these data, we provide insight into the potential relationship between regional economic development measured in terms of GDP per capita and investments in R&D controlling for the number of R&D employees. Our results strongly suggest that higher regional GDP per capita is associated with higher regional gross domestic expenditure on R&D (GERD) per inhabitant. GERD per capita appears to be exponentially rising with regional GDP per capita. We have also found significant regional disparities in terms of innovation performance.
European tourism growth remains solid at the beginning of the year confirming the continued positive performance of European destinations.
Positive results before the summer period are driven by increased demand from both intra-regional and overseas markets.
These results confirm the sustained upward trend estimated for 2015 and proves the on-going efforts of destinations to fight seasonality.
Quarterly growth and levels of GDP for the UK
CPI 12-month inflation rate for the last 10 years: September 2006 to September 2016
Male and Female Employment Rates in the UK
Non-UK nationals working in the UK labour market
Components of Aggregate Demand in recent years
UK unemployment rates by region, seasonally adjusted, June to August 2016
Average UK house price, January 2005 to August 2016, not seasonally adjusted
Constant price GDP per hour worked for G7 countries, 2000 to 2015
Quarterly growth of GDP and GDP per head for UK
Economic Growth for the UK and the EU(28)
UK Bond Yields during 2016
Sterling Exchange Rate (as an index number)
UK Trade Balances By Sector (% of GDP)
UK Current Account Components (% of GDP)
Contributions to CPI Inflation (%)
This presentation was made by Ioana Burla, Romania, at the 12th Annual Meeting of OECD-CESEE Senior Budget Officials held in Ljubljana, Slovenia, on 28-29 June 2016
Monthly statistical e-bulletin comprising about 30 tables and some charts with the latest available economic/financial market indicators, both Indian and Global.
This paper seeks the main factors behind inflation in Russia over the period 1996–2001. It presents a succinct description of Russian monetary policy and inflation developments. The econometric analysis establishes a long-run relationship between demand for the real money balances on the one side and the real income and short-term interest rate on the other side. It also presents several specifications of modeling shortrun dynamics of inflation. An account is made for the change in the exchange rate regime after the financial crisis of August 1998. It finds that apart from strong inertia, money expansion and exchange rate depreciation played a role in fueling the CPI. However, there were significant shifts in the underlying trends driving inflation during the studied period.
Until 1999 fiscal policy posed the biggest obstacle to the disinflation process in Russia. In 2000–2001 the main responsibility for sustained inflation pressure can be attributed to monetary policy trying to target money supply and exchange rate at the same time. The way out from this policy trap leads through the adoption of one of the so-called 'corner' solutions, i.e. either a permanently fixed exchange rate, or independent monetary policy under a free float regime. Taking into consideration a historically limited credibility of macroeconomic policy and the high level of dollarization, the first variant seems to be a better solution for Russia. However, its implementation would require the accompanying fiscal, banking and other structural reforms creating a healthy policy-mix and flexible microeconomic environment.
Authored by: Marek Dabrowski, Wojciech Paczynski, Łukasz Rawdanowicz
Published in 2002
Epic Research is performing a basic role as a leading financial advisory firm by providing good recommendations for,KLSE Stocks, Comex and Forex and all other segments with the help of experts and it maintains high accuracy.
Roadshow, Öhman Baltic Banking Day, Priit PerensSwedbank
Swedbank was founded in 1820, as Sweden’s first savings bank was established. Today, our heritage is visible in that we truly are a bank for each and every one and in that we still strive to contribute to a sustainable development of society and our environment. We are strongly committed to society as a whole and keen to help bring about a sustainable form of societal development. Our Swedish operations hold an ISO 14001 environmental certification, and environmental work is an integral part of our business activities.
Trade analytics of Switzerland and Jordan major ImportsSuyash Sharma
Analysis of key sectors and products on the basis of value and quantity. The various considerations and macroeconomic policies have been detailed to show the trend and the relative co-relation between them.
- Country Overview
- Product Wise Analysis (Switzerland)
- Product Wise Analysis (Jordan)
Український інститут майбутнього (UIF) провів велику презентацію нової програми «Трильйон доларів для України» за участі її керівника та експерта UIF Андрія Ілларіонова.
Matti Schneider - How public action gets digitalAgile Lietuva
Software eats the world, data is the oil of the XXIst century… yet, assessing my retirement pension online is still a pain. And I'm pretty sure I already filled in that form six months ago!
Why aren't public services as easy to use as AirBnB? What would happen if civil society could use their APIs? Or if one made pull requests on them?
In this session, I will talk you through remarkable examples of government services digital transformation, and highlight what they have in common. Spoiler: it is always about being more open, more collaborative, and more trustful. Did you say more “agile”?
I will illustrate these points with the French beta.gouv.fr initiative, in which we use digital, agile and lean culture to deliver high-quality digital public services that change the relationship between citizens and the administration.
This presentation provides an overview of Greek international trade. Included are Greece's top trading partners in goods and services as, well as highlighting the current trade with the Balkans region.
This forecast was done in a highly volatile environment and under assumptions that may not turn out to be true. We assume most of the economic activity restrictions to be lifted by the end of the second quarter. We expect substantial damage to the economy from domestic restrictions and lower external demand. A gradual recovery is expected in the second half of 2020, but economic activity will remain lower than the pre-crisis level. We project real GDP to fall by 5.9% in 2020. Consumer inflation is forecasted to accelerate only to 7.5% yoy in December as weak demand will limit the impact of higher inflation expectations and weaker hryvnia. We used UAH 28.7 per USD as an average 2020 exchange rate in forecast calculations.
This dissertation as for an integrated approach to optimize the financing of projects for the construction of real estate acquisition and improvement of land, real estate, corporate loans and other persons in the land market, primary and secondary real estate markets using econometric, econometric models, optimization methods and systems approach.
"Impact of front-end architecture on development cost", Viktor TurskyiFwdays
I have heard many times that architecture is not important for the front-end. Also, many times I have seen how developers implement features on the front-end just following the standard rules for a framework and think that this is enough to successfully launch the project, and then the project fails. How to prevent this and what approach to choose? I have launched dozens of complex projects and during the talk we will analyze which approaches have worked for me and which have not.
Builder.ai Founder Sachin Dev Duggal's Strategic Approach to Create an Innova...Ramesh Iyer
In today's fast-changing business world, Companies that adapt and embrace new ideas often need help to keep up with the competition. However, fostering a culture of innovation takes much work. It takes vision, leadership and willingness to take risks in the right proportion. Sachin Dev Duggal, co-founder of Builder.ai, has perfected the art of this balance, creating a company culture where creativity and growth are nurtured at each stage.
Search and Society: Reimagining Information Access for Radical FuturesBhaskar Mitra
The field of Information retrieval (IR) is currently undergoing a transformative shift, at least partly due to the emerging applications of generative AI to information access. In this talk, we will deliberate on the sociotechnical implications of generative AI for information access. We will argue that there is both a critical necessity and an exciting opportunity for the IR community to re-center our research agendas on societal needs while dismantling the artificial separation between the work on fairness, accountability, transparency, and ethics in IR and the rest of IR research. Instead of adopting a reactionary strategy of trying to mitigate potential social harms from emerging technologies, the community should aim to proactively set the research agenda for the kinds of systems we should build inspired by diverse explicitly stated sociotechnical imaginaries. The sociotechnical imaginaries that underpin the design and development of information access technologies needs to be explicitly articulated, and we need to develop theories of change in context of these diverse perspectives. Our guiding future imaginaries must be informed by other academic fields, such as democratic theory and critical theory, and should be co-developed with social science scholars, legal scholars, civil rights and social justice activists, and artists, among others.
GraphRAG is All You need? LLM & Knowledge GraphGuy Korland
Guy Korland, CEO and Co-founder of FalkorDB, will review two articles on the integration of language models with knowledge graphs.
1. Unifying Large Language Models and Knowledge Graphs: A Roadmap.
https://arxiv.org/abs/2306.08302
2. Microsoft Research's GraphRAG paper and a review paper on various uses of knowledge graphs:
https://www.microsoft.com/en-us/research/blog/graphrag-unlocking-llm-discovery-on-narrative-private-data/
Let's dive deeper into the world of ODC! Ricardo Alves (OutSystems) will join us to tell all about the new Data Fabric. After that, Sezen de Bruijn (OutSystems) will get into the details on how to best design a sturdy architecture within ODC.
Dev Dives: Train smarter, not harder – active learning and UiPath LLMs for do...UiPathCommunity
💥 Speed, accuracy, and scaling – discover the superpowers of GenAI in action with UiPath Document Understanding and Communications Mining™:
See how to accelerate model training and optimize model performance with active learning
Learn about the latest enhancements to out-of-the-box document processing – with little to no training required
Get an exclusive demo of the new family of UiPath LLMs – GenAI models specialized for processing different types of documents and messages
This is a hands-on session specifically designed for automation developers and AI enthusiasts seeking to enhance their knowledge in leveraging the latest intelligent document processing capabilities offered by UiPath.
Speakers:
👨🏫 Andras Palfi, Senior Product Manager, UiPath
👩🏫 Lenka Dulovicova, Product Program Manager, UiPath
LF Energy Webinar: Electrical Grid Modelling and Simulation Through PowSyBl -...DanBrown980551
Do you want to learn how to model and simulate an electrical network from scratch in under an hour?
Then welcome to this PowSyBl workshop, hosted by Rte, the French Transmission System Operator (TSO)!
During the webinar, you will discover the PowSyBl ecosystem as well as handle and study an electrical network through an interactive Python notebook.
PowSyBl is an open source project hosted by LF Energy, which offers a comprehensive set of features for electrical grid modelling and simulation. Among other advanced features, PowSyBl provides:
- A fully editable and extendable library for grid component modelling;
- Visualization tools to display your network;
- Grid simulation tools, such as power flows, security analyses (with or without remedial actions) and sensitivity analyses;
The framework is mostly written in Java, with a Python binding so that Python developers can access PowSyBl functionalities as well.
What you will learn during the webinar:
- For beginners: discover PowSyBl's functionalities through a quick general presentation and the notebook, without needing any expert coding skills;
- For advanced developers: master the skills to efficiently apply PowSyBl functionalities to your real-world scenarios.
Key Trends Shaping the Future of Infrastructure.pdfCheryl Hung
Keynote at DIGIT West Expo, Glasgow on 29 May 2024.
Cheryl Hung, ochery.com
Sr Director, Infrastructure Ecosystem, Arm.
The key trends across hardware, cloud and open-source; exploring how these areas are likely to mature and develop over the short and long-term, and then considering how organisations can position themselves to adapt and thrive.
The Art of the Pitch: WordPress Relationships and SalesLaura Byrne
Clients don’t know what they don’t know. What web solutions are right for them? How does WordPress come into the picture? How do you make sure you understand scope and timeline? What do you do if sometime changes?
All these questions and more will be explored as we talk about matching clients’ needs with what your agency offers without pulling teeth or pulling your hair out. Practical tips, and strategies for successful relationship building that leads to closing the deal.
AI for Every Business: Unlocking Your Product's Universal Potential by VP of ...
"Ukraine: New perspectives of the development" - Consensus 2013 august
1. 1
MINISTRY OF ECONOMIC DEVELOPMENT AND TRADE OF UKRAINE
United Nations Development
Programme in Ukraine (UNDP)
GI “Institute of Economics and
Forecasting of the National Academy
of Sciences of Ukraine”
Scientific and Research Economic
Institute (SREI)
Institute of Economic Research and
Policy Consulting
The National Institute for Strategic
Studies
Institute of Evolutionary Economics
G. M. Dobrov Center for Studying
R&D Potential and Science History
Federation of employers of Ukraine
Taras Shevchenko National
Universityof Kyiv
Representative of the International
MonetaryFund in Ukraine
International Centre of Policy Studies
CASE Ukraine
Raiffeisen Bank Aval
Dragon Capital
The Bleyzer Foundation
FOREX CLUB in Ukraine
Ukraine:
perspectives of the
development
CONSENSUS FORECAST
Issue 33,
2013
3. 3
CONTENTS
MAIN MACROECONOMIC INDICATORS FOR 2007-2012 4
DYNAMICS OF THE CONSENSUS FORECAST FOR 2010-2012 5
SHORT OVERVIEW OF CONSENSUS ASSUMPTIONS 7
FORECAST OF MACROECONOMIC INDICATORS FOR 2013-2014 8
FORECAST OF MACROECONOMIC INDICATORS FOR 2015-2016
(AVERAGE)
21
RISKS FOR 2013-2014 22
TABLES 27
Consensus Forecast is an "averaged" value of the most important forecast economic
development indicators of Ukraine calculated on the basis of expert estimates provided by
participants of the Consensus Forecast survey. The consensus forecast for 2013-2014
presented in the publication has been calculated on the basis of materials provided by the
experts of the Ministry of Economic Development and Trade of Ukraine, GI “Institute of
Economics and Forecasting of the National Academy of Sciences of Ukraine”, Economic
Research Institute, Institute of Economic Research and Policy Consulting, National Institute
for Strategic Studies, Institute of Evolutionary Economics, G. M. Dobrov Center for
Studying R&D Potential and Science History, Federation of employers of Ukraine, Taras
Shevchenko National University of Kyiv, Representative of the International Monetary Fund
in Ukraine, International Centre for Policy Studies, CASE Ukraine, Raiffeisen Bank Aval,
The Bleyzer Foundation, Dragon Capital and FOREX CLUB in Ukraine.
The Consensus Forecast is based on the consultations and discussions with the
experts. We would like to highlight that all the forecast indicators presented by the
participants of the seminar are only independent expert estimates and not official
forecasts of the relevant institutions.
We express deep gratitude to all the experts who participated in the Consensus Forecast
initiative.
4. 4
Table 1
MAIN MACROECONOMIC INDICATORS FOR 2007-2012
Indicator 2007 2008 2009 2010 2011 2012
Real sector, UAH mln
Nominal GDP 720 731 948 056 913 345 1 082 569 1 302 079 1 408 889
Consumption 558 581 758 902 772 826 914 230 1 113 008 1 269 601
Investments 203 318 264 883 155 815 199 918 270 019 2570335
Net exportof goods and non-factorial services -41 168 -75 729 -15 296 -31 579 -80 948 -118 047
Index, year to year
Actual GDP 107,9 102,3 85,2 104,1 105,2 100,2
Consumption 113,6 110,1 87,8 106,4 111,1 109,6
Gross accumulation of the fixed capital 123,9 98,8 49,5 103,9 107,1 100,9
Exportsof goodsand services 103,3 105,7 78,0 103,9 104,3 92,3
Imports of goodsand services 121,5 117,0 61,1 111,3 117,7 101,9
Inflation, index
Consumer price index (annualaverage) 112,8 125,2 115,9 109,4 108,0 100,6
Dec. versusDec. of the previousyear 116,6 122,3 112,3 109,1 104,6 99,8
Producer price index (annualaverage) 119,5 135,5 106,5 120,9 119,0 103,7
Dec. versusDec. of the previousyear 123,3 123,0 114,3 118,7 114,2 100,3
External sector, USD mln
Currentaccount -5 272 -12 763 -1 732 -3 018 -10 245 -14 761
Exportsof goodsand services 64 001 85 612 54 253 69 255 88 844 89 768
Imports of goodsand services 72 153 99 962 56 206 73 239 99 001 -104 540
Foreign direct investments 9 218 9 903 4 654 5 759 7 015 6 627
External sector, USD mln
Currentaccount -3,7 -7,1 -1,5 -2,2 -6,3 -8,4
Exportsof goodsand services 44,8 47,6 46,3 50,8 54,5 50,9
Imports of goodsand services 50,6 55,6 47,9 53,7 60,8 59,3
Foreign direct investments 6,5 5,5 4,0 4,2 4,3 3,8
External sector, % yearto year (nominal)
Exportsof goodsand services 127,4 133,8 63,4 127,7 128,3 101
Imports of goodsand services 135,4 138,5 56,2 130,3 135,2 105,6
Rate of exchange, UAH/USD
Average 5,05 5,27 7,79 7,94 7,97 7,99
End of period 5,05 7,70 7,99 7,96 7,99 7,99
Consolidated budget, UAH mln
All revenues 219 939 297 845 272 967 314 506 398 554 445 525
All expenditures(including lending) 227 610 312 028 310 225 379 191 421 612 492 454
Total balance -7 671 -14 183 -37 258 -64 685 -23 058 -46 929
Privatisation 2 459 482 808 1 093 11 480 6 763
Consolidated budget, % ofGDP
All revenues 30,5 31,4 29,9 29,1 30,6 31,6
All expenditures(including lending) 31,6 32,9 34,0 35,0 32,3 35,0
Total balance -1,1 -1,5 -4,1 -5,9 -1,8 -3,3
Privatisation 0,3 0,05 0,1 0,1 0,9 0,5
Money and credit
Base money (asof the end of period), UAH mln 141 901 186 671 194 965 225 692 239 885 255 283
Dec. versusDec. of the previousyear, % 46,0 31,6 4,4 15,8 6,3 6,4
Money Supply (M3) (asofthe end of period),
UAH mln
396 156 515 727 487 298 597 872 685 515 773 199
Dec. versusDec. of the previousyear, % 51,7 30,2 -5,5 22,7 14,7 12,8
Monthly average wage of workers, UAH 1 351 1 806 1 906 2 239 2 633 3 025
Nominal adjusted tothe CPI, % to previousyear 115,0 106,8 91,0 109,7 108,9 114,4
5. 5
Table 2
DYNAMICS OF THE CONSENSUS FORECAST FOR 2011
(March 2010 – November 2011)
Indicator
2011
report
March
2010
Deviation
(March
2010 / Report
2011)
March
2011
Deviation
(March
2011 / Report
2011)
November
2011
Deviation
(November
2011 / Report
2011)
Real sector, UAH mln
Nominal GDP 1 302 079 1 244 736 -4,4% 1 268 997 -2,5% 1 294 550 -0,6%
Consumption 1 113 008 1 004 024 -9,8% 1 050 248 -5,6% 1 085 719 -2,5%
Investments 270 019 254 540 -5,7% 257 366 -4,7% 262 502 -2,8%
Net exportof goods and non-factorial
services
-80 948 -16 431 +64 517 -36 431 +44 517 -55 688 +25 260
Index, year to year
Actual GDP 105,2 104,7 -0,5 p.p. 104,6 -0,6 p.p. 104,7 -0,5 p.p.
Consumption 111,1 104,5 -6,6 p.p. 104,3 -6,8 p.p. 107,1 -4,0 p.p.
Investments 107,1 109,3 +2,2 p.p. 111,3 4,2 p.p. 110,8 +3,7 p.p.
Inflation, index
Consumer price index (annualaverage) 108,0 110,6 +2,6 p.p. 110,3 +2,3 p.p. 109,2 +1,2 p.p.
Dec. versusDec. of the previousyear 104,6 110,1 +5,5 p.p. 111,1 +6,5 p.p. 109,0 +4,4 p.p.
Producer price index (annualaverage) 119,0 111,5 -7,5 p.p. 116,3 -2,7 p.p. 118,5 -0,5 p.p.
Dec. versusDec. of the previousyear 114,2 111,1 -3,1 p.p. 116,5 +2,3 p.p. 119,6 +5,4 p.p.
External sector, USD mln
Currentaccount -10 245 -999 +9246 -3 650 +6595 -6 305 +3940
Exportsof goodsand services 88 844 68 924 -22,4% 80 627 -9,2% 86 038 -3,2%
Imports of goodsand services 99 001 70 942 -28,3% 85 178 -14,0% 93 112 -5,9%
Foreign direct investments 7 015 6 628 +16 873 6 348 +16 593 5 908 +16 153
External sector, % of GDP
Currentaccount -6,3 -0,7 +5,6% -2,3 -7,9% -3,9 +4,0
Exportsof goodsand services 54,5 45,4 -9,1% 50,5 -4,0% 53,0 -1,5%
Exportsof goodsand services 60,8 46,8 -14,0% 53,4 -7,4% 57,4 -3,4%
Foreign direct investments 4,3 4,4 +0,1% 4,0 -0,3% 3,6 -0,7%
External sector, % yearto year (nominal)
Exportsof goodsand services 128,3 111,9 -16,4 p.p. 117,8 -10,5 p.p. 126,4 -1,9 p.p.
Exportsof goodsand services 135,2 112,4 -22,8 p.p. 117,9 -17,3 p.p. 129,4 -5,8 p.p.
Rate of exchange, UAH/USD
Average 7,97 8,20 +2,9% 7,95 -0,3% 7,98 +0,1%
End of period 7,99 8,23 +3,0% 8,00 +0,1% 8,06 +0,9%
Consolidated budget, UAH mln
All revenues 398 554 377 835 -5,2% 372 637 -6,5% 393 352 -1,3%
All expenditures(including lending) 421 612 413 808 -1,8% 419 387 -0,5% 427 358 +1,4%
Total balance -23 058 -35 973 -12 915 -46 750 -23 692 -34 006 -10 948
Privatisation 11 480 4 648 -6 832 10 683 -797 10 396 -1 084
Consolidated budget, % ofGDP
All revenues 30,6 30,4 -0,2 p.p. 29,4 -1,2 p.p. 30,4 -0,2 p.p.
All expenditures(including lending) 32,3 33,2 +0,9 p.p. 33,0 +0,7 p.p. 33,0 +0,7 p.p.
Total balance -1,8 -2,9 -1,1 p.p. -3,7 -1,9 p.p. -2,6 -0,8 p.p.
Privatisation 0,9 0,4 -0,5 p.p. 0,8 -0,1 p.p. 0,8 -0,1 p.p.
Money and credit
Base money (asof the end of period),
UAH mln
239 885 225 126 -6,2% 258 721 +7,9% 253 519 +5,7%
Dec. versusDec. of the previousyear, % 6,3 14,6 +8,3 p.p. 14,3 +8,0 p.p. 11,4 +5,1 p.p.
Money Supply (M3) (asofthe end of period),
UAH mln
685 515 575 552 -16,0% 706 572 +3,1% 699 363 +2,0%
Dec. versusDec. of the previousyear, % 14,7 17,0 +2,3 p.p. 18,5 +3,8 p.p. 16,8 +2,1 p.p.
Monthly average wage of workers, UAH 2 633 2 248 -14,6% 2 523 -4,2% 2 651 +0,7%
6. 6
Table 2
DYNAMICS OF THE CONSENSUS FORECAST FOR 2012
(March 2011 – November 2012)
Indicator
2012
report
March
2012
Deviation
(March
2011 / Report
2012)
April
2012
Deviation
(April
2012 / Report
2012)
November
2012
Deviation
(November
2012 / Report
2012)
Real sector, UAH mln
Nominal GDP 1 408 889 1 490 776 +5,8% 1 479 807 +5,0% 1 422 682 +1,0%
Consumption 1 269 601 1 223 531 -3,6% 1 233 219 -2,9% 1 232 248 -2,9%
Investments 257 335 325 159 +26,4% 329 075 +27,9% 276 889 +7,6%
Net exportof goods and non-factorial services -118 047 -42 886 +75 161 -82 551 +35 496 -101 689 +16 358
Index, year to year
Actual GDP 100,2 105,1 +4,9 p.p. 103,2 +3,0 p.p. 101,0 +0,8 p.p.
Consumption 109,6 105,1 -4,5 p.p. 104,6 -5,0 p.p. 106,6 -3,0 p.p.
Investments 100,9 110,2 +9,3 p.p. 104,2 +3,3 p.p. 95,7 -5,2 p.p.
Inflation, index
Consumer price index (annualaverage) 100,6 109,6 +9,0 p.p. 105,3 +4,7 p.p. 102,3 +1,7 p.p.
Dec. versusDec. of the previousyear 99,8 109,2 +9,4 p.p. 108,0 +8,2 p.p. 103,6 +3,8 p.p.
Producer price index (annualaverage) 103,7 113,2 +9,5 p.p. 108,6 +4,9 p.p. 105,8 +2,1 p.p.
Dec. versusDec. of the previousyear 100,3 112,7 +12,4 p.p. 110,5 +10,2 p.p. 106,1 +5,8 p.p.
External sector, USD mln
Currentaccount -14 761 -4 354 +10407 -9657 +5 104 -12 085 2 676
Exportsof goodsand services 89 768 90 980 +1,4% 105 003 +17,0% 90 353 +0,7%
Imports of goodsand services -104 540 -96 386 -7,8% -115 011 +10,0% -103 775 -0,7%
Foreign direct investments 6 627 6 510 -117 6 070 -557 5 993 -634
External sector, % of GDP
Currentaccount -8,4 -2,3 +6,1 p.p. -5,3 +3,1 p.p. -6,9 +1,5 p.p.
Exportsof goodsand services 50,9 48,8 -2,1 p.p. 52,2 +1,3 p.p. 51,5 +0,6 p.p.
Exportsof goodsand services 59,3 51,7 -7,6 p.p. 57,7 -1,6 p.p. -58,9 -118,2 p.p.
Foreign direct investments 3,8 1,9 -1,9 p.p. 3,3 -0,5 p.p. 3,4 -0,4 p.p.
External sector, % yearto year (nominal)
Exportsof goodsand services 101 112,8 +11,8 p.p. 110,1 +9,1 p.p. 102,2 +1,2 p.p.
Exportsof goodsand services 105,6 113,0 +7,4 p.p. 110,5 +4,9 p.p. 105,3 -0,3 p.p.
Rate of exchange, UAH/USD
Average 7,99 8,03 +0,5% 8,10 +1,4% 8,08 +1,1%
End of period 7,99 8,04 +0,6% 8,34 +4,4% 8,41 +5,3%
Consolidated budget, UAH mln
All revenues 445 525 434 066 -2,6% 439 922 -1,3% 439 075 -1,4%
All expenditures(including lending) 492 454 470 510 -4,5% 470 237 -4,5% 474 645 -3,6%
Total balance -46 929 -36 444 -22,3% -30 315 -35,4% -35 570 -24,2%
Privatisation 6 763 7 392 +9,3% 9 500 +40,5% 8 274 +22,3%
Consolidated budget, % ofGDP
All revenues 31,6 29,0 -2,6 p.p. 29,7 -2,6 p.p. 30,9 -0,7 p.p.
All expenditures(including lending) 35,0 31,5 -3,5 p.p. 31,8 -3,5 p.p. 33,4 -1,6 p.p.
Total balance -3,3 -2,4 +0,9 p.p. -2,0 +0,9 p.p. -2,5 +0,8 p.p.
Privatisation 0,5 0,5 0 0,6 0 0,6 +0,1 p.p.
Money and credit
Base money (asof the end of period), UAH
mln
255 283 292 104 +14,4% 266 850 +4,5% 264 521 +3,6%
Dec. versusDec. of the previousyear, % 6,4 14,1 +7,7 p.p. 11,2 +4,8 p.p. 10,3 +3,9 p.p.
Money Supply (M3) (asofthe end of period),
UAH mln
773 199 837 415 +8,3% 748 349 -3,2% 758 169 -1,9%
Dec. versusDec. of the previousyear, % 12,8 18,4 5,6 p.p. 9,2 -3,6 p.p. 10,6 -2,2 p.p.
Monthly average wage of workers, UAH 3 025 2 853 -5,7 3 386 +11,9% 3 040 +0,5%
7. 7
SHORT OVERVIEW OF CONSENSUS ASSUMPTIONS
Consensus assumptions of macroeconomic forecast
The main consensus assumptions of the participants of the seminar are shown in Table 4.
Table 4
2013 2014:
April
2012
August
2012
November
2012
April
2013
August
2013
April
2013
August
2013
GDP, % realchange:
World 4,1 3,4 3,2 3,1 2,8 3,7 3,4
Russian Federation 4,1 3,7 3,6 3,5 2,8 3,8 3,4
USA 2,7 2,0 1,9 1,9 1,9 2,7 2,6
China 8,2 8,1 7,7 8,3 7,9
Euro area/EU 1,7 0,9 0,5 -0,1 -0,4 1,1 1,0
Consumer Price Index, %, Dec to Dec:
World 103,1 103,2 103,8 103,8 103,6 104,1 104,1
Russian Federation 107,3 106,4 106,3 106,7 106,4 106,3 106,3
USA 102,1 101,9 102,1 102,0 101,9 102,1 102,1
China 103,0 103,7 103,1 104,3 103,9
Euro area/EU 101,9 101,8 102,0 102,1 101,8 102,1 102,0
Exchange rate, ruble/USD 29,8 31,7 32,0 31,1 31,7 32,4 32,3
Exchange rate, euro/USD х 1,3 1,28 1,3 1,3 1,3 1,3
Naturalgas price, USD per 1 thousand
cubic meters
292,9 436 425,5 425,2 421,6 419,3 399,1
Oil price, USD/barrel(annualaverage) 103,2 106,5 102,4 106,8 106 109,5 105,9
Change in tariffs (Dec to Dec), %:
Naturalgas х 37 29,0 25,0 9,4 13,8 14,3
Electricity х 31,9 19,0 18,5 9,6 11,9 10,0
Water supply (utilities) х 14 18,3 18,6 14,8 13,3 13,8
Drainage system (utilities) х 13 18,2 18,7 17,2 11,4 14,4
Maintenance of buildings and structures
and surrounding areas(rent)
х 15 16,2 16,8 11,7 11,3 10,4
Heating х 32,5 25,0 22,0 12,5 16,3 15,4
Passengers, baggage and freight
turnover by rail
х 20,5 14,3 15,7 16 13,3 13,3
Public telecommunications services
connection
х 15 15 11,9 12,5 10,0 12,6
Other assumptions
NBU discount rate, %, asof the period
end
7,8 7,3 7,4 7,6 7,2 7,3 7,0
Minimum wage, UAH (annualaverage) 1073,7 1213,0 1195,2 1178 1170,9 1361,5 1278,4
Budget revenue fromprivatization, million
UAH
7263,5 9487,5 9637,5 8800 6144 9950 8972,5
Gross grain yield, million tons 44,7 48,4 47,0 49,1 52,5 46,7 50,3
8. 8
FORECAST OF MACROECONOMIC INDICATORS FOR 2012-2013
We call your attention to the fifth version of the Consensus Forecast of the main macro-
indicators of Ukraine’s economic and social development for 2013 and the second version of
the Consensus Forecast of the main macro-indicators of Ukraine’s economic and social
development for 2014, calculated on the basis of materials provided by the attendees of the
seminar (Tables. 9-13).
Figure 1-2. Consensus forecast of nominal and real GDP in 2013-2014
2013 year
2014 year
15. 15
Figure 15-16. Consensus forecast of net influx of foreign direct investments in 2013-
2014
2013 year
2014 year
16. 16
Figure 17-18. Consensus forecast of volume of exports and imports of goods and
services
and average value of the negative current account balance in 2013-2014
2013 year
2014 year
17. 17
Figure 19-20. Consensus forecast of percentage of exports and imports of goods and
services in the GDP structure and of the average value of negative current account
balance in GDP in 2013-2014
2013 year
2014 year
21. 21
FORECAST OF MACROECONOMIC INDICATORS FOR 2015-2016 (AVERAGED)
A forecast of basic macroeconomic indicators for the period from 2015 through 2016 has
been presented for the second time (Table 13).
In the medium term forecasting of macroeconomic indicators the experts have no common
vision for the country development. Thus, significant differences in the forecast there are both
in indicators and their components.
Consensus estimates for economic growth in Ukraine on average in the years 2015-2016 is
4.3%. But the difference between the minimum and maximum value quite significant - 2.5
percentage points (range from 3% to 5.5%).
Basically, it is assumed that the main lever of economic growth will be expanding private
consumption: the average value of real growth in private consumption 7%. But this
component variation is even more significant – 8.3 percentage points (from 4.2% to 12.5%).
According to experts rather modestly increase general government spending (consensus
estimate of real growth in public consumption is 3.5%). But on this component specialists
also have quite different estimates - a variation ranging from 1.7% to 6.4%).
Much of the uncertainty in the predictions is observed and the investment component -
average rate of real investment demand is 6,3%, but the variation reaches 5,5 percentage
points (from 2.8% to 8.3%). This indicates a different vision for the country in terms of
modernization, improving scientific and technological potential and strengthen
competitiveness.
For the price situation, the expert opinion here differs significantly. In general, experts predict
maintenance of relatively low inflation in the medium term: the average forecast consumer
price index and producer price index (annual average) of 106% and 109.7%. But the
difference between the minimum and maximum predicted values is also significant –
3.6 percentage points (variation of the consumer price index from 104.6% to 108.2%) and
11.2 percentage points (variation of the index of producer prices from 105.5% to 116.7%),
respectively.
No consensus can be seen in medium-term forecast estimates of foreign trade development.
In particular, current account balance estimates vary between minus 2.8% to minus 6.7% of
GDP. The averaged value of goods and services export growth is 7.1% (minus 3.3 – growth
11% variation), that for import being also 5.2% (minus 7.6 - 9.9% variation).
However, the parameters of the exchange rate policy relatively similar. Forecasts for average
annual exchange rate of hryvnia to US dollar for 2015-2016 vary within 8.45-9.2 UAH/USD
(averaged value being UAH/USD 8.79).
A less common position of experts also in the public sector: expexted that budget spending
will be greater than revenue in the medium term (averaged value of budget deficit is expected
to be 2.6% of GDP for 2015-2016, maximal value being 3.3% of GDP).
22. 22
Risks for 2013-2014
We offer you a consensus assessment of risks for 2013-2014.
The experts assessed the risks by 2 criteria: probability of realisation of a specific risk and
impact of the risk on the economy of Ukraine.
The realisation of risks and their impact on the Ukrainian economy have been assessed
according to the following scale:
Probability of occurrence realization estimates
Estimates of the occurrence
impact on the economy of
Ukraine
considerable probability (50-60%%) of risk display – 4;
medium probability (30-49%%) of risk display – 3;
moderate probability (10-29%%) of risk display – 2;
small probability (under 10%) of risk display – 1;
the risk is not probable – 0.
significant impact – 4;
moderate impact – 3;
small impact – 2;
insignificant impact – 1;
no impact – 0.
Based on the materials provided, an integral estimate of risks was calculated as a sum of
occurrence probability estimates and occurrence impact on the economy of Ukraine weighed
by the number of respondents.
Risks for 2013 were estimated for the fifth time whereas risks for 2014 were estimated for the
second time. The highest possible consensus estimate of foreign and domestic risks has the
integral estimate 16.
It is foreign risks that have appeared among leading ones in 2013: deficit of external funding
and shrinkage of possibilities of access to the international capital markets and failure to
obtain planned financing from the IMF (integral estimate 12), curtailing of investment plans
by foreign companies or postponement of their realization terms for future period,
deterioration of external economic conjuncture: recurrent landslide of prices at the world raw
materials markets (integral estimate 11), increasing the debt crisis in euro area (integral
estimate 9).
At the same time, despite the Ukrainian economy’s significant dependence on external
factors, the latter’s impact on the domestic market situation, increased expert opinions on the
probability of internal risks.
The highest integral estimate (14) among domestic risks of 2013 year has been given to:
significant growth in the state budget deficit and cash gaps of the Pension Fund, other state
social insurance funds and Naftohaz Ukrainy NJSC. Rather high position has been occupied
by risks associated with strengthening of devaluation tendencies at the monetary market ,
remaining low credit activity of commercial banks (integral estimate is 12). At the same time,
high integral estimate was given to: expansion of the real economy’s insolvency, carrying out
considerable emission to finance the budget deficit (integral estimate 10).
Among foreign risks for 2014, as for 2013, high integral estimate belongs to the risk of
deficit of external funding and shrinkage of possibilities of access to the international capital
markets (estimate 11 for 2014), failure to obtain planned financing from the IMF (estimate 10
for 2014) and curtailing of investment plans by foreign companies or postponement of their
realization terms for future period (estimate 11 for 2013 and 10 for 2014). At the same time,
expert’s estimate of the risk of deterioration of external economic conjuncture: recurrent
landslide of prices at the world raw materials markets and increasing the debt crisis in euro
area decreased as of 2013 from 11 to 9 and 9 to 8 accordingly.
The risk of significant growth in the state budget deficit and cash gaps of the Pension Fund,
other state social insurance fund s and Naftohaz Ukrainy NJSC has the greatest integral
estimate among domestic risks for 2014 (integral estimate 13). Besides, the forecasters
have high estimates (integral estimate 12) of such risks as strengthening of devaluation
23. 23
tendencies at the monetary market, carrying out considerable emission to finance the budget
deficit and remaining low credit activity of commercial banks (estimate 11).
So, among estimated domestic risks for 2014, risks in banking and budgetary sectors remain
the most likely and influential.
Table 5
Integral estimates of Foreign risks for 2013-2014 (as of August 2013)
Foreign risks
2013 2014
Integral
estimate
Probability
estimates
of
occurrence
realization
Estimates of
the
occurrence
impact on the
economy of
Ukraine
Integral
estimate
Probability
estimates
of
occurrence
realization
Estimates of the
occurrence
impact on the
economy of
Ukraine
Deficit of external funding and shrinkage
of possibilities of access to the
international capital markets
12 4 3 11 3 3
Failure to obtain planned financing from
the IMF
12 4 3 10 3 3
Curtailing of investment plans by foreign
companies or postponement of their
realization terms for future period
11 4 3 10 3 3
Deterioration of external economic
conjuncture: recurrent landslide of prices
at the world raw materials markets
11 3 4 9 3 4
Increasing the debt crisis in euro area 9 3 3 8 3 3
Retention of the tendency of accelerated
prices increase at the world energy
markets
8 2 4 8 2 3
Slow growth of the USA economy 7 3 2 6 2 2
Euro devaluation and decrease of demand
in the European Union 6 2 3 6 2 3
Strengthening of the military conflict in the
Middle East 6 3 2 6 3 2
The probability of the countries leaving
euro area 4 2 2 4 2 2
Table 6
Integral estimates of Domestic risks for 2013-2014 (as of August 2013)
Domestic risks
2013 2014
Integral
estimate
Probability
estimates
of
occurrence
realization
Estimates of
the
occurrence
impact on
Ukraine`s
economy
Integral
estimate
Probability
estimates
of
occurrence
realization
Estimates of
the
occurrence
impact on
Ukraine`s
economy
Significant growth in the state budget deficit
and cash gaps of the Pension Fund, other
state social insurance funds and Naftohaz
Ukrainy NJSC
14 4 4 13 4 4
24. 24
Domestic risks
2013 2014
Integral
estimate
Probability
estimates
of
occurrence
realization
Estimates of
the
occurrence
impact on
Ukraine`s
economy
Integral
estimate
Probability
estimates
of
occurrence
realization
Estimates of
the
occurrence
impact on
Ukraine`s
economy
Strengthening of devaluation tendencies at
the monetary market
12 3 4 12 3 4
Remaining low credit activity of commercial
banks 12 4 3 11 3 3
Expansion of the real economy’s insolvency
10 3 3 9 3 3
Carrying out considerable emission to
finance the budget deficit
10 3 3 11 3 3
Large-scale capital outflow caused by lack of
stability at foreign financial and raw material
markets
9 3 3 8 3 3
Delay in increase of tariffs for natural gas
and public utilities 9 3 3 9 3 3
Risks of «a new wave» of destabilization in
the banking sector
9 3 3 8 2 3
Deterioration of the labour market situation:
reduction of the quantity of the employed and
increase in the quantity of the unemployed
9 3 3 8 3 3
Accumulation of VAT refund debt
8 3 3 7 3 2
Substantial increase of natural gas prices for
municipal heat and power engineering
enterprises
7 3 3 8 3 3
Failure to conduct privatization of large
entities
7 3 2 7 3 3
Increase of debt on payment for housing and
public utilities 6 2 2 7 3 2
Growth of wage arrears
6 2 2 7 2 3
Substantial increase of natural gas tariffs for
industry
6 2 3 8 2 3
Accumulation of the population’s negative
inflation expectations 6 2 2 7 2 3
Substantial increase of natural gas tariffs for
the population 6 2 3 6 2 3
Increase of revaluation tendencies at the
monetary market 3 1 2 3 1 3
25. 25
Table 7
Risks in April 2012 – August 2013
Integral estimates of risks
2013
April
2012
August
2012
November
2012
April
2013
August
2013
Foreign risks
Failure to obtain planned financing from the IMF х 8 8 10 12
Curtailing of investment plans by foreign companies or
postponement of their realization terms for a future period
7 8 8 10 11
Deterioration of foreign economic conjuncture: recurrent landslide
of prices at the world raw material markets
9 10 10 9 11
Deficit of foreign funding and shrinkage of possibilities of access to
the international capital markets
9 11 10 10 12
Retention of the tendency of accelerated prices increase at the
world energy markets
8 9 8 7 8
Increasing the debt crisis in euro area 9 8 10 8 9
Strengthening of the military conflict in the Middle East 9 8 8 6 6
Slow growth of the USA economy 6 8 8 7 7
Euro devaluation and decrease of demand in the European Union 7 8 7 6 6
The probability of the countries leaving euro area х 6 4 4 4
Domestic risks
Remaining low credit activity of commercial banks 11 10 11 12 12
Strengthening of devaluation tendencies at the monetary market 12 11 13 10 12
Significant growth in the state budget deficit and cash gaps of the
Pension Fund, other state social insurance funds and Naftohaz
Ukrainy NJSC
8 9 13 10 14
Carrying out considerable emission to finance the budget deficit 7 7 7 7 10
Delay in increase of tariffs for natural gas and public utilities 4 5 6 7 9
Expansion of the real economy’s insolvency 6 8 8 9 10
Risks of «a new wave» of destabilization in the banking sector 7 10 9 7 9
Accumulation of the population’s negative inflation expectations 7 8 9 5 6
Substantial increase of natural gas prices for municipal heat and
power engineering enterprises
10 9 10 9 7
Large-scale capital outflow caused by lack of stability at foreign
financial and raw material markets
9 8 9 9 9
Accumulation of VAT refund debt 6 6 9 7 8
Substantial increase of natural gas tariffs for industry 8 9 9 5 6
Growth of debt for utility services 5 7 7 6 6
Substantial increase of natural gas tariffs for the population 11 10 11 9 6
Deterioration of the labour market situation: reduction of the
quantity of the employed and increase in the quantity of the
unemployed
5 6 8 7 9
Failure to conduct privatization of large entities 5 4 6 5 7
Growth of wage arrears 5 6 5 6 6
Increase of revaluation tendencies at the monetary market 1 2 2 3 3
26. 26
Table 8
Risks in April 2012 – August 2013
Integral estimates of risks
2014
April
2013
August
2013
Foreign risks
Failure to obtain planned financing from the IMF 10 10
Curtailing of investment plans by foreign companies or postponement of
their realization terms for a future period
9 10
Deterioration of foreign economic conjuncture: recurrent landslide of prices
at the world raw material markets
8 9
Deficit of foreign funding and shrinkage of possibilities of access to the
international capital markets
8 11
Retention of the tendency of accelerated prices increase at the world
energy markets
8 8
Increasing the debt crisis in euro area 6 8
Strengthening of the military conflict in the Middle East 6 6
Slow growth of the USA economy 6 6
Euro devaluation and decrease of demand in the European Union 6 6
The probability of the countries leaving euro area 4 4
Domestic risks
Remaining low credit activity of commercial banks 11 11
Strengthening of devaluation tendencies at the monetary market 10 12
Significant growth in the state budget deficit and cash gaps of the Pension
Fund, other state social insurance funds and Naftohaz Ukrainy NJSC
9 13
Carrying out considerable emission to finance the budget deficit 9 11
Delay in increase of tariffs for natural gas and public utilities 8 9
Expansion of the real economy’s insolvency 8 9
Risks of «a new wave» of destabilization in the banking sector 7 8
Accumulation of the population’s negative inflation expectations 7 7
Substantial increase of natural gas prices for municipal heat and power
engineering enterprises
7 8
Large-scale capital outflow caused by lack of stability at foreign financial
and raw material markets
7 8
Accumulation of VAT refund debt 7 7
Substantial increase of natural gas tariffs for industry 6 8
Growth of debt for utility services 6 7
Substantial increase of natural gas tariffs for the population 6 6
Deterioration of the labour market situation: reduction of the quantity of the
employed and increase in the quantity of the unemployed
5 8
Failure to conduct privatization of large entities 5 7
Growth of wage arrears 5 7
Increase of revaluation tendencies at the monetary market 4 3
27. 27
Table 9
Consensus forecasts for 2013-2014
(as of August 2013)
Indicator
2013 2014 2013 2014
Average MIN MAX MIN MAX
Real sector UAH million
Nominal GDP 1 485 106 1 622 774 1 442 815 1 566 500 1 487 556 1 713 800
Consumption 1 336 072 1 441 194 1 280 900 1 399 314 1 290 071 1 519 700
Private 1 045 547 1 111 909 982 900 1 105 526 977 205 1 187 400
Government 291 061 320 376 266 637 305 147 281 377 400 821
Gross investments 258 789 299 804 178 660 320 750 220 853 372 854
Gross accumulation of the fixed capital 264 651 300 429 178 660 316 000 220 853 367 475
Private 225 800 266 740 140 160 276 615 214 500 323 400
Government 38 522 47 265 23 100 46 820 27 999 55 731
Net exportof goodsand non-factorial services -109 209 -112 118 -148 102 -67 814 -184 054 -69 215
Gross national savings 187 756 217 656 126 700 304 656 138 570 355 782
Index, year to year
RealGDP 100,1 102,3 95,1 101,5 97,4 104,6
Consumption 102,4 102,5 100,2 105,9 95,5 104,4
Private 102,9 102,1 100,0 107,7 90,1 105,5
Government 100,4 101,7 97,6 103,6 88,6 117,3
Gross accumulation of the fixed capital 98,1 105,1 82,7 108,0 99,3 114,4
Exportsof goodsand services 98,4 102,3 94,5 107,0 99,0 110,0
Import of goodsand services 99,8 103,3 92,6 105,5 96,3 109,3
Inflation index
Deflator of the GDP(annualaverage) 105,2 107,1 102,0 110,4 104,0 109,7
Consumer price index (annualaverage) 101,8 105,1 100,0 106,3 102,7 107,1
Dec. versusDec. of the previousyear 103,8 105,5 101,0 108,2 103,4 109,3
Producer price index (annualaverage) 103,8 107,4 99,4 113,2 103,7 114,1
Dec. versusDec. of the previousyear 106,7 107,7 102,6 111,8 104,1 112,0
External sector USD million
Currentaccount -13 161 -12 494 -16 037 -8 270 -17 377 -8 061
Exportsof goodsand services 89 779 94 548 84 872 93 200 81 374 101 116
Import of goodsand services -102 987 -107 232 -97 600 -108 914 -92 213 -115 449
Revenue balance -3 059 -3 184 -4 489 -2 100 -5 044 -1 700
Official transfers (net value) 3 106 3 372 2 500 4 000 2 800 4 100
Capital account balance 11 454 12 425 5 510 16 000 12 425 17 000
Foreign direct investments 6 085 6 501 4 764 8 500 6 501 9 000
External sector as percentage of the GDP
Currentaccount -7,3 -6,6 -9,0 -6,1 -8,9 -4,2
Exportsof goodsand services 49,6 50,1 46,8 52,4 45,8 57,3
Import of goodsand services -56,9 -56,8 -51,1 -59,7 -50,0 -62,4
28. 28
Indicator
2013 2014 2013 2014
Average MIN MAX MIN MAX
Revenue balance -1,7 -1,7 -2,5 -1,2 -2,7 -1,0
Official transfers (net value) 1,7 1,8 1,5 2,2 1,5 2,2
Capital account balance 6,3 6,6 3,0 8,8 3,3 8,9
Foreign direct investments 3,4 3,4 2,7 4,6 2,8 4,4
External sector as percent, year to year (nominal)
Exportsof goodsand services 100,8 104,9 95,2 107,0 95,9 110,0
Import of goodsand services 99,3 103,8 94,0 105,5 93,8 109,3
Exchange rate, UAH / USD
Average rate 8,21 8,59 8,00 8,50 8,20 9,60
End of period 8,49 8,74 8,15 9,60 8,20 9,60
Consolidated budget UAH million
All revenues 454 002 488 247 425 000 470 000 446 172 517 791
All expenditures 508 135 543 556 480 487 530 000 523 933 575 661
Total balance -54 133 -55 310 -84 063 -22 523 -79 162 -25 054
Privatisation 5 225 7 775 3 000 7 900 5 000 10 000
Consolidated budget % of GDP
All revenues 30,6 30,1 29,1 31,8 28,3 32,6
All expenditures 34,2 33,5 32,0 36,6 31,6 37,8
Total balance -3,6 -3,4 -5,7 -1,5 -5,2 -1,5
Privatisation 0,4 0,5 0,2 0,6 0,3 0,6
Money and credit
Base money (asof the end of period), UAH mln 281 512 312 377 265 000 297 700 286 200 340 400
Dec. versusDec. of the previousyear, % 10,3 11,0 3,8 16,6 6,0 16,0
Money supply (M3) (asofthe end of period),
UAH mln
875 334 998 019 846 153 915 000 939 730 1 100 000
Dec. versusDec. of the previousyear, % 13,2 14,0 8,9 18,0 10,0 20,6
Weighted annualaverage rate on commercial banks’
credits in the national currency, %, asofthe end of period 15,4 13,9 14,0 16,5 12,7 15,5
Gross NBU international reserve, USD mln 21 370 21 758 19 046 24 500 17 000 26 500
Social indicators
Population, million persons 45,4 45,3 45,3 45,5 45,0 45,4
changesin % versuspreviousyear 99,7 99,7 99,5 99,8 99,1 99,9
Monthly average wage ofworkers, UAH 3 276 3 608 3 089 3 400 3 345 3 869
Disposable income of population, UAH bln 1 248 1 343 1 151 1 630 1 238 1 809
Disposable income of population,
changesin % versuspreviousyear 5,4 5,1 1,0 14,0 2,8 11,0
31. 31
Таble 11
Dynamics of The Consensus Forecast for 2014
(April 2013 - of August 2013)
Indicator
April 2013 August 2013
Deviation
( August 2013 /
April 2013)
Real sector, UAH mln
Nominal GDP 1 690 117 1 622 774 -4%
Consumption 1 497 200 1 441 194 -3,7%
Investments 315 950 299 804 -5,1%
Net exportof goods and non-factorial services -112 581 -112 118 +463
Gross national savings 201 091 217 656 +8,2%
Indexс, year to year
RealGDP 103,3 102,3 -1 p.p.
Consumption 105,1 102,5 -2,6 p.p.
Gross accumulation of the fixed capital 104,5 105,1 +0,6 p.p.
Exportsof goodsand services 103,3 102,3 -1,0 p.p.
Import of goodsand services 104,2 103,3 -0,9 p.p.
Inflation, index
Consumer price index (annualaverage) 105,9 105,1 -0,8 p.p.
Dec. versusDec. of the previousyear 106,1 105,5 -0,6 p.p.
Producer price index (annualaverage) 107,7 107,4 -0,3 p.p.
Dec. versusDec. of the previousyear 108,0 107,7 -0,3 p.p.
External sector, USD million
Currentaccount -12 698 -12 494 +204
Exportsof goodsand services 99 191 94 548 -4,7%
Import of goodsand services -112 113 -107 232 -4,4%
Foreign direct investments 7 021 6 501 -7,4%
External sector, % ofGDP
Currentaccount -6,5 -6,6 -0,1 p.p.
Exportsof goodsand services 51,7 50,1 -1,6 p.p.
Import of goodsand services -57,6 -56,8 0,8 p.p.
Foreign direct investments 3,6 3,4 -0,2 p.p.
External sector, % yearto year (nominal)
Exportsof goodsand services 107,6 104,9 -2,7 p.p.
Import of goodsand services 106,2 103,8 -2,4 p.p.
Exchange rate, UAH / USD
Average rate 8,69 8,59 -1,2%
End of period 8,84 8,74 -1,1%
Consolidated budget, UAH mln
All revenues 519 940 488 247 -6,1%
All expenditures 572 282 543 556 -5%
Total balance -52 342 -55 310 -2 968
Privatisation 8 645 7 775 -10,1%
Consolidated budget, % ofGDP
All revenues 30,8 30,1 -0,7 p.p.
All expenditures 33,9 33,5 -0,4 p.p.
Total balance -3,1 -3,4 -0,3 p.p.
Privatisation 0,5 0,5 0
Money and credit
Base money (asof the end of period), UAH mln . 304 539 312 377 +2,6%
Dec. versusDec. of the previousyear, % 8,9 11,0 +2,1 p.p.
Money supply (M3) (asofthe end of period),
UAH mln 980 018 998 019 +1,8%
Dec. versusDec. of the previousyear, % 13,5 14,0 +0,5 p.p.
Average wage ofworkers, UAH 3 605 3 608 +0,1%
32. 32
Таble 12
Deviation of consensus forecasts for 2013 and 2014
(as of August 2013)
Indicator Consensus forecast for
2013 as of August 2013
Consensus forecast for
2014 as of August 2013
Deviation
(2014 / 2013)
Real sector, UAH mln
Nominal GDP 1 485 106 1 622 774 +9,3%
Consumption 1 336 072 1 441 194 +7,9%
Investments 258 789 299 804 +15,8%
Net exportof goods and non-factorial services -109 209 -112 118 -2 909
Gross national savings 187 756 217 656 +15,9%
Indexс, year to year
RealGDP 100,1 102,3 +2,2 p.p.
Consumption 102,4 102,5 +0,1 p.p.
Gross accumulation of the fixed capital 98,1 105,1 +7 p.p.
Exportsof goodsand services 98,4 102,3 +3,9 p.p.
Import of goodsand services 99,8 103,3 +3,5 p.p.
Inflation, index
Consumer price index (annualaverage) 101,8 105,1 +3,3 p.p.
Dec. versusDec. of the previousyear 103,8 105,5 +1,7 p.p.
Producer price index (annualaverage) 103,8 107,4 +3,6 p.p.
Dec. versusDec. of the previousyear 106,7 107,7 +1 p.p.
External sector, USD million
Currentaccount -13 161 -12 494 +667
Exportsof goodsand services 89 779 94 548 +5,3%
Import of goodsand services -102 987 -107 232 +4,1%
Foreign direct investments 6085 6 501 +6,8%
External sector, % ofGDP
Currentaccount -7,3 -6,6 +0,7 p.p.
Exportsof goodsand services 49,6 50,1 +0,5 p.p.
Import of goodsand services -56,9 -56,8 +0,1 p.p.
Foreign direct investments 3,4 3,4 0
External sector, % yearto year (nominal)
Exportsof goodsand services 100,8 104,9 +4,1 p.p.
Import of goodsand services 99,3 103,8 +4,5 p.p.
Exchange rate, UAH / USD
Average rate 8,21 8,59 +4,6%
End of period 8,49 8,74 +2,9%
Consolidated budget, UAH mln
All revenues 454 002 488 247 +7,5%
All expenditures 508 135 543 556 +6,97%
Total balance -54 133 -55 310 -1 177
Privatisation 5 225 7 775 48,8%
Consolidated budget, % ofGDP
All revenues 30,6 30,1 -0,5 p.p.
All expenditures 34,2 33,5 -0,7 p.p.
Total balance -3,6 -3,4 +0,2 p.p.
Privatisation 0,4 0,5 0
Money and credit
Base money (asof the end of period), UAH mln . 281 512 312 377 +11%
Dec. versusDec. of the previousyear, % 10,3 11,0 +0,7 p.p.
Money supply (M3) (asofthe end of period),
UAH mln 875 334 998 019 +14%
Dec. versusDec. of the previousyear, % 13,2 14,0 +0,8 p.p.
Average wage ofworkers, UAH 3 276 3 608 +10,1%
33. 33
Таble 13
Consensus forecasts for 2015-2016
(as of August 2013)
Indicator
2015-2016
Average MIN MAX
Real sector
Nominal GDP, UAH mln 1 856 406 1 529 820 2 276 963
Actual GDP, index, year to year 104,3 103,0 105,5
Inflation
Consumer price index (annualaverage) 106,0 104,6 108,2
Producer price index (annualaverage) 109,7 105,5 116,7
External sector USD mln
Currentaccount -12 867 -17 303 -4 578
Exportsof goodsand services 103 035 78 722 110 258
Imports of goodsand services -115 911 -85 200 -126 353
Foreign direct investments 7 834 6 300 9 500
External sector % of GDP
Currentaccount -6,1 -6,7 -2,8
Exportsof goodsand services 48,8 42,0 51,6
Imports of goodsand services -54,9 -48,8 -58,5
Foreign direct investments 3,7 2,4 4,2
External sector % year to year (nominal)
Exportsof goodsand services 107,1 96,7 111,0
Imports of goodsand services 105,2 92,4 109,9
Rate of exchange, UAH/USD
Average 8,79 8,45 9,20
End of period 9,02 8,50 9,50
Consolidated budget % of GDP
All revenues 31,3 28,9 31,2
All expenditures 33,9 31,5 34,4
Total balance -2,6 -3,3 -1,2
Privatisation х х х
Money and credit
Base money (asof the end of period), UAH mln 364 120 312 500 470 200
Dec. versusDec. of the previousyear, % 10,8 6,0 17,5
Money Supply (M3) (asofthe end of period), UAH mln 1 235 379 1 061 895 1 600 000
Dec. versusDec. of the previousyear, % 15,0 12,4 21,0
NBU grossinternational reserves, USD mln 27 063 25 000 28 214
Social indicators
Population, million persons 44,9 44,5 45,4
Monthly average wage ofworkers, UAH 3 945 3 635 4 200
34. 34
Methodological explanations to Tables 2, 3, 9, 10, 11, 12 and 13:
The aggregated nominal values were calculated as a simple averaged value of the sum of
the relevant indicators presented by all the forecasting organizations that participated in the
Consensus Forecast survey.
In order to equalize the averaged (consensus) figures of the aggregated nominal values with
the sum of their components, the averaged values of structural indicators (such as, for
example, consumption and investments) were calculated indirectly with the help of parts of
these components in the aggregated value. For example, if an average weight of
consumption in GDP is known, then a nominal value of consumption is equal to the sum of
this weight and the value of the averaged consensus GDP calculated as a simple average.
Indexes were calculated as a simple average of the sum of the relevant indicators presented
by all the organizations.
The average values of the indicators being forecasted as percentage of GDP (particularly,
indicators of the external sector and budget) were calculated as a ratio of the averaged
nominal value of the indicator to the relevant average GDP value. The indicators forecasted
in US dollars were calculated as a percentage of GDP on the base of averaged annual
exchange rate.
Growth rates of the monetary aggregates within the forecast for 2013 (as of August 2013)
were calculated as the ratio of the simple averaged nominal value from individual forecasted
indicators presented by the participants to the actual value of the relevant indicator for 2012,
and for 2014 – as the ratio of the simple averaged nominal value from individual forecasted
indicators presented by the participants to the relevant forecasted indicator for 2013 year.
Average values of the current account balance were calculated as the sum of average values
of the items of the account. Average values of budget deficit / surplus were calculated as a
difference between the average values of revenues and expenditures.
During preparation of the consensus forecast, the organizations attending the seminar
provided the following materials:
forecast assumptions regarding an economic policy to be pursued in 2013-2014, and
some quantitative exogenous parameters of development (presented in Table 4);
forecast of the main macroeconomic indicators for 2013 and 2014;
additional text explanations given by some organizations regarding forecast
assumptions;
expert assessment of risks for 2013-2014 (presented in Table 5, 6, 7 and 8).