
Recommended
More Related Content
What's hot
What's hot (19)
Similar to Conquest Quarterly Performance Report 4Q15
Similar to Conquest Quarterly Performance Report 4Q15 (20)
Conquest Quarterly Performance Report 4Q15
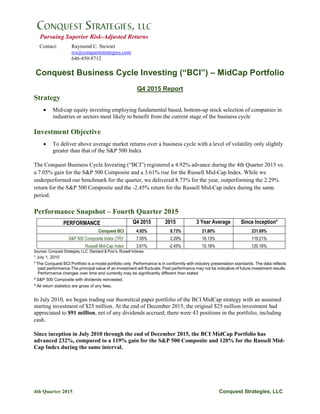
- 1. 4th Quarter 2015 Conquest Strategies, LLC Pursuing Superior Risk-Adjusted Returns Contact: Raymond C. Stewart rcs@conqueststrategies.com 646-450-8712 Conquest Business Cycle Investing (“BCI”) – MidCap Portfolio Q4 2015 Report Strategy Mid-cap equity investing employing fundamental based, bottom-up stock selection of companies in industries or sectors most likely to benefit from the current stage of the business cycle Investment Objective To deliver above average market returns over a business cycle with a level of volatility only slightly greater than that of the S&P 500 Index The Conquest Business Cycle Investing (“BCI”) registered a 4.92% advance during the 4th Quarter 2015 vs. a 7.05% gain for the S&P 500 Composite and a 3.61% rise for the Russell Mid-Cap Index. While we underperformed our benchmark for the quarter, we delivered 8.73% for the year, outperforming the 2.29% return for the S&P 500 Composite and the -2.45% return for the Russell Mid-Cap index during the same period. Performance Snapshot – Fourth Quarter 2015 PERFORMANCE Q4 2015 2015 3 Year Average Since Inception* Conquest BCI 4.92% 8.73% 21.80% 231.69% S&P 500 Composite Index (TR)2 7.05% 2.29% 16.13% 119.21% Russell Mid-Cap Index 3.61% -2.45% 15.18% 120.16% Sources: Conquest Strategies, LLC, Standard & Poor’s, Russell Indexes * July 1, 2010 1 The Conquest BCI Portfolio is a model portfolio only. Performance is in conformity with industry presentation standards. The data reflects past performance.The principal value of an investment will fluctuate. Past performance may not be indicative of future investment results. Performance changes over time and currently may be significantly different than stated 2 S&P 500 Composite with dividends reinvested. 3 All return statistics are gross of any fees. In July 2010, we began trading our theoretical paper portfolio of the BCI MidCap strategy with an assumed starting investment of $25 million. At the end of December 2015, the original $25 million investment had appreciated to $91 million, net of any dividends accrued; there were 43 positions in the portfolio, including cash. Since inception in July 2010 through the end of December 2015, the BCI MidCap Portfolio has advanced 232%, compared to a 119% gain for the S&P 500 Composite and 120% for the Russell Mid- Cap Index during the same interval.
- 2. 4th Quarter 2015 Conquest Strategies, LLC Performance during the 4th Quarter 2015 Our Portfolio continues to meet its primary objective to outperform the broader market over the long-term with a concentrated sector focus. We invest in under-valued companies in industry groups that have historically outperformed during the current phase of the business cycle. Our portfolio is diversified across multiple industry sectors and aims to provide strong risk-adjusted performance in up and down markets. Value-investing techniques, combined with technical analysis to fine- tune our entry and exit points are employed to generate alpha. During the 4th Quarter 2015, we scaled-back our Cash, Technology and Energy positions, and increased our Utilities weighting, from 3.12% at the end of November 2015 to 6.18% by the end of December 2015. Our Healthcare allocation rose to 4.04% in December 2015 when we increased our position in Cigna (CI). We have maintained a fairly low weighting for the Healthcare sector due to its lofty valuations. Shareholders approved the merger of Anthem (ANTM) and Cigna in December 2015 by an overwhelming margin to create the nation’s largest health insurance company. At current pricing, the Anthem-Cigna transaction offers compelling merger arbitrage opportunities if we allow for a successful closing of the deal with the next six months. We increased our position in the utility company Public Service Enterprises (PEG) in early December 2015, just prior to an upward move indicated by technical parameters. More importantly, as we indicated in our intentions in our Third Quarter 2015 Report, we increased our hedging position to 4.92% during December 2015 in anticipation of a market pullback. The Cameron International Corp (CAM) position we put on earlier in the year still looks promising. Shareholders approved the transaction on December 17, 2015 by a wide margin. CAM shareholders are slated to get $14.43 cash plus 0.716 shares of Schulmberger (SLB) for each share of CAM owned. The combination is expected to close sometime during this first quarter 2016. As of the close of 2015, our position in Verifone System (PAY) has not yet stabilized. We anticipatate adding to this position, barring a negative turn in fundamentals in the upcoming quarter. We have witnessed heightened volatility in U.S. markets during the 4th Quarter 2015, based on Federal Reserve actions to begin raising interests from near zero levels for the past several years, since the Great Top 10 Holdings (12/31/15) Sector Weightings (12/31/15) BCI S&P 500 Cash 7.31% Cash 7.31% Raymond James Financial Inc RJF 4.16% Technology 21.95% 22.95% Cigna Corp CI 4.04% Industrials 14.35% 10.90% MSCI Inc MSCI 3.98% Financial Services 13.66% 17.48% Arrow Electronics Inc ARW 3.89% Consumer Defensive 8.66% 9.51% ProShares Short Russell2000 RWM 3.77% Consumer Cyclicals 8.07% 11.43% Affiliated Managers Group Inc AMG 3.53% Energy 6.68% 7.06% Jack Henry & Associates, Inc JKHY 3.45% Utilities 6.18% 2.86% Hanesbrands Inc HBI 3.25% Basic Materials 4.17% 2.73% ARRIS Group Inc ARRS 3.04% Healthcare 4.04% 15.08% Hedging Activity 4.92% Sources: Conquest Strategies, LLC; Morningstar
- 3. 4th Quarter 2015 Conquest Strategies, LLC Recession, as well as a precipitous fall in oil prices and recent turmoil in Asian markets. While we remain cautious over the near term, we do see better opportunity over a longer time horizon. Selected Monthly Statistics Top 5 Gainers (12/31/15) Name Ticker Price $ Market Value $ 1 Mo. Return % The Kroger Co KR 41.83 2,718,950 11.07 Symantec Corp SYMC 21.00 525,000 8.09 ProShares Short Russell 2000 RWM 62.11 3,416,050 7.54 Cigna Corp CI 146.33 3,658,250 7.09 ProShares Short S&P 500 SH 20.87 1,043,500 3.26 Top 5 Losers (12/31/15) Name Ticker Price $ Market Value $ 1 Mo. Return % HollyFrontier Corp HFC 39.89 2,393,400 -16.49 Energy Select Sector SPDR ETF XLE 60.32 603,200 -13.18 Oshkosh Corp OSH 39.04 1,952,000 -10.99 Affiliated Managers Group Inc AMG 159.76 3,195,200 -9.86 PACCAR Inc PCAR 47.40 2,370,000 -8.78 BCI Stock Statistics (12/31/15) Portfolio Relative to S&P 500 Portfolio Relative to S&P 500 Forward P/E Ratio 12.90 0.70 5-Yr Proj EPS Growth% 11.39 1.16 P/B Ratio 2.70 1.08 Dividend Yield % 1.38 0.69 ROA 7.14 0.97 Average Market Cap $mil 10655.07 0.14 ROE 19.10 0.93 Source: Morningstar
- 4. 4th Quarter 2015 Conquest Strategies, LLC Quarterly Returns – (3Q 2010 inception —4Q 2015) 3Q10 4Q10 1Q11 2Q11 3Q11 4Q11 1Q12 2Q12 3Q12 4Q12 1Q13 2Q13 3Q13 4Q13 1Q14 2Q14 3Q14 4Q14 1Q15 2Q15 3Q15 4Q15 BCI 20.33% 15.49% 13.81% -2.35% -18.54% 14.05% 17.90% -3.33% 6.83% 7.18% 14.77% 0.61% 9.98% 11.58% 2.91% 6.01% -1.87% 7.38% 5.96% 0.63% -2.81% 4.92% S&P 500 10.72% 10.22% 5.40% 0.39% -14.33% 11.81% 12.58% -2.75% 6.35% -0.38% 10.61% 2.92% 5.25% 10.52% 1.80% 5.24% 1.13% 4.93% 1.84% 0.28% -6.43% 7.05% Russell Mid-Cap 13.32% 13.08% 7.43% 0.41% -18.90% 12.31% 12.94% -4.41% 5.58% 2.88% 12.95% 2.21% 7.70% 8.39% 3.53% 4.98% -1.66% 5.95% 3.95% -1.54% -8.01% 3.61% Source: Conquest Strategies, LLC; Standard & Poor’s, Russell Indexes * July 1, 2010 1 The Conquest BCI Portfolio is a model portfolio only. Performance is in conformity with industry presentation standards. The data reflects past performance. The principal value of an investment will fluctuate. Past performance may not be indicative of future investment results. Performance changes over time and currently may be significantly different than stated 2 S&P 500 Composite with dividends reinvested. 3 All return statistics are gross of any fees.
- 5. 4th Quarter 2015 Conquest Strategies, LLC How We Invest Investment Philosophy We believe that there is the potential to generate superior risk-adjusted returns by investing in undervalued companies in industries or sectors most likely to benefit from the current stage of the business cycle. We believe that there is greater opportunity to uncover and profit from pricing inefficiencies among lesser followed midcap stocks than large cap stocks. Our Role Within An Investor’s Total Portfolio To add total return to market-like returns of core equity allocation To buffer downside risk in broader core equity market allocations Where We See Opportunity While traditional buy and hold strategies may be ineffective in the current market, there are ways to take advantage of where we are in the business cycle. Phases of the business cycle are believed to be a primary factor affecting stock prices. Being at the “right place at the right time,” industry and sector-wise — coupled with proper stock selection, based on strong or improving fundamentals — are critical ingredients for successful investing over a business cycle. Investment Process Portfolio Construction We aim to build a portfolio of at least 20 names (based on the aggregate size of the portfolio), acquiring positions of up to 5% per holding. Portfolio construction starts with our determination of where we believe the US economy is currently situated in terms of the business cycle. Our analysis takes into consideration data-based factors that include unemployment trends, personal income, industrial production utilization, sales in housing, durable goods and retail, consumer expectations, interest rates, the yield curve and commodity prices. We also recognize that the stock market cycle tends to precede the business cycle by an average of six months, as investors try to anticipate when the market will respond to changes in the economy. We believe that by monitoring such a leading indicator trends we can better anticipate changes in the business cycle. As stock market cycle trending tends to change over a period of months we believe there is the potential to use that in helping separate market noise from what may be an actual change in trend. Securities Selection Once the phase of the business cycle has been determined, we focus on the industries likely to benefit during that phase and apply our bottom up stock picking approach to generate a list of companies that meet our criteria. Our factor analysis includes return on assets, price earnings multiples, price to book ratios, and price to cash flow. We tend to prefer companies with low relative price earnings ratios, and low price to revenues also on a relative basis. With that information in hand and analyzed we then calculate a company’s intrinsic value. We believe this helps lead us to find good companies at discounted prices. Trade Execution For trade execution in putting on a position we use technical analysis to determine entry and exit points we want to take in a stock. We employ tools such as Bollinger bands, stochastics and relative strength indicators for each company on our buy list. When our indicators line up properly, we will initiate a position. Conversely, we will generally scale out of a stock as it appreciates. We will scale back in if it offers additional opportunities.
- 6. 4th Quarter 2015 Conquest Strategies, LLC Occasional Hedging Technical analysis may also be used to determine when to hedge the portfolio through the use of inverse ETFs. We will consider putting on a hedge when we anticipate that the market may have exhausted its near- term upside potential. When we believe market conditions indicate this may no longer be the case, we remove any hedge positions we may have previously put on. A process like this is applied to every company that goes into the portfolio. Additionally, companies are diversified across industry sectors to mitigate risk. Sell Discipline Three conditions tend to necessitate the sale of a position: If the company reaches our price objective. If there is a change in the fundamentals of the company. If the technicals indicate a change may be forthcoming. # # #