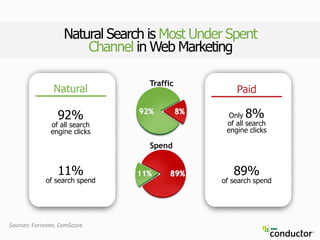
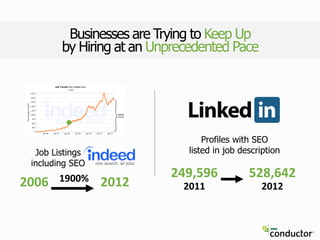
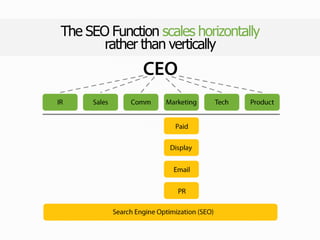
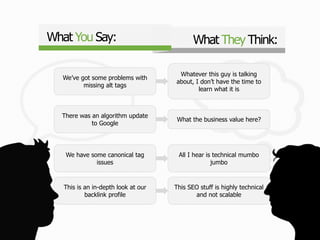
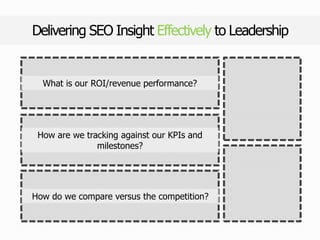
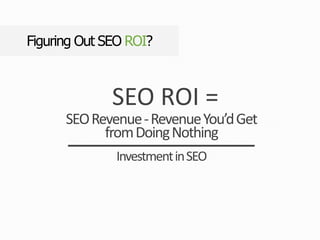
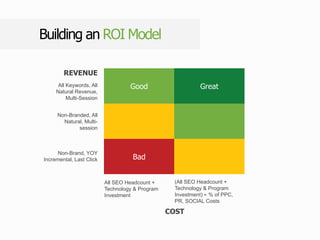
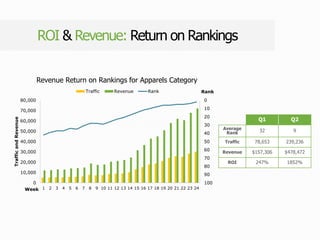
SEO Leadership
• 150+ pieces of SEO thought
leadership in 2012
• C3, the largest user conference
in enterprise SEO
• Dedicated to raising the profile
of search marketers
Conductor Searchlight
• Supporting SEO success for
over 2000 leading brands
• $4.5B in SEO revenue under
management
• 18TB of SEO data collected
weekly
Who We Are
• Founded in 2006
• Located in New York, San
Francisco, and Boston
Consumers Revolting Against Traditional Marketing
86% of people skip TV ads
44% of direct mail is never opened
200 million on the FTC “Do Not Call”
Percent change
Watching TV
5%
Using the Internet
121%
Listening to
the radio
(not online)
-15%
Reading
newspapers
(not online)
-26%
Reading
magazines
(not online)
-18%
“In a typical week, how many hours do you
spend doing each of the following?
84% of people leave website with
intrusive of irrelevant ads
91% of email users have unsubscribed from a
company email they previously opted into
{
{
Outbound Inbound
Marketing Has Changed to Adapt
Customers are choosing to have
conversations on their terms
There are 3 billion searches every day
Direct19%
7%
.8%
.7%
Organic Search is Almost Always the #1 or #2 Traffic
Source to Any Product or Service Company Worldwide
Source: Shareaholic Feb 2012 All Traffic Sources Report
(organic)
50% +
2%
1%
SEO Out Performs Paid Search by 2x
and Social Media by 4X
Source: Hubspot, State of Inbound Marketing, 2012
11%
8%92%
Traffic
Spend
89%11%
Natural Search is Most Under Spent
Channel in Web Marketing
Sources: Forrester, ComScore
Natural
92%
of all search
engine clicks
11%
of search spend
Paid
89%
of search spend
Only 8%
of all search
engine clicks
Profiles with SEO
listed in job description
249,596
2011
528,642
2012
Businesses are Trying to Keep Up
by Hiring at an Unprecedented Pace
2006 20121900%
Job Listings
including SEO
Achieve success with cross-functional collaboration
The SEO Function scales horizontally
rather than vertically
What They Think:What You Say:
We’ve got some problems with
missing alt tags
Whatever this guy is talking
about, I don’t have the time to
learn what it is
There was an algorithm update
to Google
What the business value here?
We have some canonical tag
issues
All I hear is technical mumbo
jumbo
This is an in-depth look at our
backlink profile
This SEO stuff is highly technical
and not scalable
Delivering SEO Insight Effectively to Leadership
How are we tracking against our KPIs and
milestones?
What is our ROI/revenue performance?
How do we compare versus the competition?
SEO ROI =
SEORevenue-RevenueYou’dGet
fromDoingNothing
InvestmentinSEO
Figuring Out SEO ROI?
Building an ROI Model
Good Great
Bad
All Keywords, All
Natural Revenue,
Multi-Session
(All SEO Headcount +
Technology & Program
Investment) - % of PPC,
PR, SOCIAL Costs
Non-Branded, All
Natural, Multi-
session
Non-Brand, YOY
Incremental, Last Click
All SEO Headcount +
Technology & Program
Investment
REVENUE
COST
ROI & Revenue: Return on Rankings
0
10
20
30
40
50
60
70
80
90
1000
10,000
20,000
30,000
40,000
50,000
60,000
70,000
80,000
1 2 3 4 5 6 7 8 9 10 11 12 13 14 15 16 17 18 19 20 21 22 23 24
Rank
TrafficandRevenue
Week
Revenue Return on Rankings for Apparels Category
Traffic Revenue Rank
Q1 Q2
Average
Rank 32 9
Traffic 78,653 239,236
Revenue $157,306 $478,472
ROI 247% 1852%
ROI & Revenue: Return on Rankings
1
11
21
31
41
51
61
71
81
91
0
20,000
40,000
60,000
80,000
100,000
120,000
140,000
160,000
1 2 3 4 5 6 7 8 9 10 11 12 13 14 15 16 17 18 19 20 21 22 23 24
Rank
TrafficandRevenue
Week
Revenue Return on Rankings for Apparels Category
Traffic Revenue Rank
KPIs and Milestones: Rank Performance
Page 1
Keywords
Page Keyword Rank Growth YoY
1 +230
2 -9
3 +54
Page 2+
Keywords
KPI and Milestones: Leading Indicators to ROI
Keyword KPIs URL KPIs Competitive KPIs
Unique Ranking URLs
URL/Keyword Saturation
Ranking Keywords
Percentage Ranking Keywords
Market Share vs. Competitor 1
Prime Keyword Win %
Your Critical Wins and Misses
Competitive Insight: Market Share vs. Key Competitors
You
Competitors
Competitor 2
Competitor 1
Competitive Insight: Bottoms Up Competitive Insight
Channel Partner Manufacturer
Where Amazon is Beating Us vs. Target
You
Competitor Competitor
A Holistic Set
of Metrics to
Effectively
Engage
Leadership
KPI’S
AND
MILESTONES
ROI
AND REVENUE
WINS, LOSSES,
AND COMPETITIVE
POSITIONING
What They Think Do:What You Say:
Here’s how our market has
improved versus our most
important competitor
This is really helpful. Do you
need more resources?
Here are the top 10 revenue
opportunities in natural search
I want to go after this. Do you
need more money?
This is a new competitor we
identified as trending upwards
An investment in content for
natural search would really pay
off. Do you need more
engineers?
Here are the steps we must
take if we want to protect our
current revenue
This sounds good but you
deserve a vacation first
For more resources and the full presentation, visit:
http://conductor.com/ses-2013
Download this Presentation

SES NY 2013 | Seth Besmertnik: "SEO in the Boardroom: Tangible Search Metrics"

  • 2.
    SEO Leadership • 150+pieces of SEO thought leadership in 2012 • C3, the largest user conference in enterprise SEO • Dedicated to raising the profile of search marketers Conductor Searchlight • Supporting SEO success for over 2000 leading brands • $4.5B in SEO revenue under management • 18TB of SEO data collected weekly Who We Are • Founded in 2006 • Located in New York, San Francisco, and Boston
  • 3.
    Consumers Revolting AgainstTraditional Marketing
  • 4.
    86% of peopleskip TV ads
  • 5.
    44% of directmail is never opened
  • 6.
    200 million onthe FTC “Do Not Call”
  • 7.
    Percent change Watching TV 5% Usingthe Internet 121% Listening to the radio (not online) -15% Reading newspapers (not online) -26% Reading magazines (not online) -18% “In a typical week, how many hours do you spend doing each of the following?
  • 8.
    84% of peopleleave website with intrusive of irrelevant ads
  • 9.
    91% of emailusers have unsubscribed from a company email they previously opted into
  • 10.
  • 11.
    Customers are choosingto have conversations on their terms
  • 12.
    There are 3billion searches every day
  • 13.
    Direct19% 7% .8% .7% Organic Search isAlmost Always the #1 or #2 Traffic Source to Any Product or Service Company Worldwide Source: Shareaholic Feb 2012 All Traffic Sources Report (organic) 50% + 2% 1%
  • 14.
    SEO Out PerformsPaid Search by 2x and Social Media by 4X Source: Hubspot, State of Inbound Marketing, 2012
  • 15.
    11% 8%92% Traffic Spend 89%11% Natural Search isMost Under Spent Channel in Web Marketing Sources: Forrester, ComScore Natural 92% of all search engine clicks 11% of search spend Paid 89% of search spend Only 8% of all search engine clicks
  • 16.
    Profiles with SEO listedin job description 249,596 2011 528,642 2012 Businesses are Trying to Keep Up by Hiring at an Unprecedented Pace 2006 20121900% Job Listings including SEO
  • 17.
    Achieve success withcross-functional collaboration
  • 18.
    The SEO Functionscales horizontally rather than vertically
  • 19.
    What They Think:WhatYou Say: We’ve got some problems with missing alt tags Whatever this guy is talking about, I don’t have the time to learn what it is There was an algorithm update to Google What the business value here? We have some canonical tag issues All I hear is technical mumbo jumbo This is an in-depth look at our backlink profile This SEO stuff is highly technical and not scalable
  • 20.
    Delivering SEO InsightEffectively to Leadership How are we tracking against our KPIs and milestones? What is our ROI/revenue performance? How do we compare versus the competition?
  • 21.
  • 22.
    Building an ROIModel Good Great Bad All Keywords, All Natural Revenue, Multi-Session (All SEO Headcount + Technology & Program Investment) - % of PPC, PR, SOCIAL Costs Non-Branded, All Natural, Multi- session Non-Brand, YOY Incremental, Last Click All SEO Headcount + Technology & Program Investment REVENUE COST
  • 23.
    ROI & Revenue:Return on Rankings 0 10 20 30 40 50 60 70 80 90 1000 10,000 20,000 30,000 40,000 50,000 60,000 70,000 80,000 1 2 3 4 5 6 7 8 9 10 11 12 13 14 15 16 17 18 19 20 21 22 23 24 Rank TrafficandRevenue Week Revenue Return on Rankings for Apparels Category Traffic Revenue Rank Q1 Q2 Average Rank 32 9 Traffic 78,653 239,236 Revenue $157,306 $478,472 ROI 247% 1852%
  • 24.
    ROI & Revenue:Return on Rankings 1 11 21 31 41 51 61 71 81 91 0 20,000 40,000 60,000 80,000 100,000 120,000 140,000 160,000 1 2 3 4 5 6 7 8 9 10 11 12 13 14 15 16 17 18 19 20 21 22 23 24 Rank TrafficandRevenue Week Revenue Return on Rankings for Apparels Category Traffic Revenue Rank
  • 25.
    KPIs and Milestones:Rank Performance Page 1 Keywords Page Keyword Rank Growth YoY 1 +230 2 -9 3 +54 Page 2+ Keywords
  • 26.
    KPI and Milestones:Leading Indicators to ROI Keyword KPIs URL KPIs Competitive KPIs Unique Ranking URLs URL/Keyword Saturation Ranking Keywords Percentage Ranking Keywords Market Share vs. Competitor 1 Prime Keyword Win %
  • 27.
  • 28.
    Competitive Insight: MarketShare vs. Key Competitors You Competitors
  • 29.
    Competitor 2 Competitor 1 CompetitiveInsight: Bottoms Up Competitive Insight Channel Partner Manufacturer
  • 30.
    Where Amazon isBeating Us vs. Target You Competitor Competitor
  • 31.
    A Holistic Set ofMetrics to Effectively Engage Leadership KPI’S AND MILESTONES ROI AND REVENUE WINS, LOSSES, AND COMPETITIVE POSITIONING
  • 32.
    What They ThinkDo:What You Say: Here’s how our market has improved versus our most important competitor This is really helpful. Do you need more resources? Here are the top 10 revenue opportunities in natural search I want to go after this. Do you need more money? This is a new competitor we identified as trending upwards An investment in content for natural search would really pay off. Do you need more engineers? Here are the steps we must take if we want to protect our current revenue This sounds good but you deserve a vacation first
  • 33.
    For more resourcesand the full presentation, visit: http://conductor.com/ses-2013 Download this Presentation